Q4 Beat and 2026 Guidance Give Honeywell (HON) Fresh Fuel Into a Strong Spring Window
Honeywell is heading into a historically strong 48-day spring stretch just as the stock trades well below its 52-week high and investors weigh upbeat 2026 guidance against a choppy tape.

Key takeaways
- From Mar 30, Honeywell enters a 48-day window that has produced gains in 9 of the past 10 years, a 90% hit rate for long setups.
- Average profit in winning years is 3.97%, while the all-years average including the lone loss still comes in at 3% over the window.
- The pattern is long-biased, with a Trade Direction of “long” and a Sharpe ratio of 1.46 across the sample.
- Intraperiod swings have been meaningful, with some years showing double-digit peak run-ups and mid-single-digit drawdowns before finishing higher.
- Honeywell closed at $223.01 on Monday, about 10.1% below its 52-week high of $248.18, leaving room above if the seasonal tailwind repeats.
- Strong Aerospace Technologies and Building Automation growth plus 2026 guidance for mid-single-digit organic sales gains set the fundamental backdrop for this seasonal window.[1][2]
According to historical data from TradeWave.ai, this upcoming stretch for Honeywell has behaved very differently from an average month on the calendar, with a clear long-side bias that many investors may not have on their radar.
Seasonal window
Honeywell has risen in 9 of the past 10 years during the 48-day window that begins on Mar 30, averaging 3.97% gains in the winning years. The stock last closed at $223.01, up 0.7% on the day and about 10.1% below its 52-week high of $248.18, with the seasonal window set to open next week.
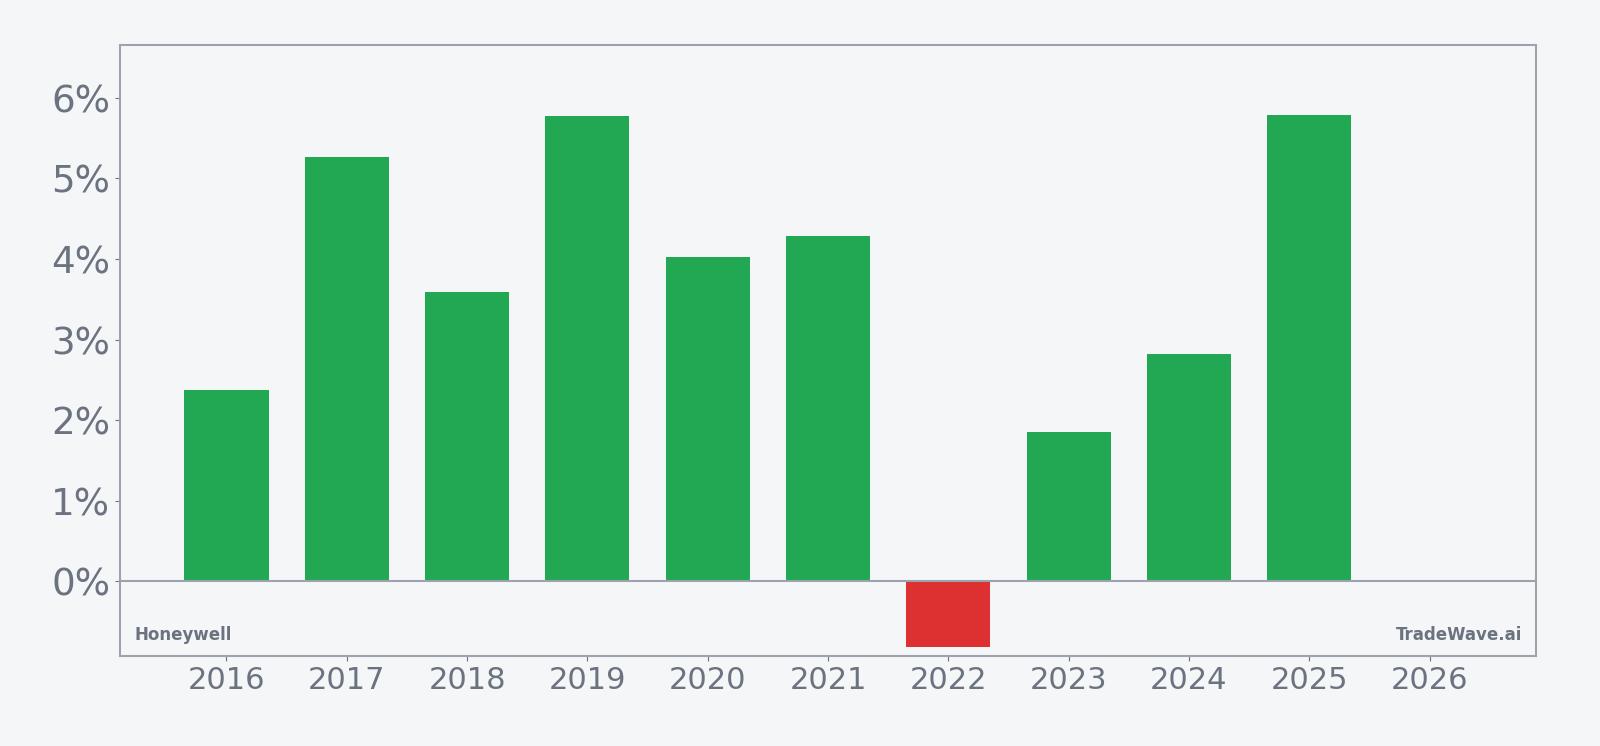
Across the decade-long sample, the long-side bias is clear. Percent Profitable sits at 90%, with 9 winners against just 1 loser, and the all-years average return of 3% shows that the single down year did not erase the gains from the stronger cycles. For traders who care about risk-adjusted outcomes, the Sharpe ratio of 1.46 for this window is unusually solid for a single 48-day slice of the calendar.
The per-year breakdown shows how that plays out in practice. In 2019, Honeywell gained 5.77% from entry to exit during this window, while 2025 delivered a similar 5.79% net return. Even the softer positive years, such as 2016 at 2.38% and 2023 at 1.85%, still finished green, which helps explain why the Median Profit sits at 3.8% despite the lone 0.81% loss in 2022.
Intraperiod swings have been meaningful. Maximum favorable excursion, or the best point-to-peak move during the window, reached 12.24% in 2020 and 7.97% in 2019, showing that in strong years the stock has often run well beyond the final close before consolidating. On the flip side, maximum adverse excursion, the worst drawdown from entry, hit -15.3% in 2025 and -10.46% in 2020, a reminder that even winning windows have contained sharp air pockets.
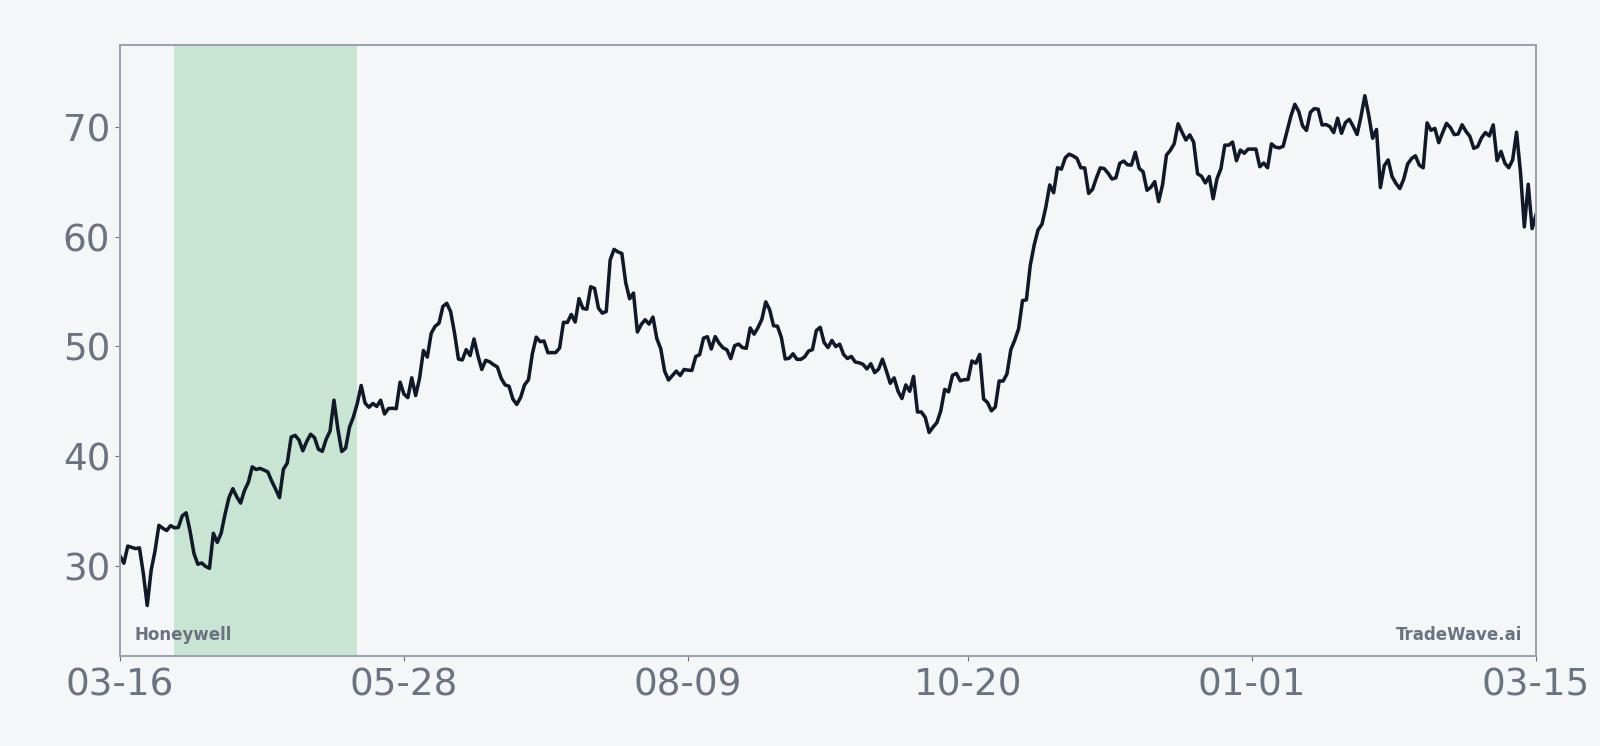
The historical seasonal trend chart smooths those individual years into a typical path. It shows gains tending to build gradually rather than in a single spike, with strength often clustering in the middle of the window before flattening out toward the end. That profile fits a long setup where patience has historically been rewarded more than quick scalps.
The combined net, peak run-up and worst drawdown by year show how much room Honeywell has historically had to move inside this window.
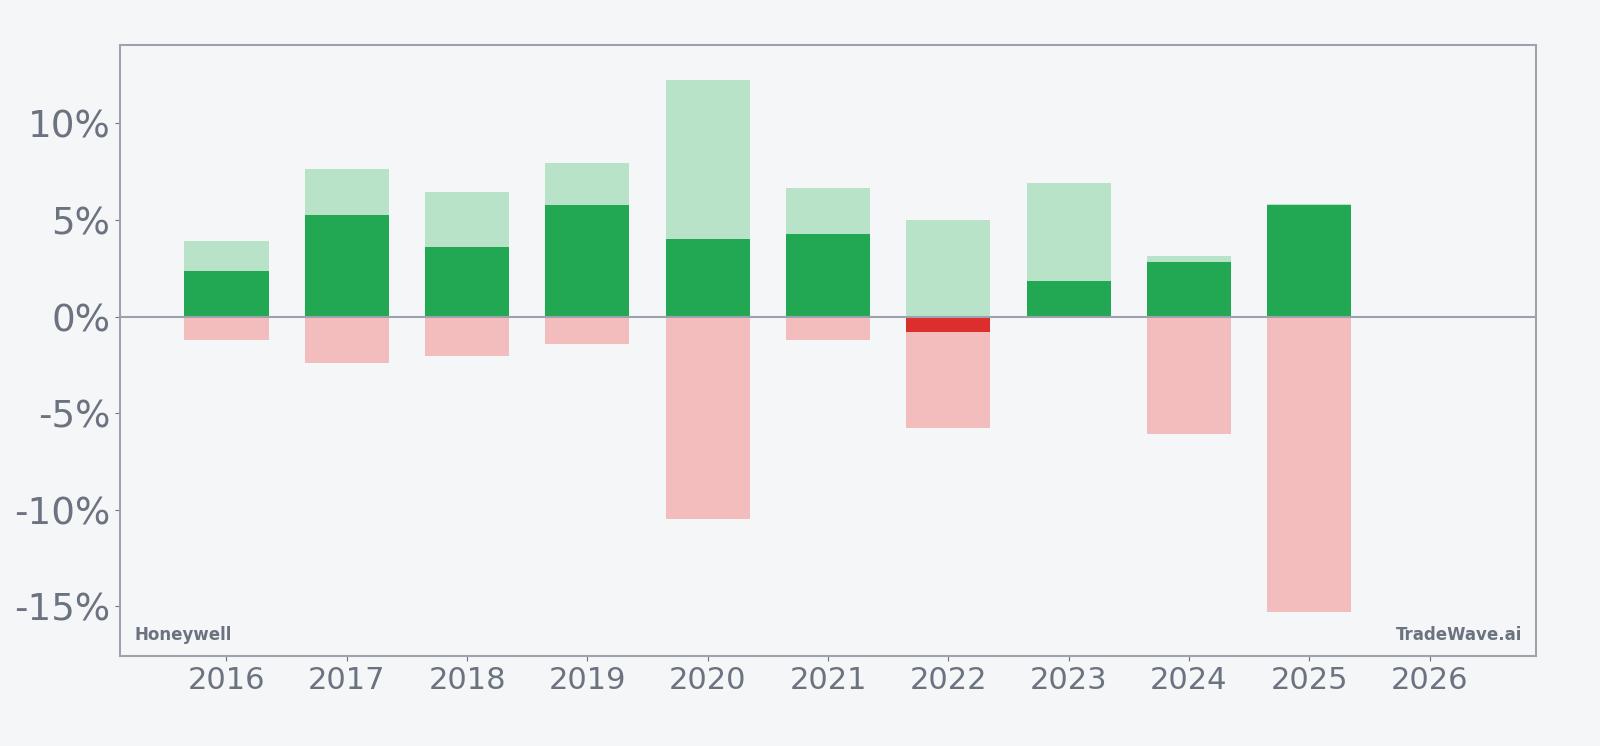
The stacked net, MFE and MAE bars underline the trade-off. In most years, the green bars for peak favorable moves extend several percentage points above the final net, while the red bars for worst drawdowns often sit in the mid-single digits. Add it up: this has been a long-friendly window with real upside potential, but the path has rarely been smooth.
History does not guarantee future results; adverse excursions can be large even in winning windows, so position sizing and risk controls matter as much as the seasonal edge.
Price and near-term drivers
Honeywell shares closed Monday at $223.01, up 0.7% on the session, after trading between $222.91 and $226.50. The stock sits about 10.1% below its 52-week high of $248.18 and well above its 52-week low near $162, with the 50-day moving average around $230.24 and 20-day average volume close to 4.0 million shares.
Fundamentals have been supportive heading into this seasonal window. On Jan 29, Honeywell reported Q4 2025 adjusted EPS of $2.59, topping estimates of $2.53, with revenues of $9.8 billion and organic sales up 11% year over year, led by Aerospace Technologies and Building Automation.[1][2] Management guided 2026 sales to a range of $38.8 billion to $39.8 billion, organic growth of 3% to 6%, adjusted EPS between $10.35 and $10.65, and free cash flow of $5.3 billion to $5.6 billion, framing a steady, cash-generative outlook.[1][2]
Sector positioning also matters. Honeywell sits at the intersection of aerospace and industrial automation, two areas that have been driving its recent revenue growth and are central to the company’s planned portfolio reshuffle and spinoffs aimed at sharpening focus and efficiency.[1] In late January, some commentators highlighted that combination of growth and balance-sheet strength as a reason institutional investors have been comfortable paying a premium multiple for the stock.[5]
On the Street, the tone is constructive but not euphoric. The consensus rating sits at Hold, with a blended price target around $255 from JPMorgan and Zacks, implying moderate upside from current levels if the company executes on its 2026 plan.[3][11] In mid-January 2026, JPMorgan framed Honeywell as a buy in the context of its ongoing break-up strategy, arguing that the sum-of-the-parts story could unlock additional value over time, although that call came when the stock was trading in a slightly different price regime.[3]
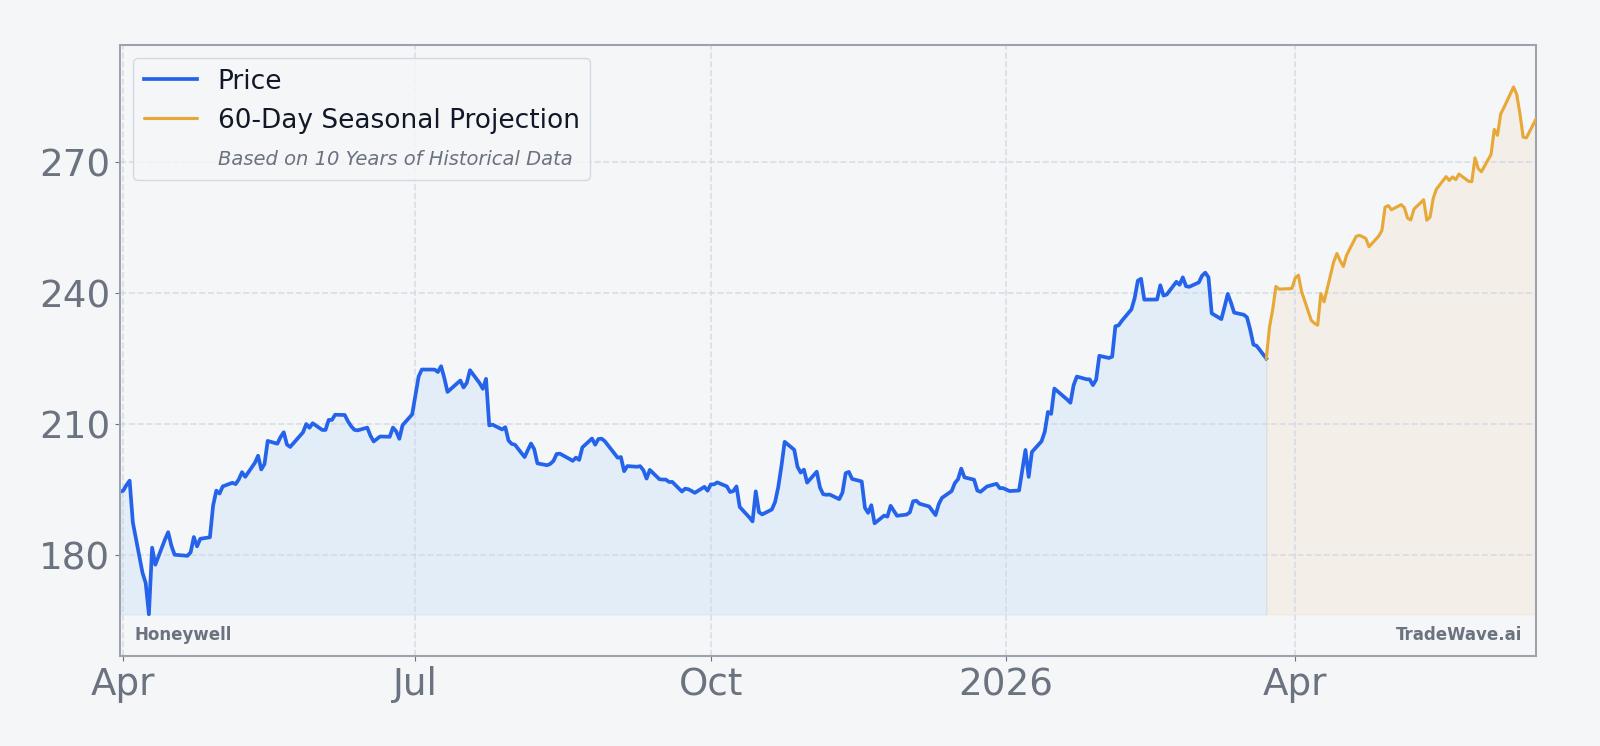
The chart below situates the latest move in its recent multi-month context alongside a 60-day seasonal projection.
Earnings and guidance backdrop
The Q4 2025 print gave investors a clean read on how Honeywell is exiting the year. Adjusted EPS of $2.59 beat consensus by $0.06, even as reported revenues of $9.8 billion came in slightly below the $10.07 billion estimate, thanks to mix and FX.[1][2] The more important detail for many portfolio managers was the 11% organic sales growth, which showed that underlying demand in key segments remains firm.[1][2]
Aerospace Technologies and Building Automation were the standouts, with aerospace benefiting from continued strength in commercial aviation and defense, and building systems riding demand for energy efficiency and smart infrastructure.[1] Those are exactly the kinds of recurring, high-margin businesses that can support a stock through bouts of macro volatility, which matters when traders are weighing whether to lean into a seasonal pattern.
Looking ahead, the 2026 guidance range for 3% to 6% organic sales growth and mid-teens EPS of $10.35 to $10.65 sets a baseline for expectations.[1][2] Free cash flow guidance of $5.3 billion to $5.6 billion gives Honeywell room to keep funding dividends, buybacks and selective M&A, even as it executes on planned spinoffs that are meant to streamline the portfolio.[1]
Macro and sector context
Honeywell’s mix makes it sensitive to several macro currents at once. Aerospace exposure ties it to global travel and defense budgets, while building automation and industrial software link it to construction cycles, energy efficiency mandates and corporate capex. In late 2025, coverage of the stock often framed it as a way to play both industrial resilience and the push toward smarter, lower-emission infrastructure.[4][5]
That positioning has pros and cons for the upcoming window. If growth data and rate expectations stay supportive, Honeywell can trade as a quality cyclical with leverage to aerospace and automation. If macro headlines turn choppier, the same exposure can amplify swings, which is where the historical MFE and MAE profile for this window becomes relevant: the stock has a track record of moving quickly in both directions before settling on a final outcome.
Valuation check
Valuation commentary around Honeywell in early 2026 has tended to describe the stock as a quality compounder trading at a premium to the broader industrials group, but not at extremes given its cash generation and portfolio mix.[5] The roughly $255 consensus price target from JPMorgan and Zacks implies investors are willing to underwrite additional upside if management delivers on its 2026 plan and the break-up thesis plays out.[3][11]
For traders eyeing the seasonal window, that matters because it shapes how much “good news” is already in the price. A stock priced for perfection can react violently to small disappointments, while one with more modest expectations can sometimes grind higher in line with historical patterns even on merely solid news.
What to watch as the window opens
The 48-day window starting Mar 30 has a strong track record for Honeywell, with 9 winners against 1 loser and average gains in the mid-single digits for the winning years. The key for traders is how the stock behaves as that window opens relative to a few concrete markers.
First, watch the price action around the 50-day moving average near $230. A decisive move back above that level early in the window would be consistent with the historical pattern of gains building through the middle of the period. A failure there, especially on rising volume, would be an early sign that this iteration may diverge from the past.
Second, monitor any updates on the planned spinoffs and portfolio reshaping, as well as commentary around aerospace demand and building automation orders.[1][4][5] Positive headlines in those areas have historically been catalysts for the stock, and fresh news landing inside a seasonally strong stretch can amplify moves.
Third, keep an eye on how Honeywell trades around the $248 area, which marks the 52-week high. A push toward that zone during the window would line up with the historical tendency for sizable maximum favorable excursions, while a stall well below it would suggest investors are more cautious this time.
Finally, watch the tape for signs of intraday volatility. In prior years, even winning windows have seen drawdowns of 5% to 10% from entry before recovering. If similar swings show up again, they will not confirm or refute the seasonal edge on their own, but they will echo the pattern of sharp moves inside what has, on balance, been a favorable stretch for longs.
Sources
- [1] Zacks Investment Research, “HON's Q4 Earnings Top Estimates, Aerospace Technologies Sales Up Y/Y,” Jan 29, 2026.
- [2] Yahoo Finance, “HON's Q4 Earnings Top Estimates, Aerospace Technologies Sales Up Y/Y,” Jan 29, 2026.
- [3] CNBC, “Honeywell is a buy as planned break-up continues, JPMorgan says,” Jan 16, 2026.
- [4] CNBC, “Honeywell stock is soaring — why we think there is plenty of more room to run,” Oct 23, 2025.
- [5] Forbes, “Why Smart Money Should Buy Honeywell Stock,” Jan 30, 2026.
- [6] Yahoo Finance, “Honeywell expects $470 million charge from Flexjet settlement,” Dec 22, 2025.
- [7] CNBC, “Stocks making the biggest moves premarket: Honeywell, Strategy, Oracle & more,” Dec 22, 2025.
- [11] Zacks Investment Research, Honeywell (HON) analyst estimates and price target, accessed Jan 2026.