M&T Bank (MTB) Has Rallied in 10 Straight 21-Day Spring Windows Starting Apr. 6
M&T Bank is heading toward a 21-day spring stretch that has never been negative in the past decade, with shares hovering near $200 as investors weigh its rate-sensitive earnings profile.

Key takeaways
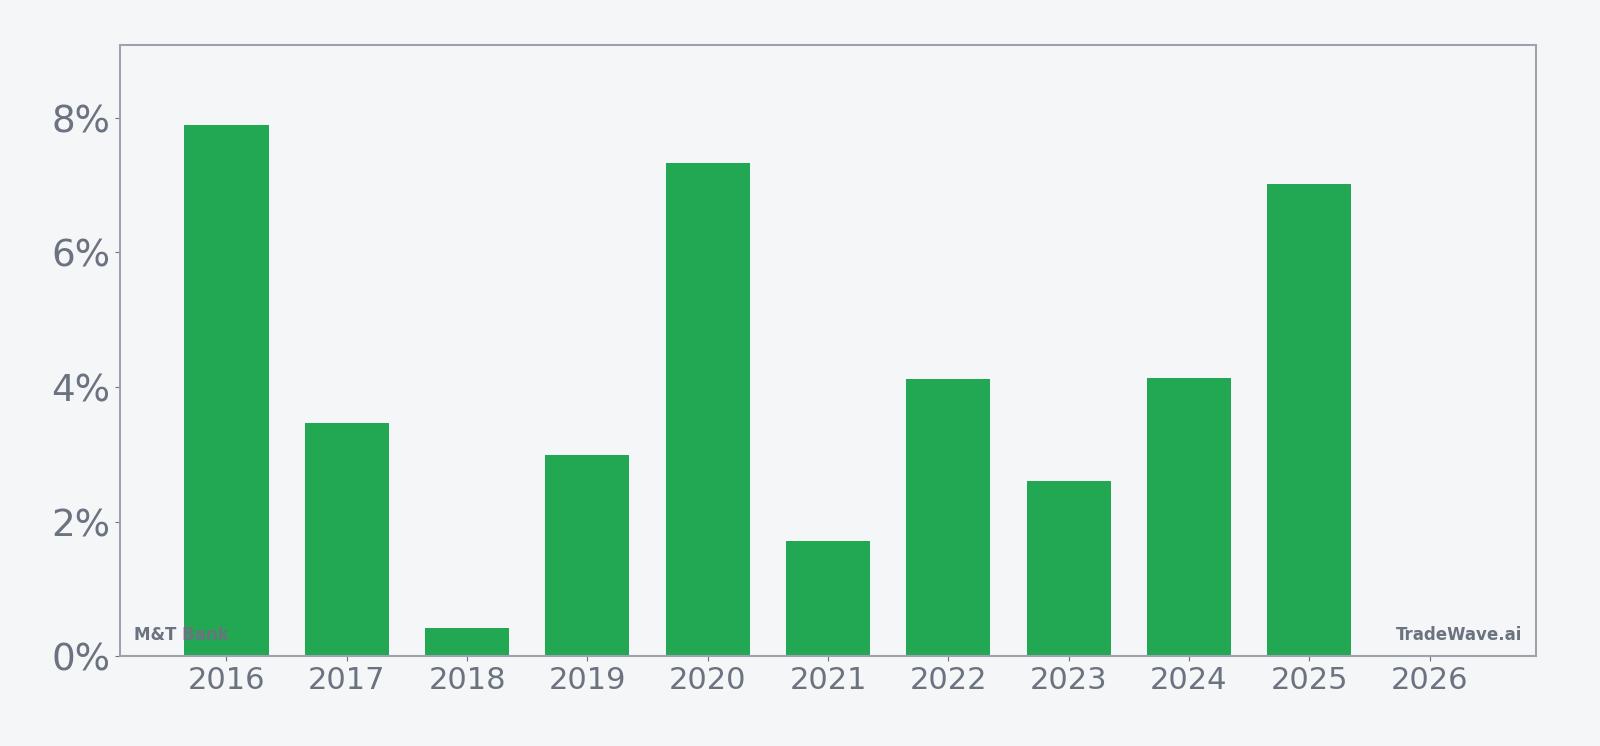
- M&T Bank’s upcoming 21-day window starting Apr. 6 has been positive in every one of the past 10 years.
- The long-only pattern shows 100% Percent Profitable with 10 winners and 0 losers, averaging a 4.17% gain per window.
- The strongest year in the sample was 2016, with a 7.9% net return; the weakest was 2018, which still finished slightly higher.
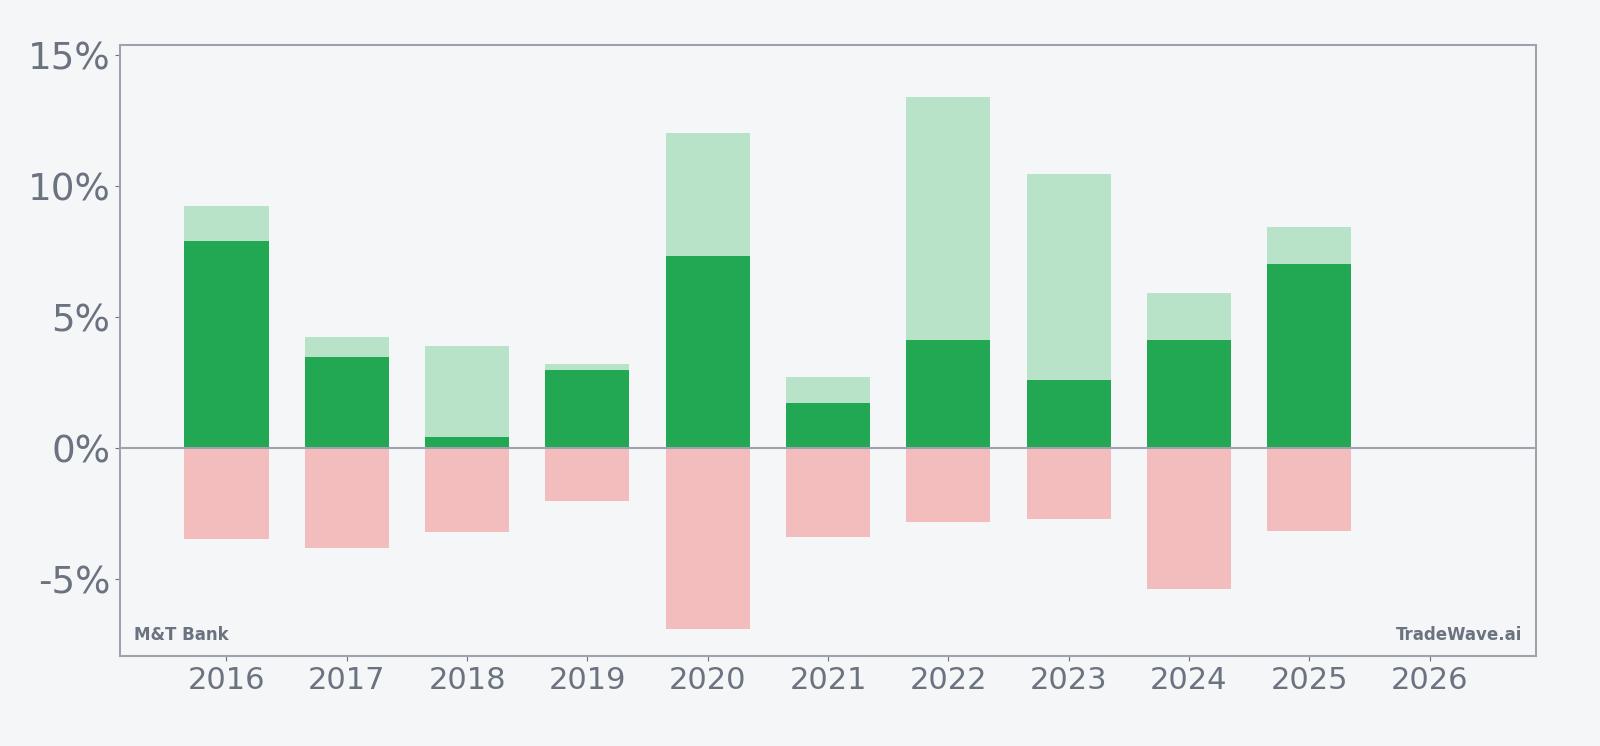
- Intraperiod swings have been meaningful, with some years seeing double-digit peak run-ups and mid-single-digit drawdowns before finishing higher.
- Today’s $200.66 close leaves MTB about 16.1% below its 52-week high, giving the stock room to move if the pattern repeats.
- History points to a bullish seasonal bias, but the drawdown profile means traders still need to respect downside volatility inside the window.
According to historical data from TradeWave.ai, this early-April stretch has behaved very differently from an average month for M&T Bank, and the next iteration is about to open again.
Seasonal window
M&T Bank has risen in 10 of 10 years during the 21-day window that begins on Apr. 6, averaging 4.17% gains. The stock finished Tuesday at $200.66, up 1.27% on the day and about 16.1% below its 52-week high of $239, with the seasonal window set to open in less than two weeks.
Year-by-year net returns and intraperiod swings show how consistently the stock has finished higher while still experiencing meaningful drawdowns along the way.
Across the decade, the pattern has been straightforward: a long bias that has not produced a single losing year. Average gains of 4.17% per window sit on top of a 50% cumulative return, with a median outcome of 3.8%, which suggests the typical year has delivered a mid-single-digit move rather than relying on a few outliers.
The strongest showing came in 2016, when the stock gained 7.9% during the window, helped by a peak run-up of 9.24% from the entry level. At the other end of the spectrum, 2018 barely cleared the bar with a 0.42% net gain, even though the stock still rallied as much as 3.91% at its best point before giving back most of that move by the close.
The intraperiod profile is where the risk shows up. In 2020, for example, M&T Bank’s best point-to-peak move inside the window reached 12.03%, but the worst drawdown from entry was a sizable 6.91% before the stock finished up 7.33%. Several other years, including 2024 and 2016, also saw adverse moves in the 3% to 5% range even though they ultimately closed higher.
The 10-year average seasonal trend line slopes higher through most of the 21 days, with gains tending to build rather than spike on a single session. That suggests the pattern has historically rewarded patience more than quick scalps, with rallies often unfolding over the full three-week stretch instead of front-loading all the upside in the first few days.
Put together, the record is unusually clean for a single-stock seasonal: 10 for 10, mid-single-digit average gains, and a long-only setup that has not yet produced a losing year in this lookback. The trade-off is that the path has rarely been smooth, and the worst years still featured noticeable drawdowns before grinding back to positive territory.
History does not guarantee future results; adverse excursions can be large even in winning windows, and traders should treat the pattern as context rather than a forecast.
Price and near-term drivers
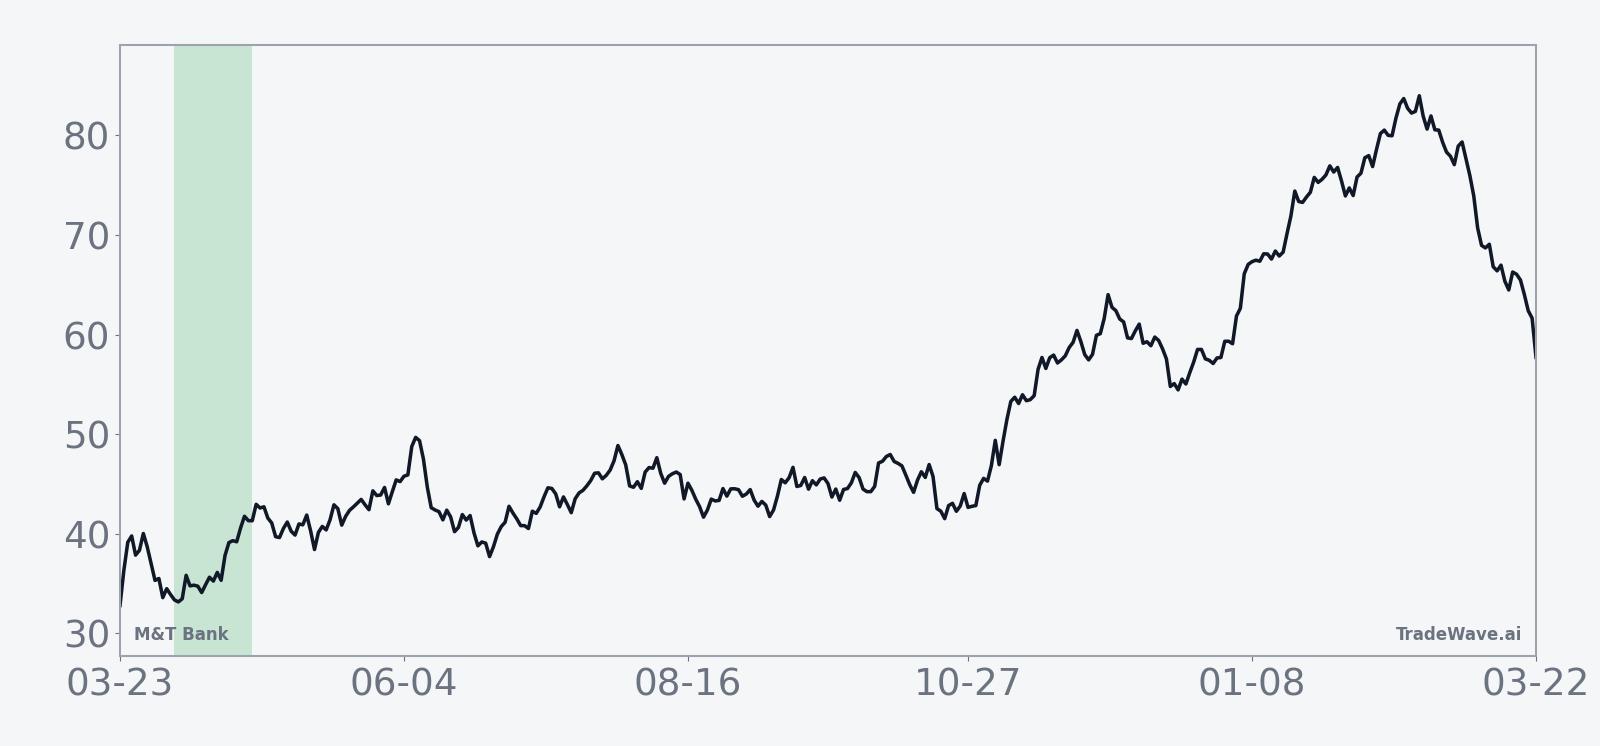
M&T Bank shares closed Tuesday at $200.66, up 1.27% on the session, after trading between $200.52 and $204.44. The stock has pulled back 9.66% over the past month and sits below its 50-day moving average of $217.17, even as 20-day average volume of about 1.26 million shares points to healthy liquidity.
That pullback comes after a strong run over the past year that carried MTB to a 52-week high of $239, leaving the stock about 16.1% off that peak and well above its 52-week low near $144. The current level effectively drops the bank into the middle of its recent range just as the calendar approaches a historically favorable stretch.
Fundamentally, the story has been about earnings power in a still-elevated rate environment. On Jan. 16, 2026, M&T Bank reported that fourth-quarter net income rose to $759 million from $681 million a year earlier, helped by higher net interest income and a wider net interest margin.[1] In the same period, net interest income increased to $1.78 billion, while non-interest income climbed to $696 million, supported by a 32% jump in mortgage banking revenue.[2]
Those results underscored how sensitive the franchise remains to the shape of the yield curve and loan demand. Higher net interest income and stronger fee lines give the bank more flexibility on capital returns and credit provisioning, but they also tie MTB’s outlook closely to the next moves in policy rates and credit quality trends.
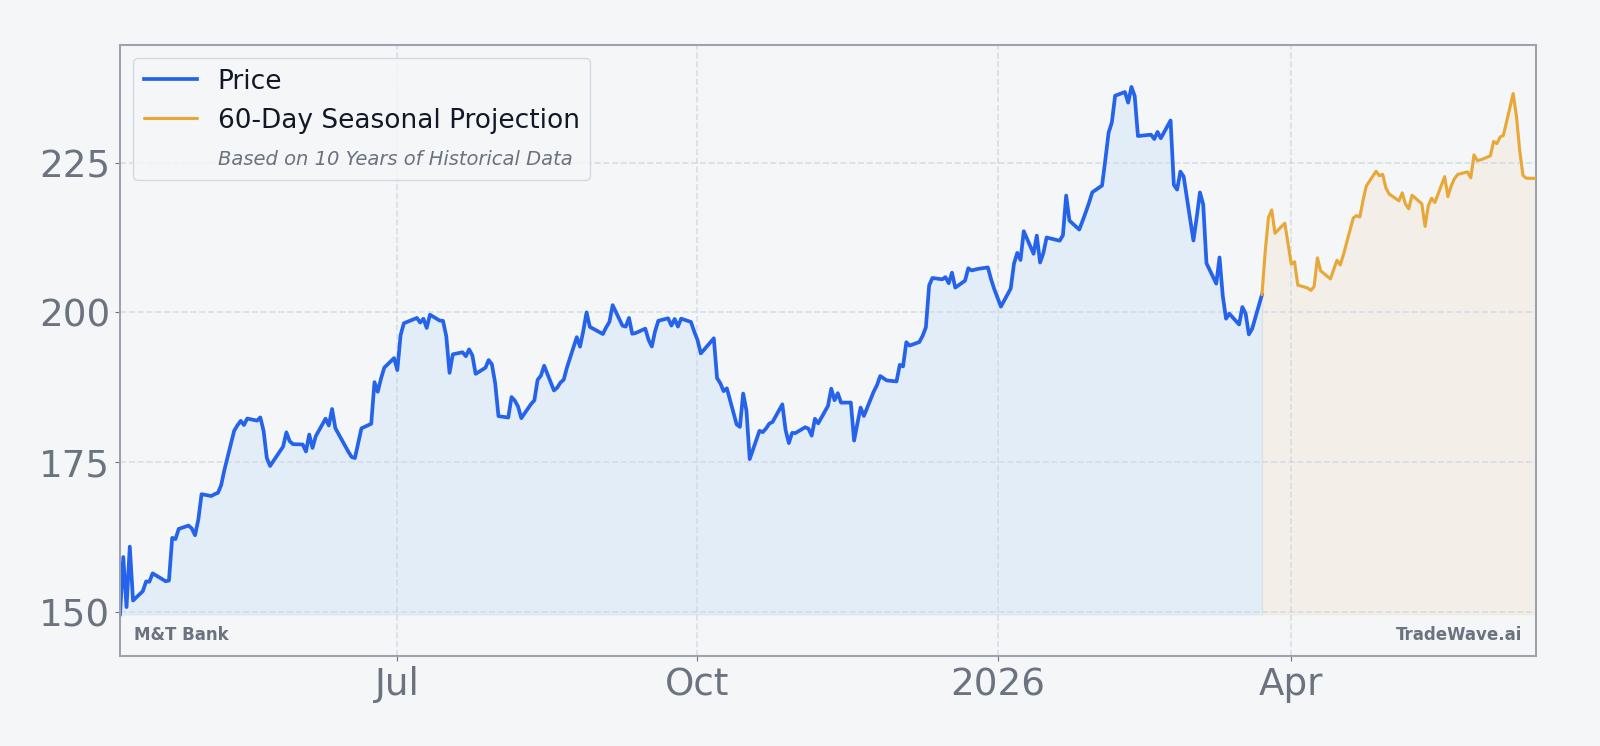
The chart below situates the latest move in its recent multi-month context, alongside a 60-day seasonal projection based on the historical pattern.
What to watch as the window opens
The next key date on the calendar is Apr. 6, when the 21-day seasonal window begins. Traders will be watching whether MTB can stabilize above the $200 area and reclaim its 50-day moving average during the stretch, which would be consistent with the historical pattern of steady gains across the window.
On the fundamental side, any updates on loan growth, deposit pricing, or credit quality from regional-bank peers could feed into expectations for M&T’s next earnings release, even though a specific date has not yet been set. In January, the bank’s stronger net interest and fee income showed how quickly earnings can respond to shifts in rates and housing activity, so fresh macro data on inflation, employment, and mortgage demand will matter for sentiment around the stock.[1][2]
Inside the window itself, behavior around drawdowns will be important. Historically, even winning years have seen adverse moves of 3% to 7% before finishing higher, so a sharp dip early in the period would not automatically contradict the pattern. What would break from history is a sustained failure to recover those losses by the end of the 21 days, or a decisive break below the recent 52-week low zone that shifts the longer-term trend.
For investors and traders who track seasonality, the checklist is straightforward: watch how MTB trades into Apr. 6, monitor whether any early weakness is bought in line with prior years, and see if the stock can convert this historically strong spring window into another mid-single-digit gain. The pattern has been flawless for a decade, but the next three weeks will show whether that streak can survive another cycle.