PG&E Corporation (PCG) Has Fallen in 7 of 8 Midterm Spring Windows as Late-April Slide Nears
PG&E Corporation is nearing a late-April midterm-year stretch that has usually rewarded short sellers, just as AI-driven power demand and tighter profit guidance reshape the utility’s story.
Key takeaways
- From Apr 22 over a 28-day window in the last 8 midterm election years, PG&E Corporation has moved in favor of short positions in 7 of 8 cases, or 88% of the time.
- The average gain for winning short trades in this window is 4.99%, while including all years brings the average outcome to a 4% move in the short direction.
- The pattern is explicitly short: negative returns for the stock have historically been the “good” years for this setup, with only one losing year for shorts.
- Intraperiod swings have been meaningful, with several years showing double-digit adverse moves against the short before ultimately finishing lower.
- Today PG&E trades at $17.34, about 9.5% below its 52-week high and roughly 35% above its 52-week low, leaving room on both sides of the tape as the window approaches.
- Macro tailwinds from AI data center demand and a tighter 2026 profit outlook could collide with this historically weak midterm spring stretch for the stock.[2][3]
According to historical data from TradeWave.ai, this specific late-April window has behaved very differently from an average month on the PG&E calendar, and the next iteration is now less than a month away.
Seasonal window
PG&E Corporation has delivered profitable short setups in 7 of the last 8 midterm election years during the 28 trading days starting Apr 22, with winning shorts averaging 4.99% gains. The stock closed Tuesday at $17.34, about 9.5% below its 52-week high of $19.16 and roughly 35.0% above its 52-week low near $12.85, leaving it mid-range heading into this pattern. That combination of a historically short-friendly window and a stock sitting between its extremes gives traders a clean canvas for how this cycle might play out.
Because this pattern is grouped by presidential election cycle, it only looks at the last 8 midterm election years, not consecutive calendar years. That matters for a regulated utility like PG&E, since midterm years often coincide with shifting policy debates on rates, grid investment and wildfire liability that can temporarily overpower the usual defensive profile of the sector.
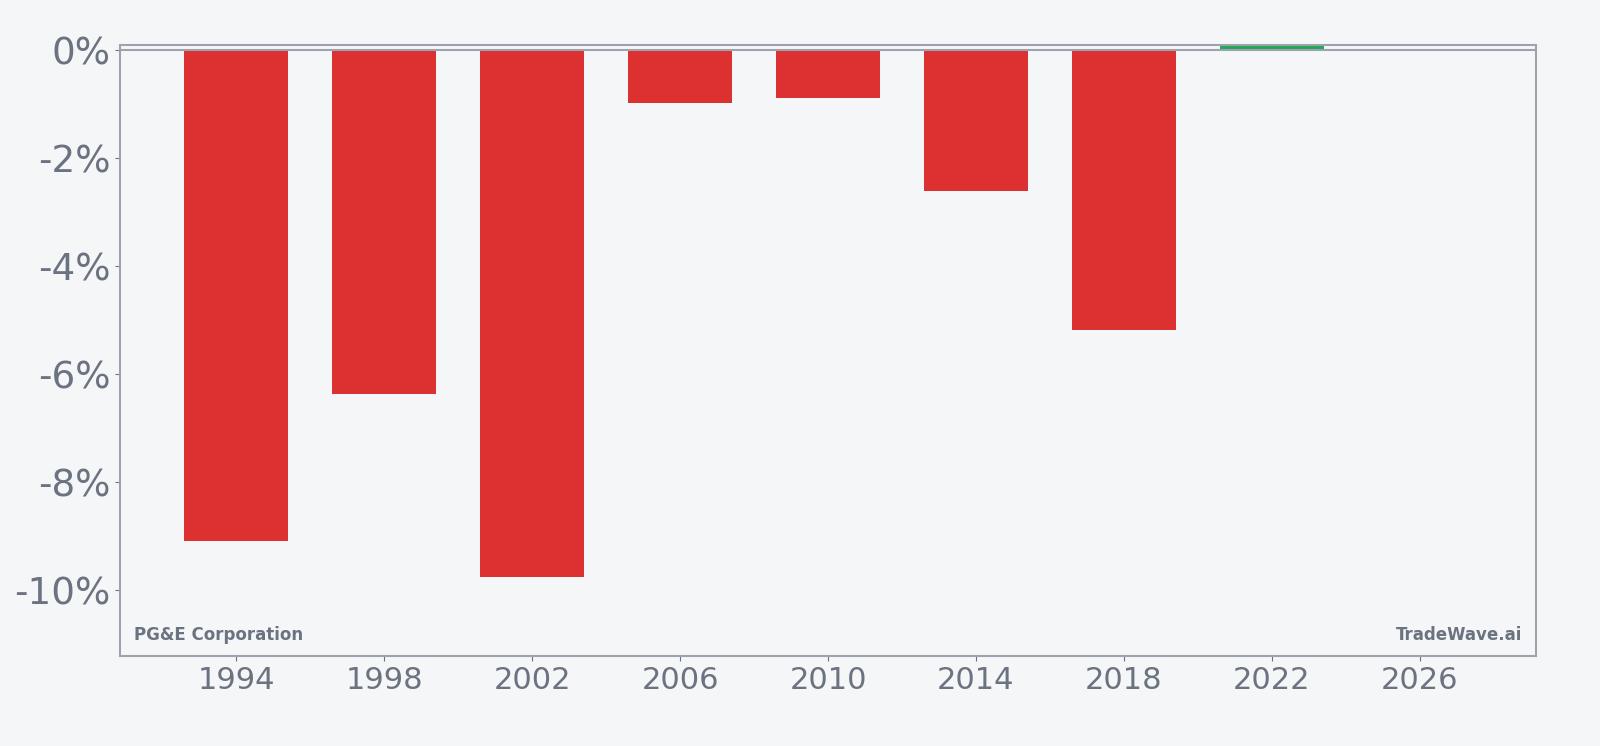
Historically, this 28-day window beginning Apr 22 has been a weak stretch for PG&E’s share price, with the short direction favored in 7 of 8 midterm-year samples and only 1 year where the stock finished higher over the period. The 4.99% average gain in winning short years compares with a 4% average move in the short direction when every year is included, which means the lone losing year did not fully erase the edge from the winners. For a short pattern, that is a solid hit rate combined with a relatively modest give-back in the outlier year.
The per-year breakdown shows how that has played out in practice. In 1994, a short entered at roughly $11.48 would have finished the window with a 9.09% gain as the stock slid to about $10.43, while suffering a maximum adverse move of 18.18% against the position at one point. In 2018, the short finished ahead by 5.18% from an entry near $45.05, but the stock first rallied as much as 7.31% before rolling over, illustrating how squeezes inside the window have often preceded the eventual downside.
MFE/MAE behavior inside the window has been lopsided in several years. The 2010 sample, for example, shows a small 0.9% net gain for the short but a worst intraperiod drawdown of 19.21% against the position, meaning the stock ripped higher before fading back toward flat by the close of the window. On the other side, years like 2002 combined a 9.76% net gain for shorts with an 11.71% worst drawdown, again underscoring that even “good” years for the pattern have not been smooth rides.
The historical seasonal trend chart for this window slopes lower on average, with much of the downside accruing in the middle of the 28-day span rather than at the open or close. That suggests the typical pattern has been a choppy or even slightly higher start, followed by a more decisive drift lower into the back half of the window before stabilizing. For traders, the message is that patience has often mattered more than trying to time the exact first day.
A stacked view of net results alongside best and worst intraperiod swings shows how far PG&E has tended to travel in both directions during this window.
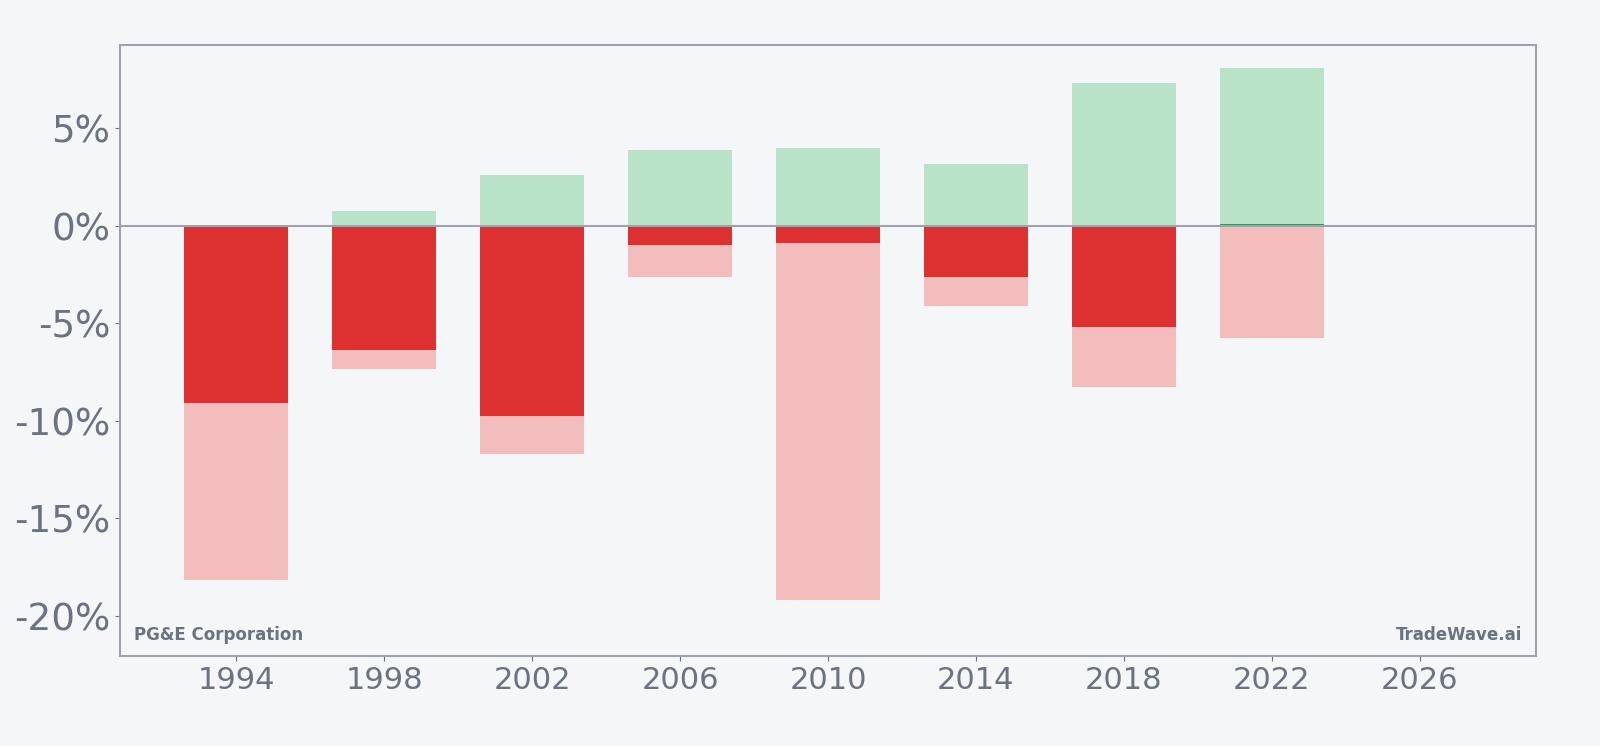
The combined net/MFE/MAE profile shows a window that has usually rewarded shorts by the end of the period but has also featured sizable countertrend rallies along the way. Large adverse excursions in several winning years mean that even when the pattern “worked,” traders had to sit through double-digit moves against them before the stock rolled over. Add it up and the key takeaway is simple: this has been a statistically strong but tactically demanding short window for PG&E.
History does not guarantee future results, and adverse excursions within the window can be large even in years that ultimately finish in the trade direction.
Price and near-term drivers
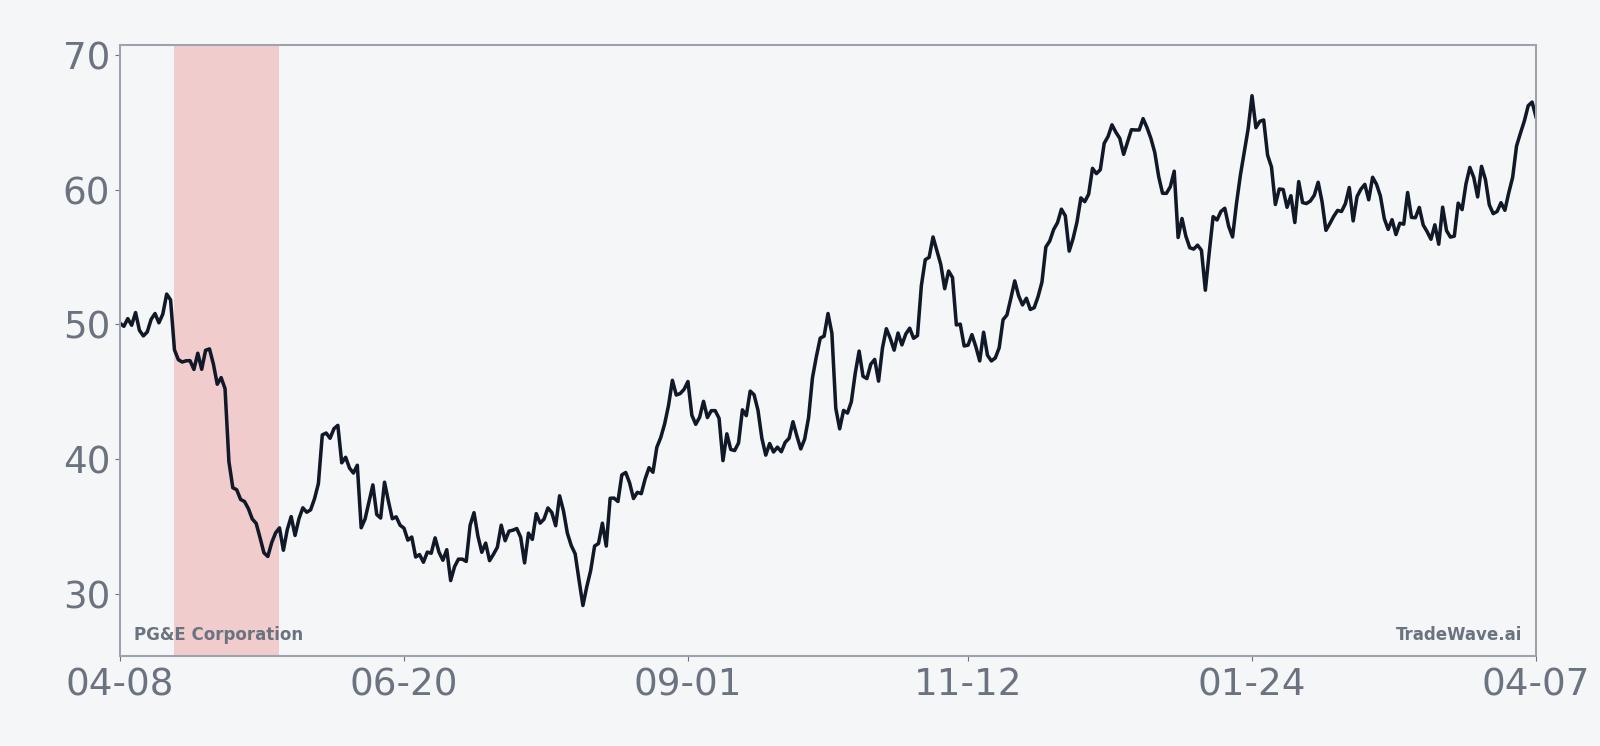
PG&E shares slipped 0.3% Tuesday to $17.34, extending a roughly 7.1% decline over the past month and leaving the stock about 9.5% below its 52-week high and well above its 52-week low. The pullback comes after a strong run into February, when the utility reported slightly lower fourth-quarter profit but tightened its 2026 adjusted earnings forecast on the back of rising power demand from AI-related data centers.[2][3]
On Feb 12, PG&E posted net income of $642 million, or 29 cents per share, down from $647 million, or 30 cents, a year earlier, as it continued to invest in grid hardening and wildfire mitigation.[2] At the same time, management raised the lower end of its 2026 adjusted EPS range to between $1.64 and $1.66, citing strong interest from data center customers and expectations that AI workloads will push electricity demand to record levels in the coming years.[3] That guidance helped reinforce the stock’s longer-term growth narrative even as near-term earnings growth remains incremental.
PG&E also sits inside a broader utility-sector story that is shifting from pure defensiveness toward growth tied to electrification and digital infrastructure. The company has flagged 4.1 gigawatts of new data center project interest on its system, a pipeline that, if realized, would require substantial capital spending and regulatory coordination but could also support rate base growth and earnings power over time.[4] For investors, that means the stock is increasingly tethered to both traditional rate and wildfire headlines and to the boom in AI infrastructure build-out.
The chart below situates the latest move in its recent multi-month context, alongside a 60-day seasonal projection for the upcoming window.
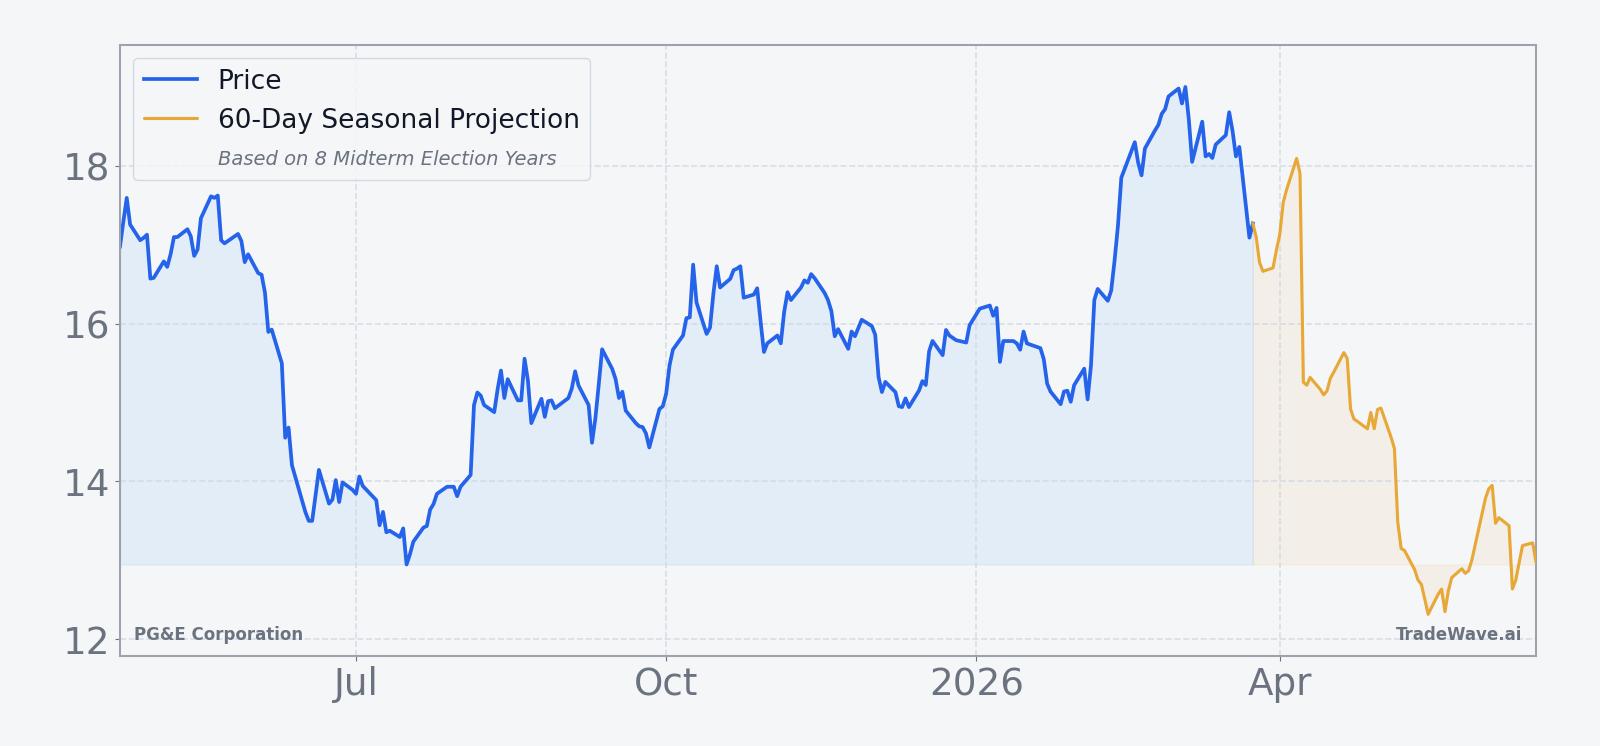
Macro and policy backdrop
The upcoming window also sits inside a distinctive phase of the presidential election cycle. Midterm election years often feature contentious debates over energy policy, infrastructure spending and regulation, which can inject extra volatility into regulated utilities even when their earnings streams look steady. For PG&E, that intersects with California-specific issues around wildfire liability, grid reliability and the pace of permitting for new data center and transmission projects.
At the macro level, AI demand growth is emerging as a key driver for U.S. electricity consumption, with utilities like PG&E positioning to serve hyperscale data centers that require massive, always-on power loads.[3] That backdrop can support multi-year capital plans and earnings visibility, but it also raises questions about how quickly regulators will allow cost recovery and what mix of renewables, storage and traditional generation will be used to meet the load. Those policy choices tend to crystallize around election cycles, which is one reason grouping the seasonal pattern by midterm years rather than simple calendar years can surface different behavior.
What to watch as the window opens
With the late-April window approaching, traders will be watching how PG&E behaves as it moves closer to the $19 area on the upside or back toward the mid-teens on the downside. A rally into the start of the window followed by renewed selling would rhyme with several past midterm years where early squeezes gave way to lower closes. By contrast, a clean break above the 52-week high that holds through the 28-day span would mark a clear departure from the historical short-friendly pattern.
Fundamentally, any updates on data center interconnection queues, wildfire seasons, or regulatory proceedings around rate cases could act as catalysts during the window. Signs that AI-driven load growth is accelerating faster than expected, or that regulators are comfortable with higher capital spending, might support the stock even in a historically weak stretch. On the other hand, negative headlines on grid reliability or cost recovery could reinforce the seasonal tendency toward downside.
For this specific window, the historical playbook is straightforward but not easy: shorts have usually ended up on the right side of the move, but only after enduring sizable intraperiod swings. How PG&E trades between Apr 22 and late May will show whether that midterm-year pattern still has teeth in an era where AI demand is rewriting the utility sector’s growth story.
Sources
- [1] Seeking Alpha, "PG&E jumps 8% in two days after pledging not to issue additional equity," Aug 5, 2025.
- [2] The Wall Street Journal, "PG&E Posts Lower Profit, Tightens Adj EPS View for Year," Feb 12, 2026.
- [3] Reuters, "Utility PG&E tightens 2026 profit forecast on strong power demand," Feb 12, 2026.