UnitedHealth Group (UNH) Has Rallied in 5 of 6 Midterm Windows Since 2002
UnitedHealth Group is approaching a historically strong midterm-election seasonal window even as shares trade far below their 52-week high and investors weigh policy and earnings risks.

Key takeaways
- UnitedHealth Group’s upcoming 146-day window starting Apr 22 has been profitable in 5 of the last 6 midterm election years, a long-biased pattern.
- Winning years in this window have averaged gains of 10.79%, while including the lone losing year brings the all-years average to 9%.
- Today the stock closed at $275.59, about 52.7% below its 52-week high of $582.51, underscoring how far it has fallen into this cycle.
- Historical intraperiod swings have been meaningful, with some years showing double-digit peak run-ups and double-digit drawdowns before the window closed.
- The pattern clusters in midterm election years, when health policy and Medicare funding debates often intensify and can amplify volatility for managed-care stocks.
- Insider buying during the 2025 selloff signaled management confidence in the franchise even as regulatory and cost pressures weighed on the shares.[11]
According to historical data from TradeWave.ai, this midterm-election stretch for UnitedHealth Group has behaved differently from a typical calendar quarter, with a distinct long-side bias that many investors may not have mapped out.
Seasonal window
UnitedHealth Group has risen in 5 of the last 6 midterm election-year windows that begin around Apr 22 and run for 146 trading days, averaging 10.79% gains in the winning years. Today the stock finished at $275.59, about 52.7% below its 52-week high of $582.51, leaving a wide gap between current pricing and the levels that prevailed before the 2025 slide.[4][9]
The pattern groups the last six midterm election years, a phase when Washington often debates Medicare funding, drug pricing and broader healthcare costs more intensely than in quieter parts of the cycle.[1][2] For a systemically important managed-care name like UnitedHealth, those debates can change sentiment quickly, which is one reason a dedicated election-cycle lens can matter more than a simple month-by-month seasonal chart.
Across those six midterm windows since 2002, the long-side setup has been profitable 83% of the time, with 5 winners and 1 loser. The average outcome across all years, including the down year, is a 9% gain, which is close to the winner-only average and suggests that the single losing instance did not fully erase the stronger years.
Avg Profit reflects winners only, while Avg Profit - All includes every year in the sample. In this case, the 10.79% Avg Profit for winning years compares with a 9% Avg Profit - All, a relatively modest gap that points to a pattern where the downside year was contained compared with the upside years.
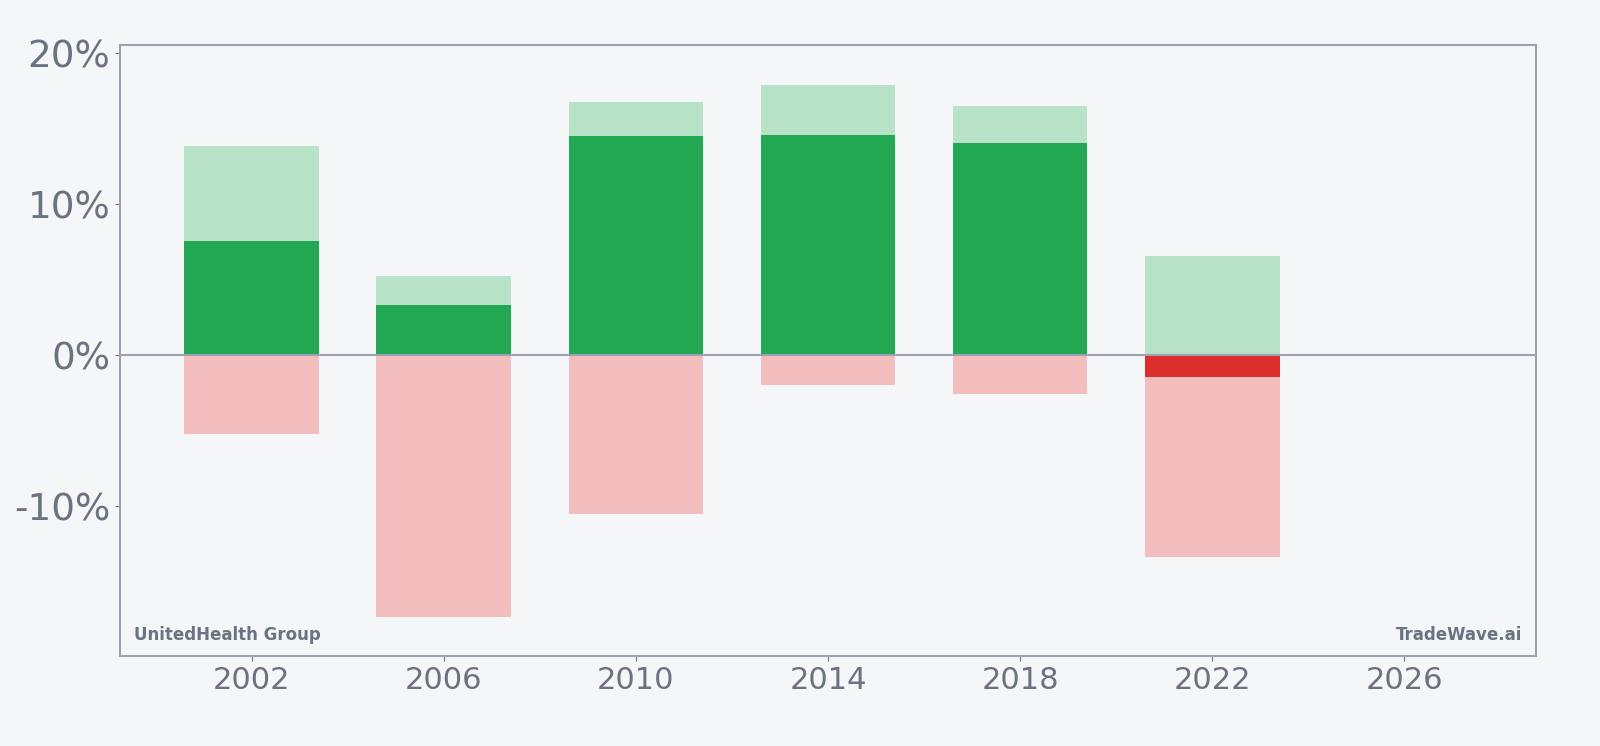
The strongest midterm window in the sample came in 2014, when UnitedHealth gained 14.57% between the late-April start and the end of the 146-day stretch, after a maximum favorable move of 17.86% and only a shallow 1.98% worst drawdown from entry. The weakest outcome was 2022, when the stock finished the window down 1.49% despite a 6.56% peak run-up and a 13.37% worst intraperiod drawdown, a reminder that even a long-biased pattern can deliver a losing year when volatility bites.
Looking across all six years, the best intraperiod rallies, or maximum favorable excursions, have often reached the mid-teens in percentage terms, while the worst intraperiod drawdowns, or maximum adverse excursions, have ranged from low single digits to the mid-teens. In plain English, the window has historically offered meaningful upside potential but has also carried the risk of double-digit pullbacks before the final outcome was known.
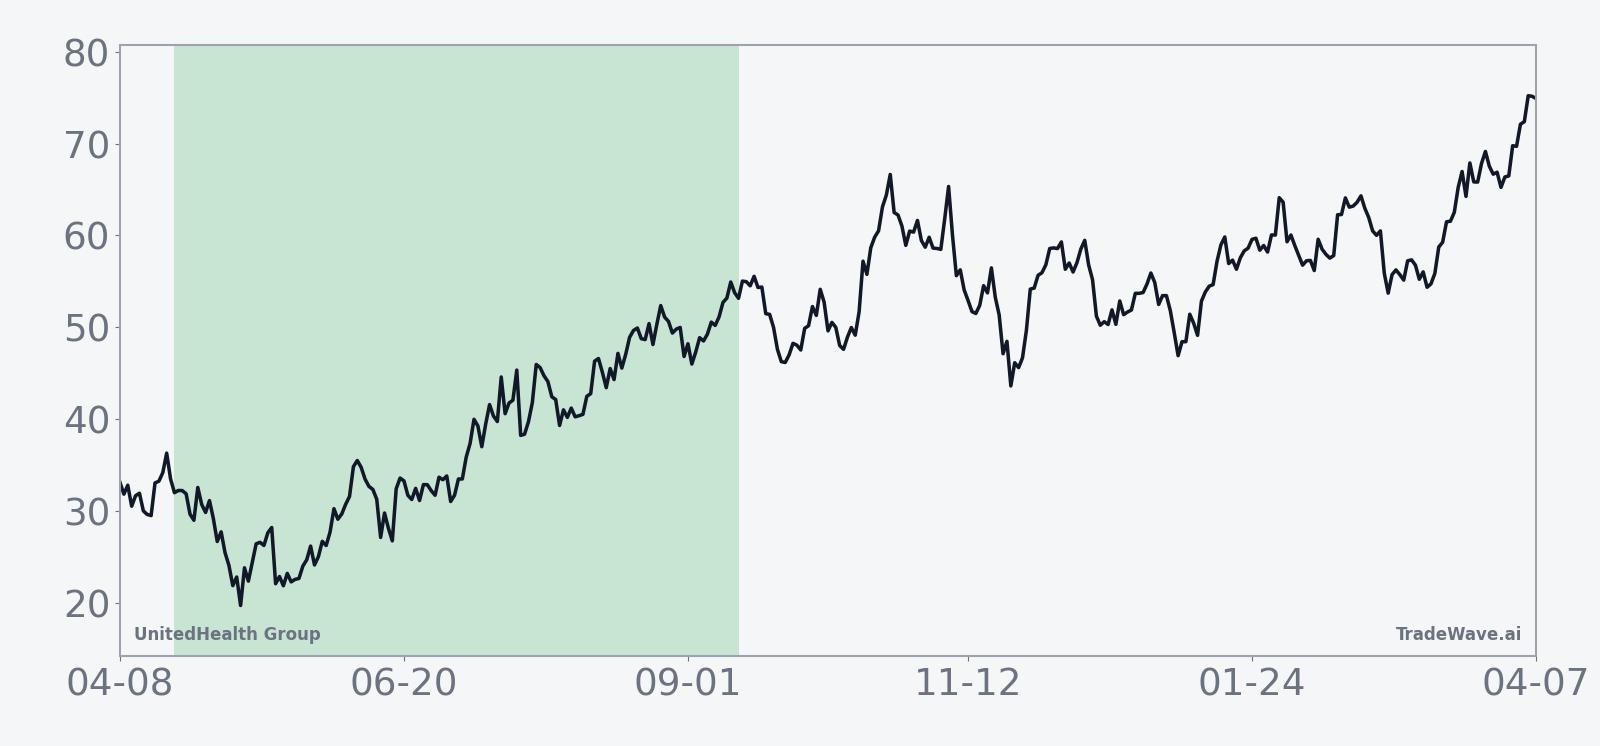
The historical seasonal trend line for this window slopes upward more often than not, with gains tending to build gradually rather than in a single burst. That profile fits a managed-care giant that usually responds to a series of catalysts across earnings, regulatory headlines and macro data rather than one binary event.
On a cumulative basis, the pattern has delivered a 63% total return across the six midterm windows, which annualizes to 8.56% when scaled to a yearly pace. The Sharpe ratio of 1.05, a measure of risk-adjusted average return based on end-of-window outcomes, sits in the “respectable but not extreme” zone for a single-stock seasonal regime.
The TradeWave Ratio (TWR) for this pattern is 2.03, which means the stock has typically traveled a meaningful distance in the trade direction within the window, independent of where it ultimately closed. Combined with the history of double-digit maximum favorable and adverse moves, that suggests a window where both opportunity and risk have been elevated compared with a quiet sideways stretch.
Add it up: five wins out of six, solid average gains and a track record of sizable swings make this midterm-year window one of the more notable long-biased regimes in UnitedHealth’s election-cycle playbook.
History does not guarantee future results, and the worst intraperiod drawdowns in this window have reached double digits even in years that ultimately finished higher.
Year-by-year bars with peak rallies and worst drawdowns show how often the window has delivered upside and how deep the setbacks have run.
Price and near-term drivers
UnitedHealth Group closed Monday at $275.59, down 1.73% on the day and roughly 4.97% lower over the past month, as the stock continues to trade deep in a post-2025 drawdown.[4][9] That level leaves shares about 52.7% below their 52-week high of $582.51, with the 50-day moving average up at $298.51 and 20-day average volume near 9.1 million shares, a setup that keeps the tape sensitive to any shift in sentiment.
In late January 2026, analysts on Seeking Alpha described UnitedHealth’s recovery as likely to take longer, reflecting investor concern about earnings quality, medical cost trends and regulatory overhangs after the stock’s sharp break in 2025.[4][9] The narrative has been that a “double whammy” of higher care utilization and policy risk hit the name at the same time, compressing the multiple even as the underlying business remained large and profitable.
Back in 2025, UnitedHealth reported third-quarter revenues of $113.2 billion, up 12% year over year, and raised its full-year adjusted earnings outlook to at least $16.25 per share, a move that initially helped the stock stabilize.[1][3] Yet the valuation reset that followed earlier in the year, when the stock plunged but screens still showed it as cheap on several models, has left a long tail of investors who bought the dip and are now sitting on losses.[6][7][10]
Regulatory risk remains a key macro driver. In May 2025, Donald Trump’s executive order on drug pricing kept pressure on health insurers, reinforcing the idea that Washington could squeeze margins through reimbursement and pricing changes even if enrollment growth stayed solid.[2] Sector commentary has also focused on rising medical costs and Medicare funding constraints, which feed directly into UnitedHealth’s medical care ratio and earnings visibility.[1]
One notable signal from that 2025 selloff was insider behavior. In May 2025, CNBC reported that some UnitedHealth insiders stepped in to buy shares as they tanked, a vote of confidence in the long-term franchise from people closest to the numbers.[11] That buying did not prevent further volatility, but it added a layer of support to the argument that the stock’s fundamental story had not broken even as the chart did.
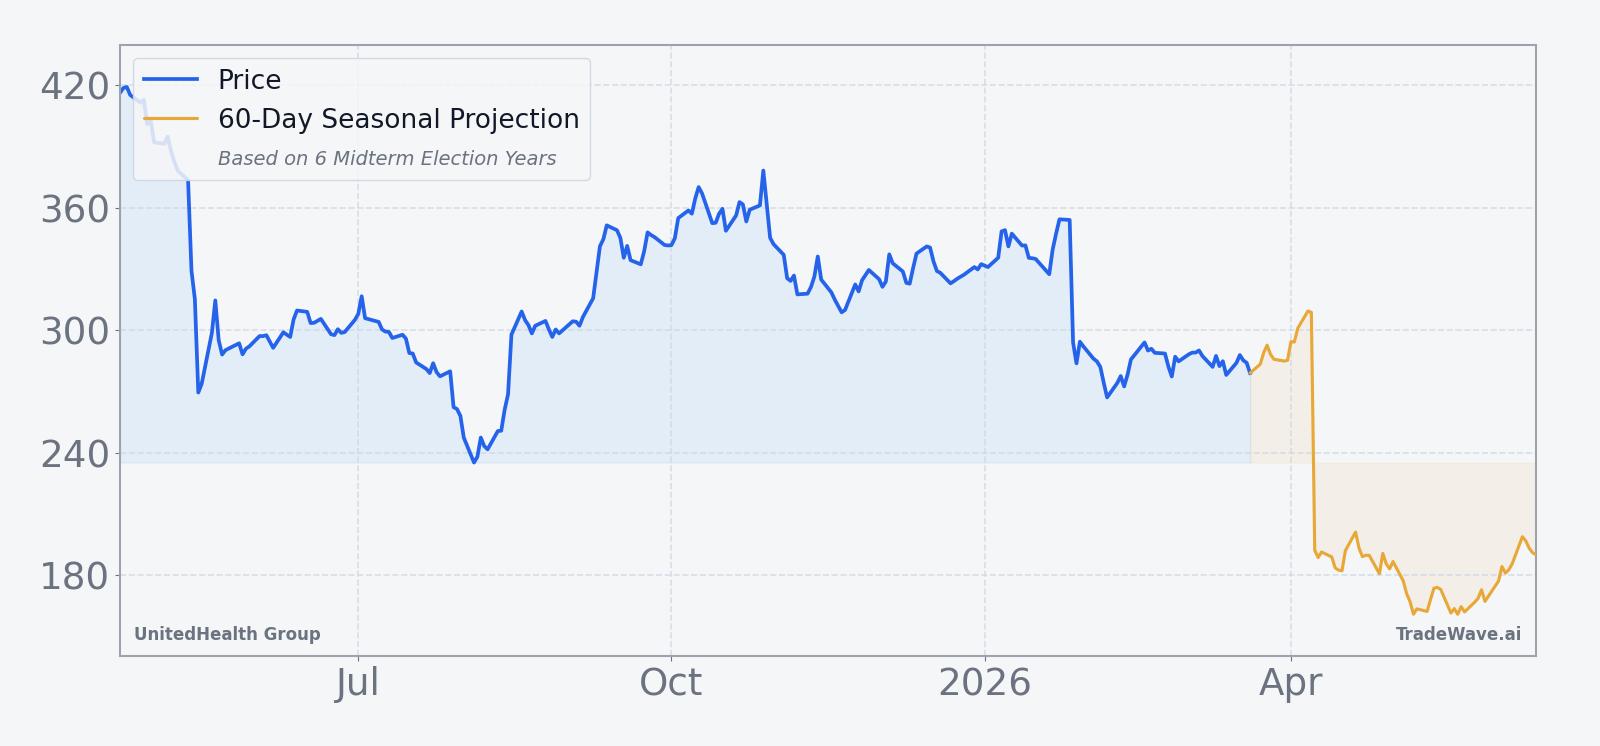
The chart below situates the latest move in its recent multi-month context, alongside a short-term seasonal projection.
What to watch as the window opens
The 146-day midterm-election window for UnitedHealth begins on Apr 22, placing it squarely in a phase when policy debates around Medicare, drug pricing and healthcare costs often intensify.[1][2] Traders will be watching whether the stock can hold above the recent lows and start to close the gap toward the 50-day moving average as the seasonal regime kicks in.
Earnings timing will matter. The company’s next major update after the strong Q3 2025 print will help investors gauge whether elevated medical costs and utilization are stabilizing or still pressuring margins.[1][3][4] A pattern of upside surprises during the window would rhyme with prior winning years, while another guidance reset would look more like the lone losing midterm stretch in 2022.
On the policy side, any fresh headlines that echo the 2025 executive order on drug pricing or signal new pressure on Medicare reimbursement could inject volatility into the window.[2] Historically, the pattern has tolerated noise but not outright shocks, with the worst drawdowns clustering around periods when Washington rhetoric turned into concrete proposals.
Finally, keep an eye on insider and large-holder behavior. If the kind of insider buying seen in May 2025 reappears as the stock trades well below its 52-week high, it would reinforce the idea that management views the current levels as attractive relative to long-term fundamentals.[11] If, instead, insider activity dries up or flips to selling while the seasonal window is historically favorable, that divergence would be a clear signal that this cycle may not follow the usual midterm-year script.
Sources
- [1] Seeking Alpha, "UnitedHealth stock rises on Q3 beats, raised guidance (UNH:NYSE)" (Oct 28, 2025)
- [2] Yahoo Finance, "Donald Trump’s Executive Order Maintains the Pain on UnitedHealth Stock (UNH)" (May 16, 2025)
- [3] UnitedHealth Group, "UnitedHealth Group Reports Third Quarter 2025 Results and Raises Full Year 2025 Earnings Outlook" (Oct 28, 2025)
- [4] Seeking Alpha, "UnitedHealth Group: Recovery Might Take Longer, But Contrarians Know What To Do (NYSE:UNH)" (Jan 27, 2026)
- [5] Seeking Alpha, "UnitedHealth faces critical test as Q2 results loom (UNH:NYSE)" (Jul 28, 2025)
- [6] Forbes, "Buy or Fear UNH Stock At $345?" (Sep 26, 2025)
- [7] Seeking Alpha, "UnitedHealth: Should You Buy This Falling Knife? (NYSE:UNH)" (May 15, 2025)
- [8] Seeking Alpha, "UnitedHealth Group: Double Whammy Disaster (NYSE:UNH)" (Jan 27, 2026)
- [9] Seeking Alpha, "UnitedHealth: Stock Plunges, But Looks Cheap On Valuation Models" (May 16, 2025)
- [10] Seeking Alpha, "UnitedHealth stock rises on Q3 beats, raised guidance (UNH:NYSE)" (Oct 28, 2025)
- [11] CNBC, "Tanking UnitedHealth shares see some insiders step in to buy" (May 16, 2025)