Alcoa (AA) Has Dropped in 7 of 7 Midterm Windows, Averaging 12.92% Short-Side Profits
Alcoa is closing in on a 32-day midterm-election seasonal window that has been consistently bearish, even as the stock trades near its 52-week high after a powerful run tied to stronger aluminum prices.

What is the seasonal pattern for Alcoa (AA)?
Alcoa has fallen in 7 of 7 midterm-election-year windows starting Apr 19 and lasting 32 days, with an average gain of 12.92% in winning years for a short position.
- 7 for 7 in this window for shorts, with Alcoa declining every time across the last seven midterm election years.
- The upcoming 32-day window starts Apr 19, 2026 and has historically been a bearish stretch for the stock.
- Percent Profitable is 100%, with 7 winners and 0 losers for the short-side pattern.
- Average profit for winning short trades is 12.92%, with a cumulative return of 129% across all seven windows.
- Intraperiod swings have been large, with best-case rallies for shorts often paired with deep adverse moves before the decline takes hold.
- The TradeWave Ratio of 1.36 and Sharpe ratio of 1.31 point to a historically strong but volatile short-side seasonal edge.
According to historical data from TradeWave.ai, this specific midterm-election slice of the calendar has behaved very differently from an average spring for Alcoa. The next section walks through how that pattern has played out in prior cycles and what it means as the April 19 window approaches.
How has Alcoa (AA) traded in this midterm-year spring window?
Alcoa has declined in all seven midterm-election-year windows that start around Apr 19 and run for 32 trading days, making this one of its most consistently bearish calendar stretches for short sellers. Shares finished Monday at 66.33, up 4.9% on the day and sitting about 3.0% below their 52-week high of 68.40.[1] That combination of a strong tape and a historically weak midterm window is what makes this year’s setup stand out.
Grouping by the presidential election cycle matters here because this window only looks at the last seven midterm election years, a phase that often brings policy uncertainty, shifting fiscal priorities and choppy trading in cyclical names like metals and mining. The pattern phase is labeled “pe2-7,” which in plain English means the last seven midterm-election iterations of this April–May stretch, not seven consecutive calendar years.
Across those seven midterm years, the short-side seasonal pattern shows an average profit of 12.92% and a cumulative return of 129% for traders positioned with the trend. Percent Profitable is 100%, with 7 winners and 0 losers, which is rare for any single-stock seasonal window of this length. The median profit of 10.45% suggests the gains have not been driven by just one outlier year.
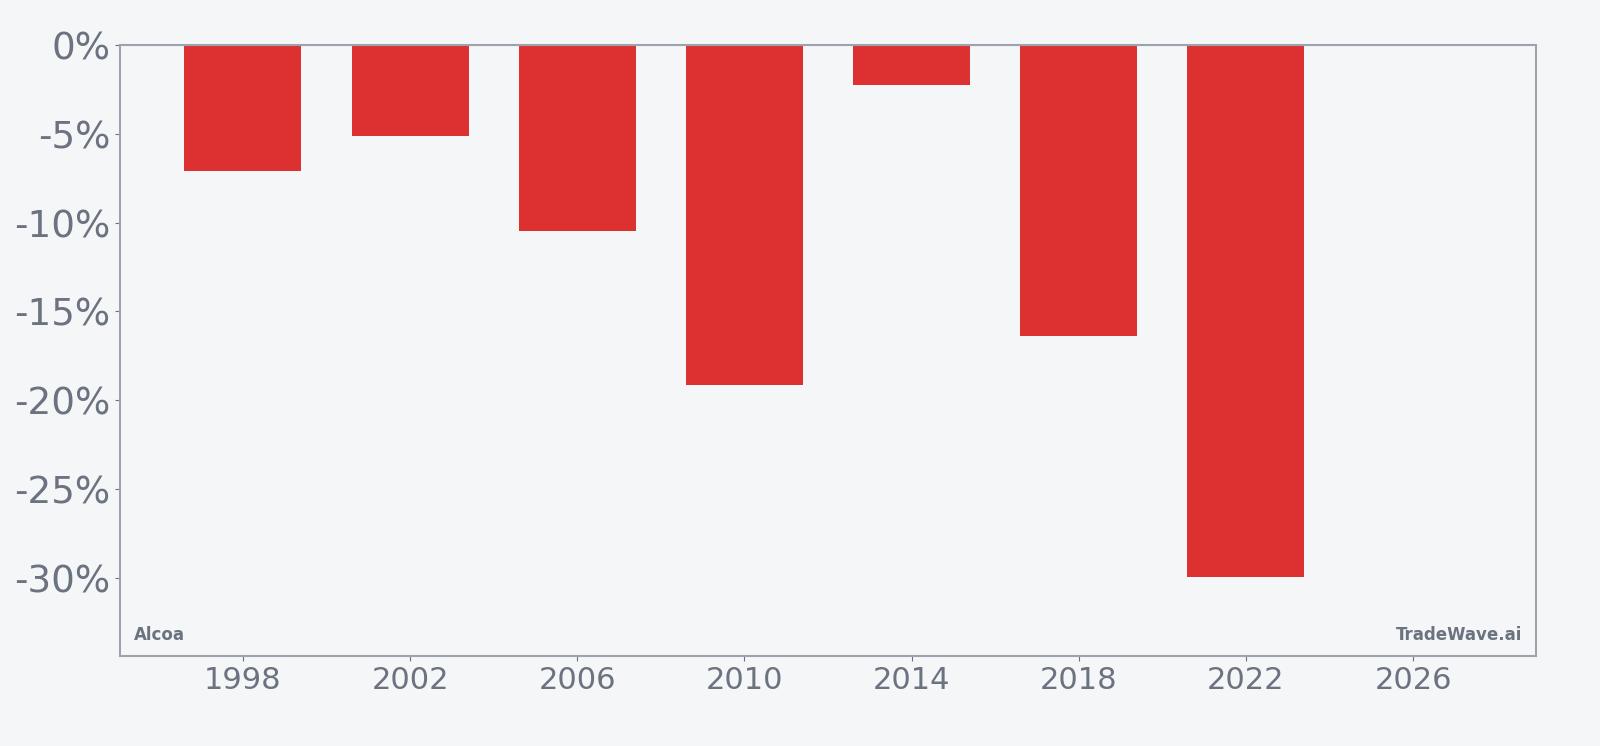
The per-year table shows how consistently the stock has broken lower in this Alcoa trading window. The mildest decline came in 2014, when a short position would have gained 2.29%, while the sharpest drop was in 2022, when the stock fell 29.92% from an entry around 82.97 to an exit near 58.15. In between, years like 2010 and 2018 delivered double-digit percentage declines of 19.11% and 16.37% respectively.
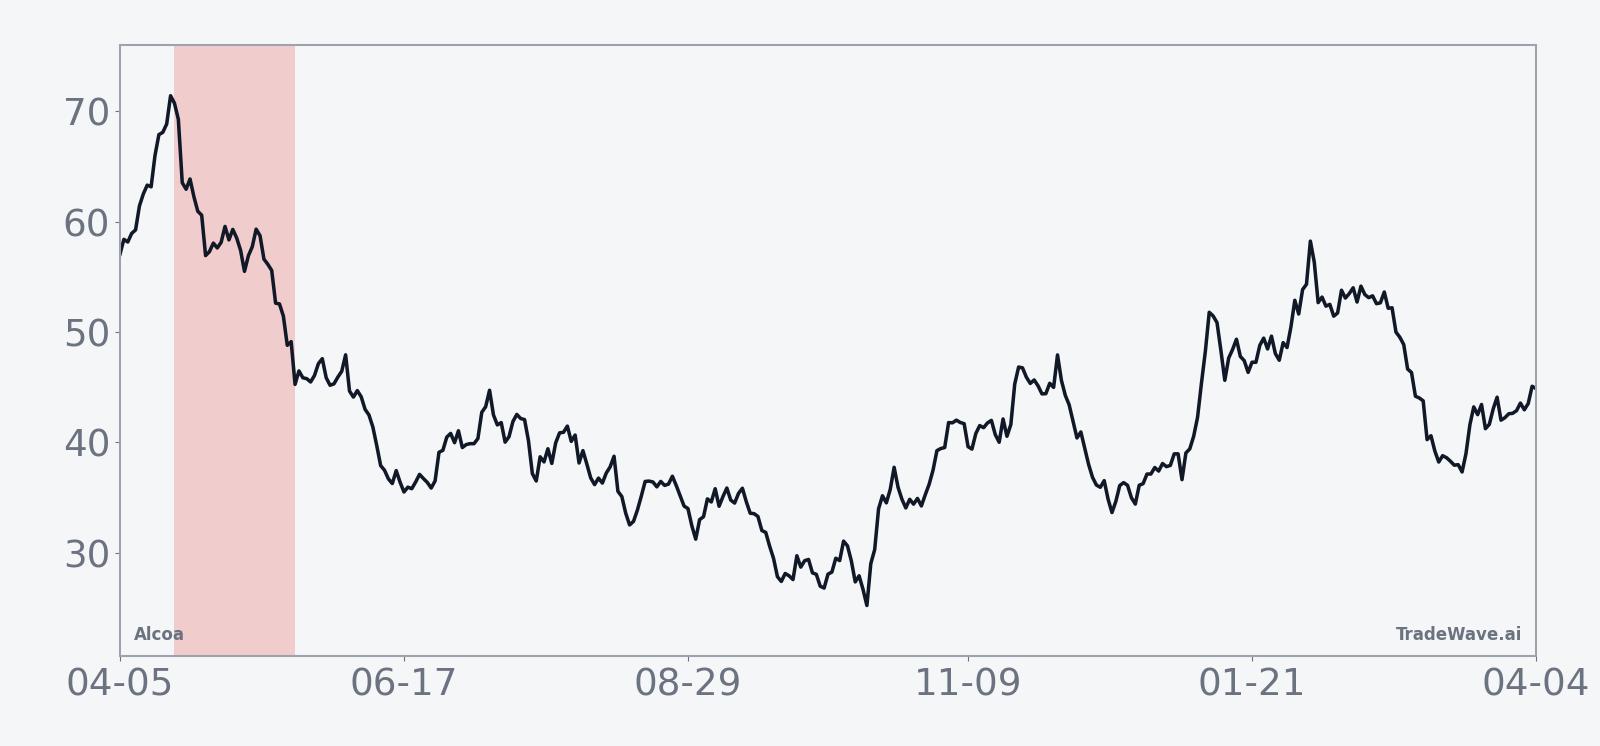
The historical seasonal trend chart shows that, on average, the bulk of the downside for Alcoa in this window has tended to build gradually rather than in a single air pocket. The typical path starts with a modest drift, then accelerates lower into the back half of the 32 days, which aligns with the idea of midterm-year policy jitters weighing on cyclical stocks as the quarter progresses.
A second view that combines net results with best and worst intraperiod swings helps frame how much the stock has moved inside the window before settling at the final close.
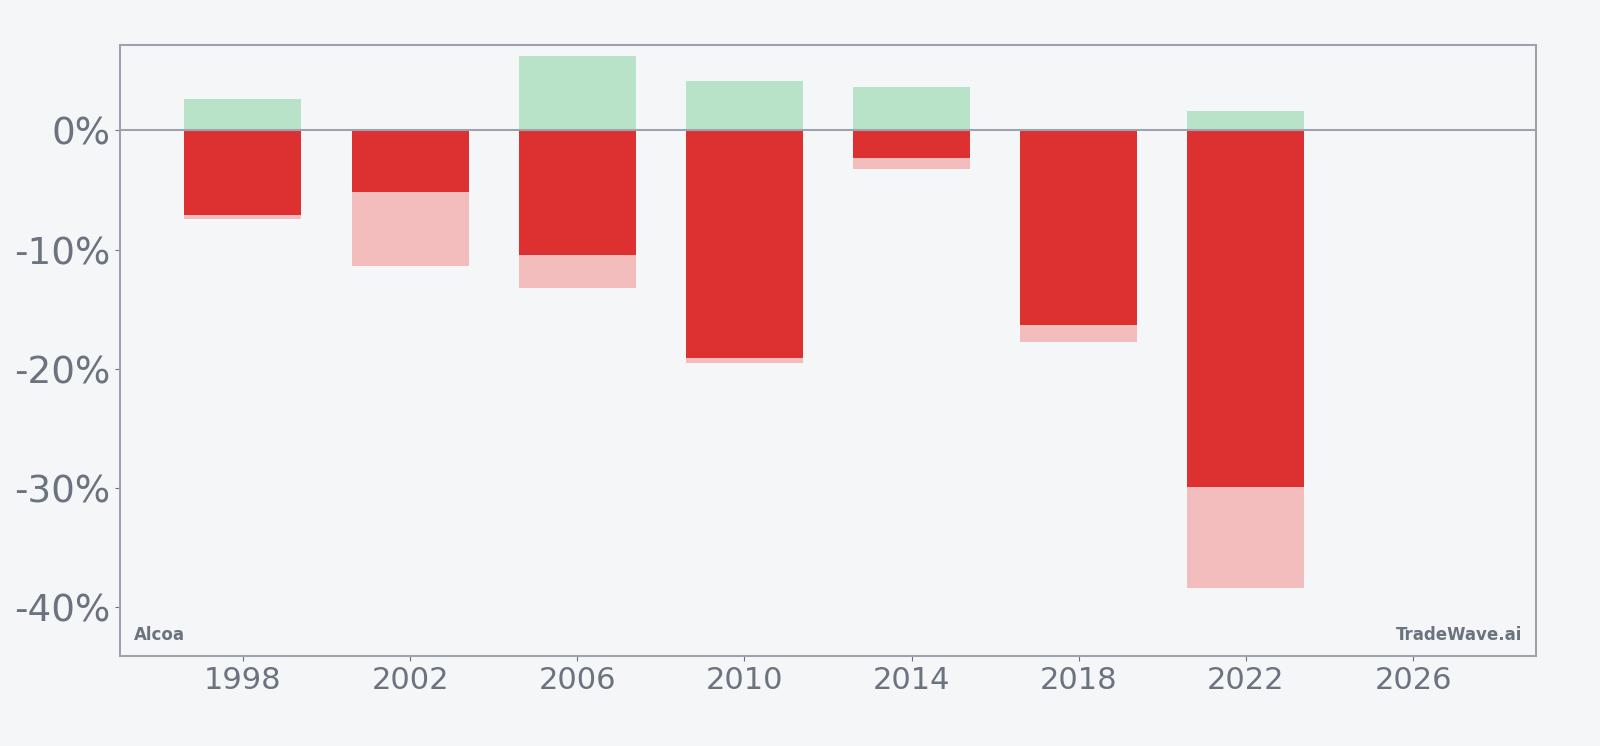
The bars with maximum favorable and adverse excursions show that even in winning years for shorts, Alcoa has often staged sizable countertrend rallies before rolling over. In 2006, for example, the best intraperiod move against the short was a 6.25% rally before the stock ultimately finished the window down 10.45%, while in 2022 the worst drawdown from entry reached 38.39% in favor of the short before the final 29.92% decline. That mix of large maximum favorable moves and meaningful adverse swings is what the TradeWave Ratio of 1.36 and Sharpe ratio of 1.31 are capturing: a historically strong edge, but one that has not been smooth.
History does not guarantee future results; adverse excursions can be large even in winning windows, and traders can face significant drawdowns before any seasonal tendency asserts itself.
Why does Alcoa (AA) follow this seasonal pattern?
This midterm-year April–May pattern for Alcoa may reflect a mix of earnings timing, sector rotation and commodity seasonality. One likely driver is that midterm years often bring heightened policy and tariff debate around trade and industrial spending, which can hit aluminum producers just as investors reassess risk after early-year rallies. At the same time, aluminum demand expectations for construction and autos can soften into late spring, encouraging portfolio managers to trim cyclical exposure and amplifying downside in a stock that has already run hard.
What is driving Alcoa (AA) today?
Alcoa closed at 66.33 on Apr 1, up 3.11 points or 4.9% on the day, with roughly 8.4 million shares changing hands versus a 20-day average volume of about 7.0 million.[1] The stock is trading near the top of its recent range, about 3.0% below its 52-week high of 68.40 and well above its 50-day moving average of 61.62, underscoring how strong the tape has been into this part of the year.[1]
That strength follows a powerful multi-month run that saw Alcoa’s share price roughly double as aluminum demand and company execution improved, according to coverage in January 2026.[5] In late January 2026, the company reported revenues of $3.4 billion and adjusted earnings of $1.25 per share, with higher alumina and aluminum prices helping profitability, and commentary at the time pointed to the potential for further earnings growth if commodity prices and costs cooperated.[1][6] The macro backdrop has been supportive as well, with rising aluminum prices cited as a key tailwind for both revenue and margins.[1]
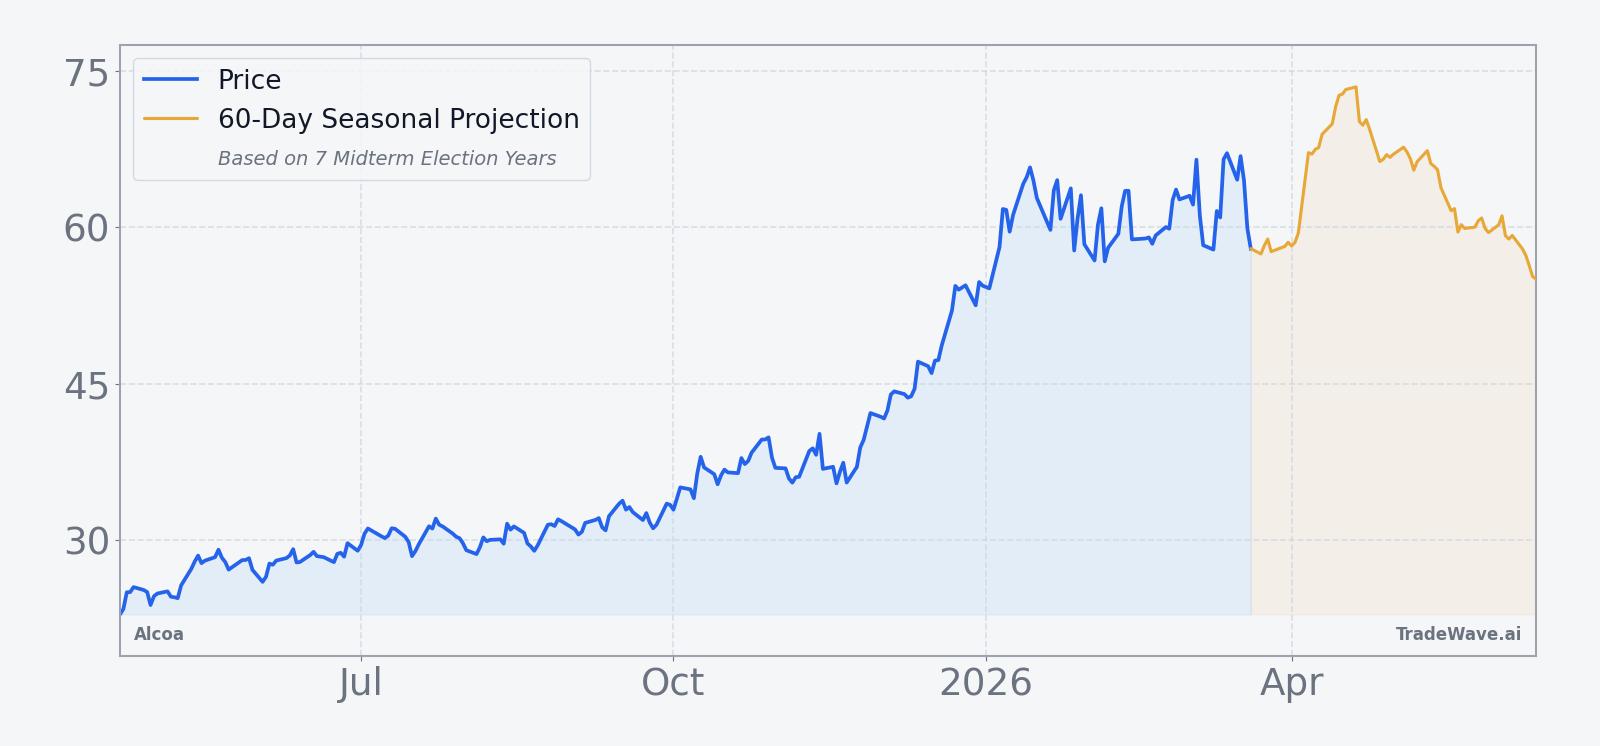
The chart below places that rally and today’s move in the context of the past year, alongside a 60-day seasonal projection.
What should traders watch as this seasonal window approaches?
First, the calendar: the 32-day midterm-year window begins on Apr 19, so price action in the next couple of weeks will set the starting point for any seasonal move. If Alcoa continues to hug or break above its 52-week high into that date, the historical pattern suggests a larger cushion for potential downside, but also more room for volatility if the stock squeezes higher before any pullback.
Second, watch how aluminum prices and macro headlines evolve relative to expectations laid out around the January earnings report.[1][6] The historical seasonality has been bearish in this slice of the midterm year, yet the fundamental story today is one of improved profitability and strong demand, which could blunt or delay any typical pattern. A decisive break back below the 50-day moving average during the window would look more like prior midterm cycles, while a sustained grind higher would mark a clear departure from the last seven iterations.
Third, monitor trading volume and day-to-day ranges as the window opens. Prior midterm-year episodes have featured sizable intraperiod swings, with both sharp rallies and deep drawdowns before the final outcome, so a pickup in realized volatility around Apr 19 would be consistent with the historical Alcoa seasonal trend. Add it up: a stock near its highs, a midterm-election year and a seven-for-seven bearish window on the calendar give traders a concrete set of dates and levels to track, even if this cycle ultimately writes a different script.
Sources
- [1] Forbes, “Inside Alcoa’s Latest Earnings,” Jan 30, 2026.
- [2] Forbes, “Analyzing Alcoa Stock Ahead of Its Earnings Report,” Apr 14, 2025.
- [3] Forbes, “What’s Next After Alcoa’s 40% Surge?,” Nov 16, 2025.
- [4] Forbes, “Where Is Alcoa Stock Headed?,” Oct 1, 2025.
- [5] Forbes, “Why Is Alcoa Stock Up 100%?,” Jan 12, 2026.
- [6] The Wall Street Journal, “Alcoa Posts Higher Profit On Alumina, Aluminum Sales Gains,” Jan 22, 2026.
About this seasonal analysis
Seasonal pattern data is sourced from TradeWave.ai, which analyzes historical price behavior across annual calendar windows going back up to 30 years. Read the full data methodology or the book The 100-Year Pattern by Afshin Moshrefi (2026 edition). Past performance of seasonal patterns does not guarantee future results. This article is for informational purposes only and does not constitute investment advice.