Carnival (CCL) Short Strategy Has Averaged 16.05% Profits Across 9 Midterm Summers
Carnival is approaching a historically weak midterm-year seasonal window even as the stock trades well below its 52-week high, raising the stakes for cruise investors heading into summer.

What is the seasonal pattern for Carnival (CCL)?
Carnival has fallen in 9 of 9 midterm-year summer windows during this 116-day stretch, with an average gain of 16.05% in winning short years.
- 9 for 9 in this window, with short trades averaging 16.05% gains across the last nine midterm election years.
- The upcoming 116-day Carnival trading window starts Apr 30, 2026 and has historically favored downside moves for the stock.
- Percent Profitable is 100%, with 9 winners and 0 losers for the short-side seasonal pattern.
- Average profit in winning years is 16.05%, with a cumulative return of 259% for the short strategy across the sample.
- Historical best and worst intraperiod moves show large swings, with both sharp favorable drops and deep adverse rallies inside the window.
- The pattern is tied to the midterm election year phase, when travel and leisure stocks often trade through policy and macro crosscurrents.
According to historical data from TradeWave.ai, this midterm-year stretch has behaved very differently from an average summer for Carnival. The next section walks through how that election-cycle seasonality has played out in prior years and what it means for the upcoming window.
How has Carnival (CCL) traded in past midterm-year summer windows?
Carnival has fallen in every single midterm-year summer window for the past nine cycles, with short trades averaging 16.05% gains over a 116-day span. The next iteration of that window begins on Apr 30, 2026, with the stock last changing hands at 23.96, about 29.6% below its 52-week high of 34.03 and roughly 59.0% above its 52-week low of 15.07. That combination of a strong historical short-side seasonal trend and a stock already trading well off its highs gives this year’s setup unusual weight for cruise investors.
The pattern is grouped by the presidential election cycle, focusing on the last nine midterm election years rather than consecutive calendar years. That matters because midterm years often bring a distinct policy and liquidity backdrop, with Washington debating budgets and regulation while the Federal Reserve reacts to mid-cycle economic data. For a discretionary name like Carnival, those macro crosscurrents have historically lined up with a soft patch in this late-spring to late-summer window.
Across those nine midterm-year samples, every single iteration of the short strategy finished profitable, which is rare for any stock pattern analysis. The average profit of 16.05% for shorts compares with a median profit of 15.46%, suggesting the distribution of outcomes is not dominated by just one outlier year. Add it up and the cumulative return for the short strategy across all nine windows is 259%, with an annualized return of 15.29% for this specific slice of the calendar.
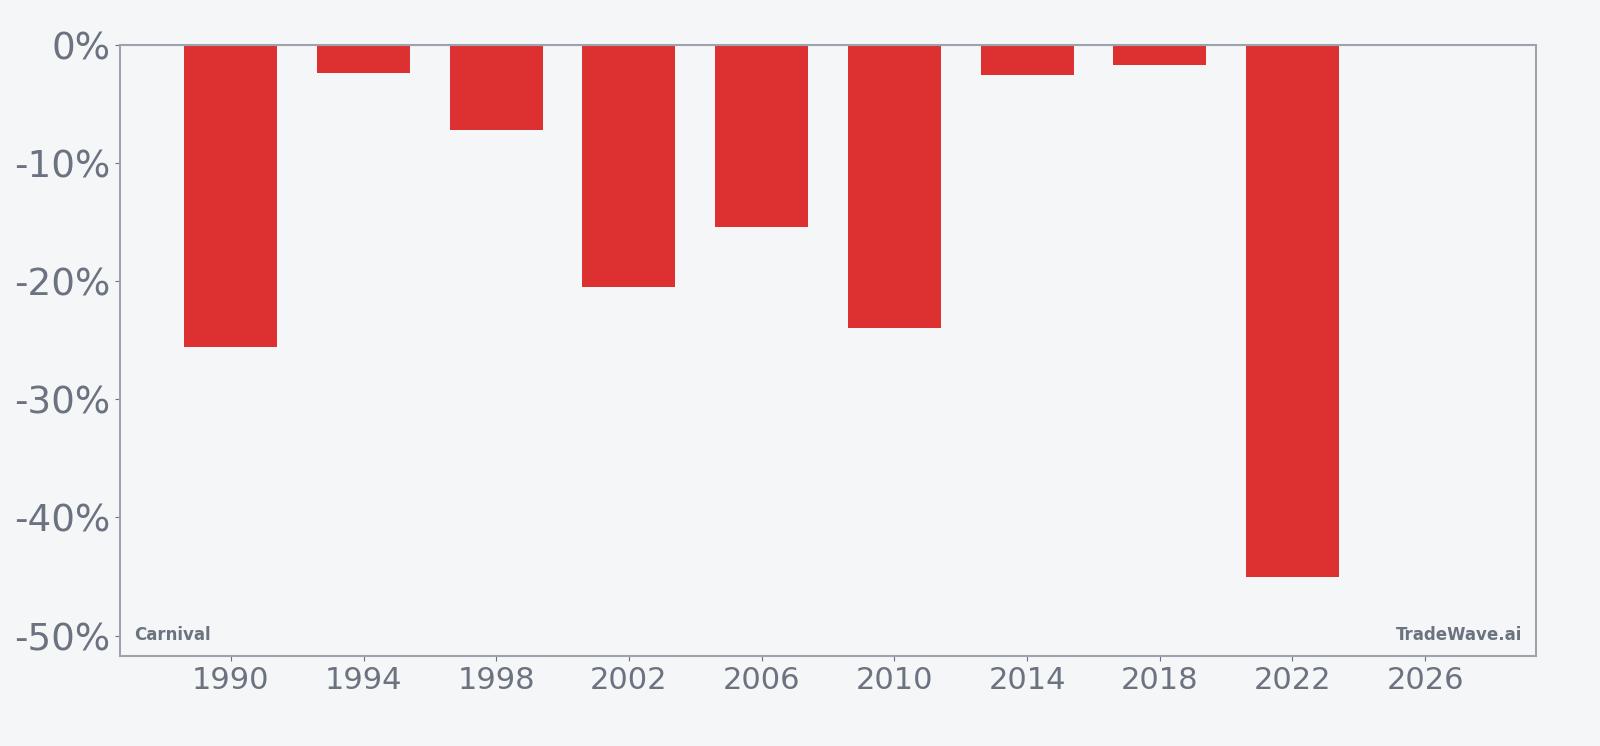
The per-year table shows how that played out in individual cycles. In 2022, a short entered around 17.35 and exited near 9.54, a net return of about 45.01% as the stock slid through the window. In contrast, 1994 and 2018 were mild years for the pattern, with net returns of roughly 2.37% and 1.72% for shorts, respectively, but they still finished in the green. The weakest year for the short side in this sample was 1990, when the stock dropped about 25.56% over the window, again a winning outcome for the trade direction.
The historical seasonal average trend line slopes steadily in favor of the short direction, with most of the gains for bears accruing as the window progresses rather than in a single sharp break. That suggests the typical pattern is a grind lower for the stock across the midterm-year summer, punctuated by occasional rallies that have not, in this sample, been strong enough to flip the final outcome.
The bar chart with maximum favorable and adverse moves by year shows how far Carnival has tended to travel in both directions inside this window.
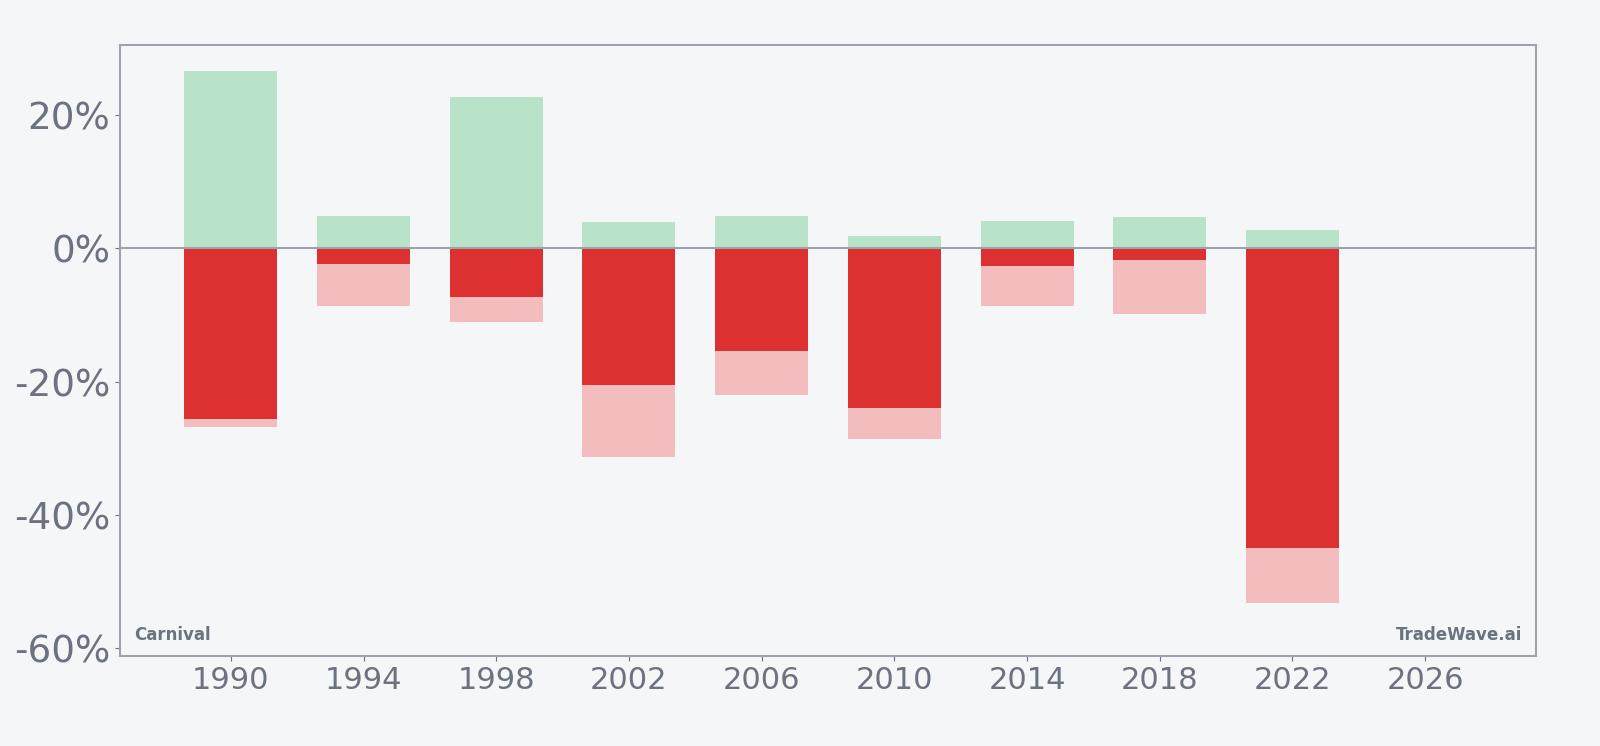
The maximum favorable move for shorts has been large in several years, including 2022, where the best intraperiod drop reached about 53.31% from entry before the window closed. At the same time, maximum adverse moves have also been meaningful, with years like 1990 showing an intraperiod rally of roughly 26.62% against the short before the stock ultimately rolled over. That mix of big MFE and big MAE points to a high-variance Carnival trading window where direction has favored shorts, but the path has often been bumpy.
History does not guarantee future results; adverse excursions can be large even in winning windows, and traders can face significant drawdowns before the seasonal pattern, if it repeats, plays out.
Why does Carnival (CCL) follow this seasonal pattern?
One likely driver is the way cruise demand and pricing line up with the broader travel season and the midterm-year policy calendar. Analysts have pointed to summer as a period when investors reassess travel and leisure earnings power against fuel costs, consumer budgets and any new regulatory headlines, which can pressure stocks like Carnival even if ships remain full.[5] The pattern may also reflect institutional portfolio repositioning around midyear, as funds rebalance exposure to more cyclical names while watching Washington’s budget and tax debates in the midterm election year.
What is driving Carnival (CCL) today?
Carnival shares closed at 23.96 on Mar 31, down 0.95% on the day, extending a one-month slide of 17.78% and leaving the stock about 29.6% below its 52-week high of 34.03. The pullback follows a powerful recovery phase in which the company raised its profit outlook for fiscal 2025 and worked to repair its balance sheet after the pandemic-era shock, a setup that has drawn fresh scrutiny from fundamental analysts.[5]
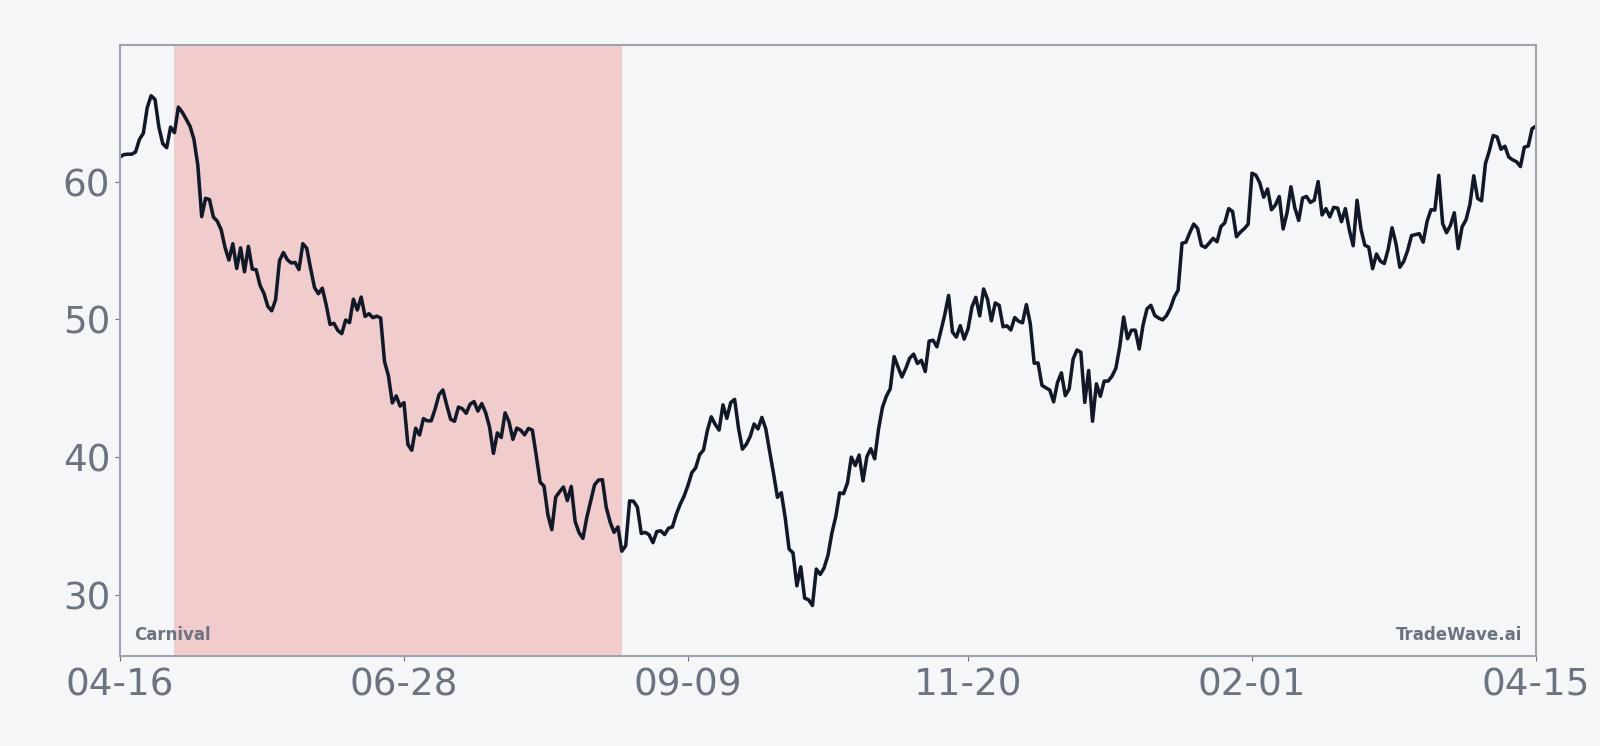
The chart below situates the latest move in its recent multi-month context, alongside a 60-day seasonal projection.
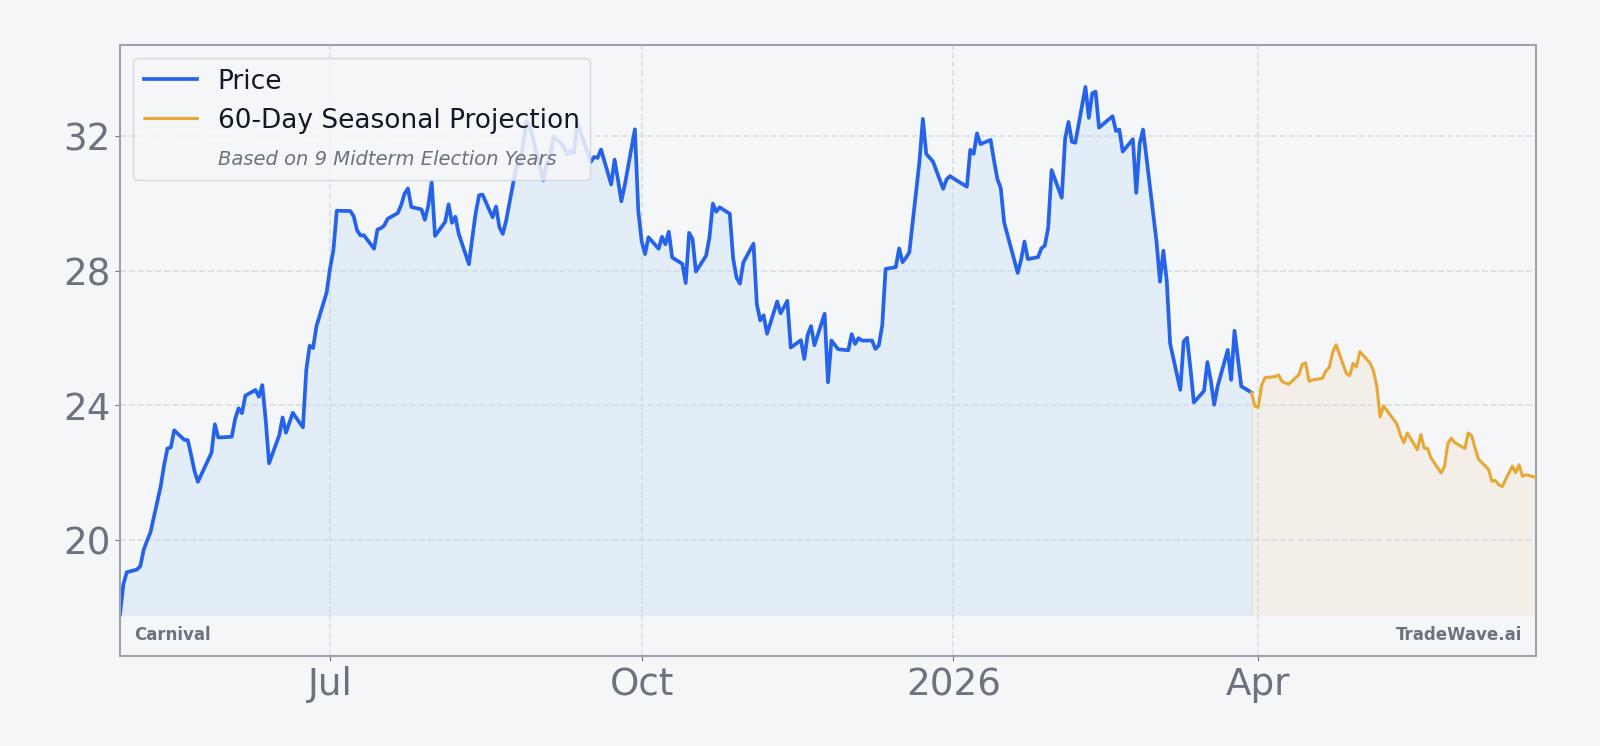
In early March 2026, Forbes highlighted how the stock’s sharp swings have kept valuation debates alive, even after a strong run from pandemic lows.[5] That backdrop leaves Carnival in a middle zone heading into April: no longer distressed, but still carrying leverage and macro sensitivity that can amplify moves when sentiment shifts. For traders, the key question is how that fundamental story will intersect with the historically weak midterm-year seasonal window that opens at the end of next month.
What should traders watch as this Carnival seasonal window approaches?
First, the calendar: the 116-day midterm-year window starts on Apr 30 and runs deep into the summer, so price action in late April will set the entry level that defines both potential downside and intraperiod rally risk. Second, levels: the 50-day moving average near 28.80 has acted as a rough line between the recent uptrend and the current pullback; how Carnival trades around that band into the window will show whether sellers remain in control.[5]
Third, macro and policy catalysts: midyear economic data, fuel prices and any shifts in consumer spending on travel will matter for cruise demand, while midterm-year budget and regulatory debates can influence risk appetite for highly cyclical names. Finally, behavior inside the window itself will be the real test of this historical seasonality. If Carnival again trends lower across the 116-day stretch, with rallies that fade rather than stick, it would reinforce the long-running midterm-year pattern. A sustained break higher through prior resistance during the window, by contrast, would mark the first clear failure for a short-side seasonal trend that has been 9 for 9 so far.
Sources
- Reuters: Carnival raises annual profit forecast on resilient cruise demand, high costs loom (Sep 29, 2025)
- Reuters: Carnival hikes annual profit target on steady cruise demand (Jun 24, 2025)
- Forbes: Buy Or Fear Carnival Stock? (Sep 30, 2025)
- Forbes: Is Carnival Stock A Buy After The Recent 8% Slide? (Mar 3, 2026)
- CNBC: Stocks making the biggest moves midday: ServiceNow, Salesforce, Southwest, Carnival & more (Jan 29, 2026)
- CNBC: Stocks making the biggest moves midday: Lamb Weston, KB Home, Carnival, Oracle, CoreWeave & more (Dec 19, 2025)
About this seasonal analysis
Seasonal pattern data is sourced from TradeWave.ai, which analyzes historical price behavior across annual calendar windows going back up to 30 years. Read the full data methodology or the book The 100-Year Pattern by Afshin Moshrefi (2026 edition). Past performance of seasonal patterns does not guarantee future results. This article is for informational purposes only and does not constitute investment advice.