Analysts See -0.79 EPS for Cleveland-Cliffs (CLF) While a Bearish April Window Pressures Shares
Cleveland-Cliffs is trading higher even as a short-biased April seasonal window has historically produced quick downside moves, creating a tight clash between price action and pattern.

What is the seasonal pattern for Cleveland-Cliffs (CLF)?
Cleveland-Cliffs has fallen in 8 of 9 years during this early-April 13-day window, with an average gain of 6.05% in winning short years.
- 8 for 9 in this window, with short positions averaging 6.05% gains in winning years across the past nine cycles.
- The 13-day Cleveland-Cliffs trading window starts Apr 3 and has historically favored a bearish, short-side seasonal trend.
- Percent Profitable sits at 89%, with 8 winners and just 1 loser for the short setup in this April stretch.
- Avg Profit - All, which includes the lone losing year, is still a solid 5%, underscoring how strong the pattern has been overall.
- Intraperiod swings have been sharp, with some years showing double-digit adverse moves before resolving in favor of the short direction.
- The CLF seasonal pattern clusters much of its move inside this brief window, making timing and risk control critical for traders.
According to historical data from TradeWave.ai, this early-April stretch in Cleveland-Cliffs has behaved very differently from an average month on the calendar, and the current window is already in play.
How has Cleveland-Cliffs (CLF) traded in this early-April window?
Cleveland-Cliffs has delivered profitable short trades in 8 of the past 9 years during this 13-day window starting Apr 3, with winning years averaging 6.05% moves in the short direction. The latest iteration of that window is already underway, with shares closing Monday at $8.40, up 1.6% on the day and sitting about 49.7% below their 52-week high of $16.70.[1] That combination of a historically bearish seasonal pattern and a stock trading deep below last year’s peak gives this April stretch unusual weight for traders watching the steel and mining name.
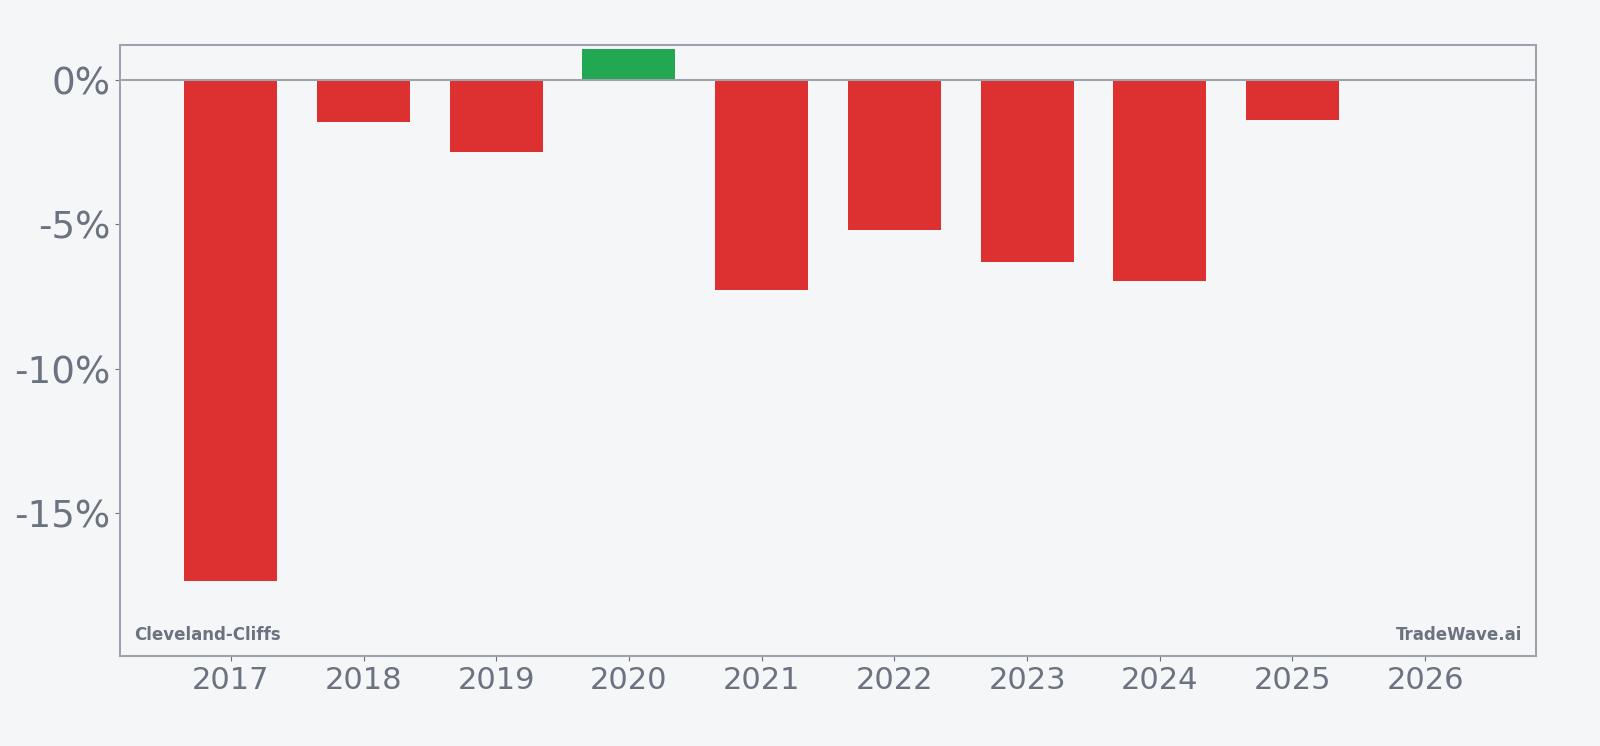
Trade direction for this setup is explicitly short, which means negative returns for the stock have historically been favorable outcomes for the pattern. Across the nine-year lookback, Percent Profitable is 89%, with 8 winning short years and just 1 losing year, and even after including that outlier the all-years average outcome is a 5% gain for the short side. The median result is a 5.21% move in favor of shorts, which lines up closely with the average and suggests the window has not been skewed by a single extreme year.
Average profit in winning years sits at 6.05%, while the average loss in the lone losing year is a relatively modest 1.06%. That gap between Avg Profit and Avg Loss helps explain why Avg Profit - All remains strong at 5% despite the occasional miss. The Sharpe ratio of 0.95, based on end-of-window outcomes, points to a historically attractive risk-adjusted profile for traders who have followed the pattern.
Intraperiod behavior has been anything but quiet. Maximum favorable excursions, or the best point-to-peak moves in the trade direction, have reached as high as 28.72% in 2020, showing how violently CLF can move inside this short window even when the final net result is small. On the flip side, maximum adverse excursions, the worst drawdowns from entry, have stretched to 18.58% in 2017 and 15.25% in 2022, reminding traders that the path to those profitable short outcomes has often involved deep, fast countertrend rallies.
Individual years underline that volatility. In 2017, a short entry around $7.85 ultimately finished with a 17.37% gain for the short side, but only after the stock first rallied roughly 9.29% against the position before rolling over. In 2025, the pattern still produced a small 1.38% win for shorts from an entry near $7.26, yet the stock at one point moved almost 12.95% in favor of the trade and also swung nearly 14.99% against it within the same 13-day span.
The historical seasonal average shows CLF typically softening fairly quickly after the window opens, with much of the net move accruing in the middle of the 13-day stretch rather than at the very start or end. That profile fits a pattern where early attempts to rally often fade, giving way to a more persistent drift lower that benefits short positions.
A stacked view of yearly net returns alongside peak favorable and adverse moves shows how often this window has combined strong short-side potential with sizable drawdowns.
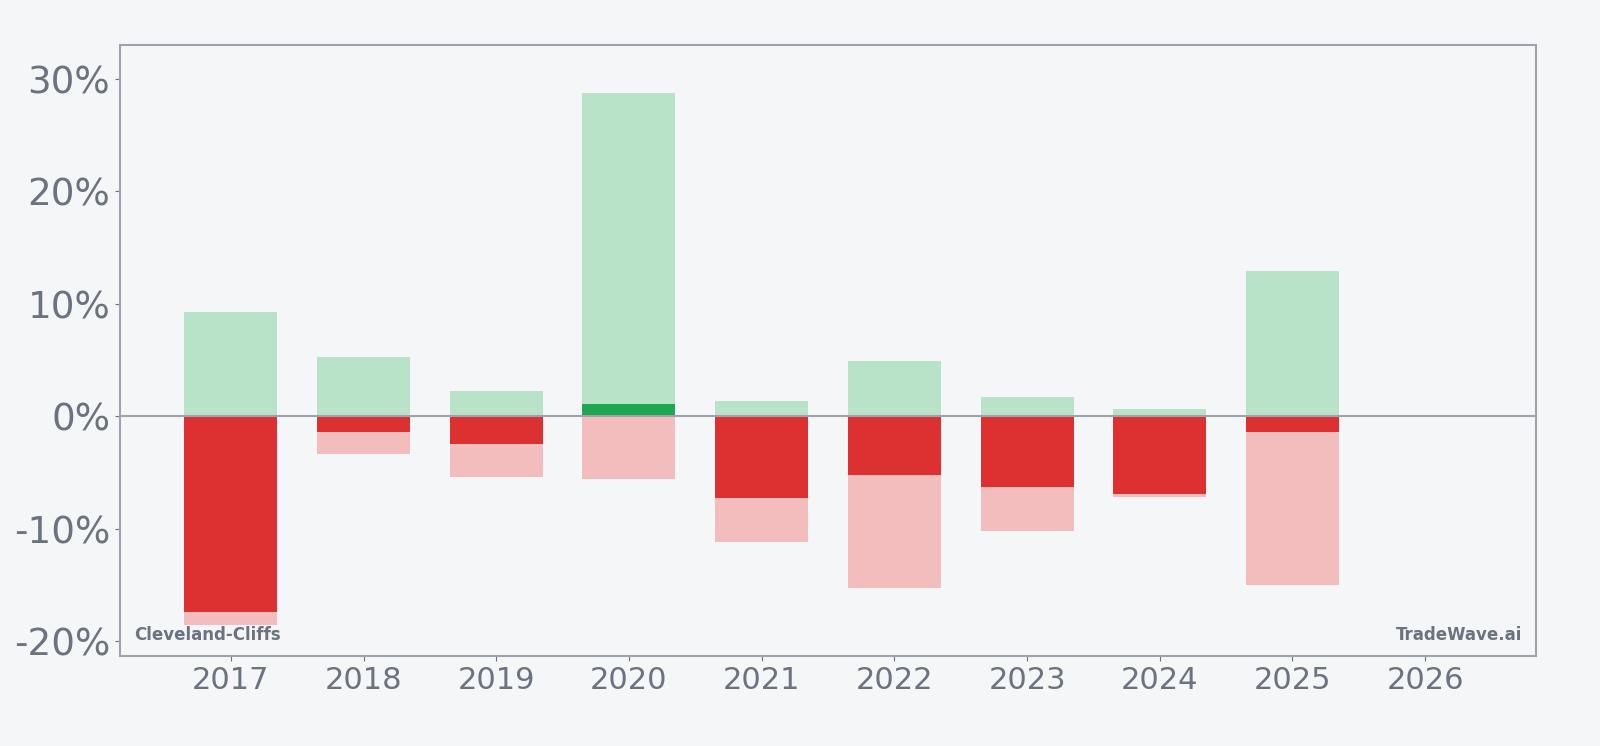
The combined net/MFE/MAE bar chart makes the trade-off clear: in most years, shorts have enjoyed meaningful maximum favorable moves, but those gains have often come with double-digit maximum adverse swings along the way. The pattern is strong, yet it is also high octane, with a TradeWave Ratio of 1.92 indicating that price typically travels far in the trade direction inside the window before it closes.
History does not guarantee future results; adverse excursions can be large even in winning windows, and traders can experience significant drawdowns before any seasonal edge plays out.
Why does Cleveland-Cliffs (CLF) follow this seasonal pattern?
This early-April CLF seasonal pattern may reflect a mix of commodity supply and demand seasonality and institutional portfolio repositioning around the second quarter. Cleveland-Cliffs sits at the intersection of steel demand, auto production and construction, all of which often see order and pricing resets as spring begins. Analysts have also pointed to how earnings expectations and guidance updates around this time can trigger short-term de-risking in cyclical names, which can amplify downside moves when sentiment is already fragile.
What is driving Cleveland-Cliffs (CLF) today?
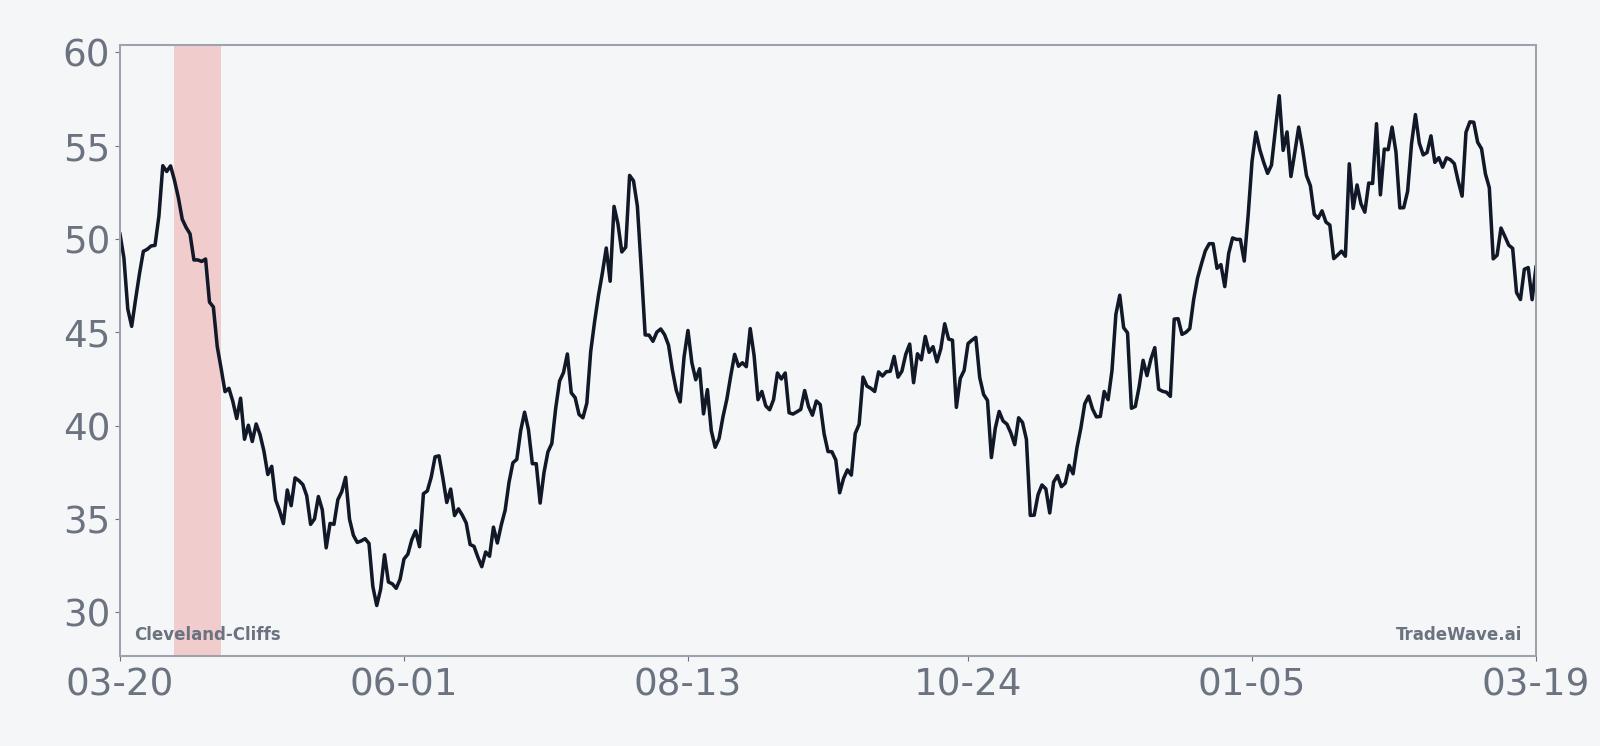
Cleveland-Cliffs shares closed Monday at $8.40, up 1.6% on the session, after trading between $8.05 and $8.64 on volume of about 15.9 million shares.[1] The stock has dropped 21.35% over the past month and now sits roughly 49.7% below its 52-week high of $16.70, though it remains above the 52-week low of $5.63.[1] That slide has pulled CLF well under its 50-day moving average of $10.81 and left it trading on lighter-than-normal volume compared with its 20-day average of about 19.5 million shares, a sign that some of the heaviest selling pressure may have already passed for now.[1]
Fundamentally, the company is still working through a mixed earnings backdrop from 2025. For the first quarter of 2025, reported on May 7, EPS came in at a loss of $0.92 versus expectations for a $0.78 loss, with revenue of $4.63 billion missing the $4.71 billion consensus and management flagging negative return on equity and net margins.[1] By the second quarter of 2025, reported on Jul 21, the picture had improved somewhat, with a narrower EPS loss of $0.50 that beat the $0.68 loss analysts were expecting and revenue of $4.93 billion topping the $4.90 billion consensus and growing 7.5% year over year.[2] Analysts still anticipate a full-year EPS loss of about $0.79 for the current fiscal year, underscoring that CLF remains in a turnaround phase rather than a clean growth story.[1]
On the Street, sentiment has cooled. In late April 2025, B. Riley reiterated a buy rating but cut its price target to $17 from $20, signaling tempered expectations even among bulls.[1] A month later, on May 28, GLJ Research moved in the opposite direction, downgrading Cleveland-Cliffs from strong buy to strong sell with a $3.91 target, a level that sat far below where the stock was trading at the time and reflected a much more pessimistic view of steel pricing and balance-sheet risk.[4] MarketBeat data pegs the current consensus rating at Hold with a consensus price target of $11.09, suggesting a modest upside from today’s price but also highlighting how divided analysts remain on the name.[1]
Positioning has also shifted. In June 2025, MarketBeat reported a significant increase in short interest in Cleveland-Cliffs, with institutional investors owning about 67.68% of the stock and insiders holding roughly 1.76%.[8] Around the same time, EVP James D. Graham sold 120,000 shares at $6.85 on May 23, trimming his stake by 19.60%, a move that added to the perception of insider caution even as some hedge funds and asset managers were adding or adjusting positions.[8]
Flows around the stock have been active. In June, SG Americas Securities disclosed the purchase of 94,001 CLF shares, while other institutional players such as Triumph Capital Management, Drexel Morgan & Co., and Edgestream Partners reported new or increased stakes later in the summer of 2025.[2][3][6][14] At the same time, firms like Entropy Technologies LP and Terril Brothers Inc. were trimming or exiting positions, underscoring how CLF has become a battleground name among professional investors.[5][11]
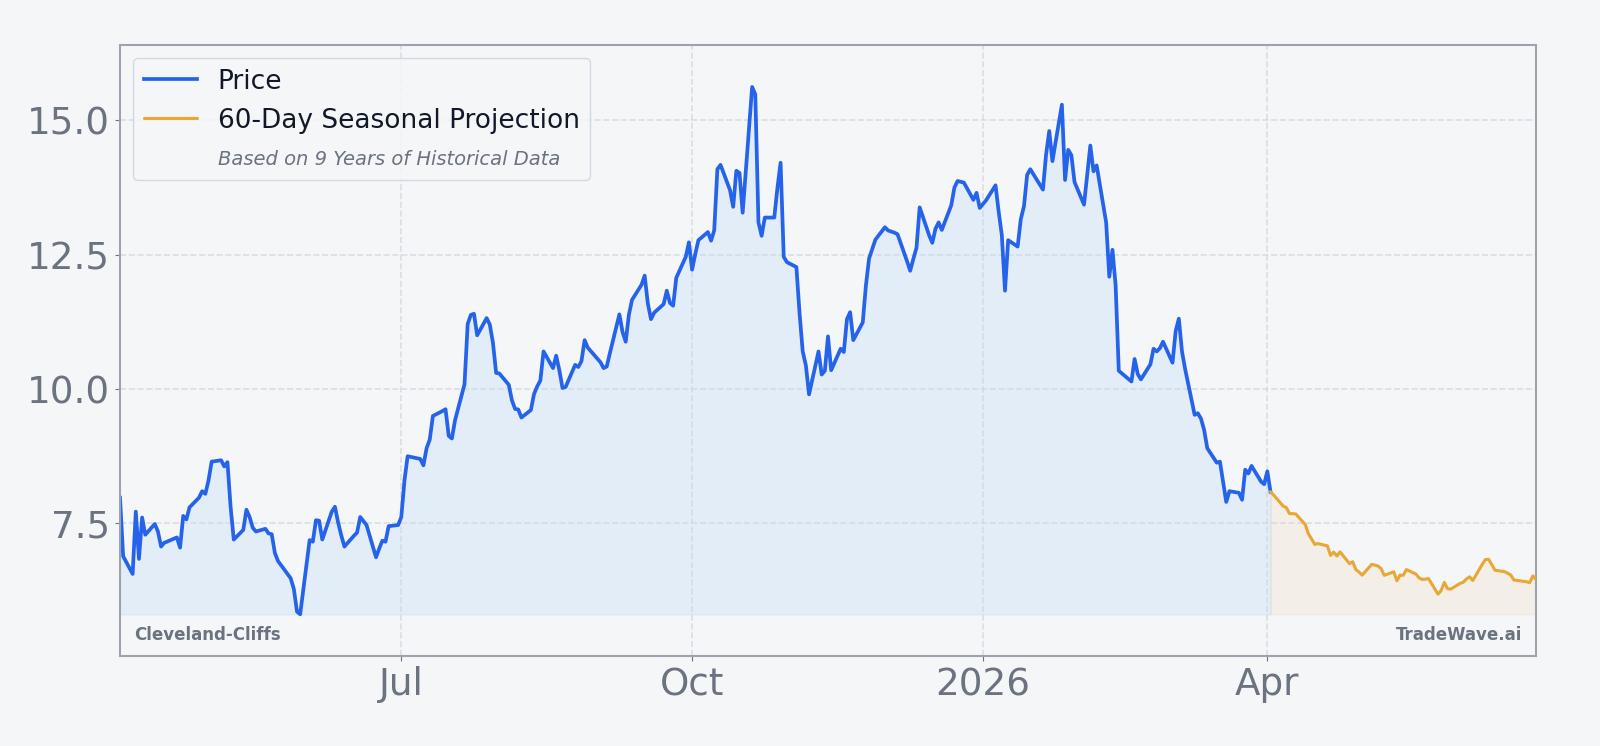
The chart below situates the latest move in its recent multi-month context and overlays the short early-April seasonal projection.
What should traders watch in this Cleveland-Cliffs (CLF) window?
For the next several sessions, the key question is whether CLF respects its historical early-April seasonal pattern or continues to buck it. The stock is already deep below its 52-week high and trading under its 50-day moving average, so any renewed downside that lines up with the 13-day window would fit the nine-year short-side record. A failure to roll over, especially if price reclaims the 50-day average with rising volume, would mark a clear break from the usual CLF seasonal trend.
Traders will also be watching how positioning evolves after last year’s jump in short interest and the insider selling that followed.[8] If short interest builds again into this window while the stock starts to slide, it would echo prior years where bearish positioning and the seasonal pattern moved in the same direction. If, instead, shorts cover into weakness or insiders step back in on the buy side, that would signal a different dynamic than the one that has powered many of the past 8 winning short years.
On the fundamental side, any updates on steel pricing, auto demand or capital spending plans from major customers could quickly change the narrative around CLF’s earnings outlook. With analysts still expecting a full-year loss and the consensus rating stuck at Hold, even modest guidance shifts or macro headlines can have an outsized impact on a stock that has already fallen more than 20% in a month.[1] Add it up: a historically strong short-biased seasonal window, a stock trading far below last year’s highs, and a divided Wall Street make this one of the more consequential two-week stretches on the CLF calendar.
Sources
- MarketBeat: Cleveland-Cliffs (NYSE:CLF) Shares Up 3% - What's Next? (Jun 17, 2025)
- MarketBeat: Triumph Capital Management Makes New Investment in Cleveland-Cliffs Inc. (NYSE:CLF) (Jul 27, 2025)
- MarketBeat: Drexel Morgan & Co. Increases Holdings in Cleveland-Cliffs Inc. (NYSE:CLF) (Aug 2, 2025)
- MarketBeat: GAMMA Investing LLC Has $582,000 Position in Cleveland-Cliffs Inc. (NYSE:CLF) (Jun 19, 2025)
- MarketBeat: Entropy Technologies LP Sells 50,579 Shares of Cleveland-Cliffs Inc. (NYSE:CLF) (Aug 17, 2025)
- MarketBeat: Edgestream Partners L.P. Purchases New Shares in Cleveland-Cliffs Inc. (NYSE:CLF) (Jul 19, 2025)
- MarketBeat: Twelve Points Wealth Management LLC Raises Position in Cleveland-Cliffs Inc. (NYSE:CLF) (Jul 12, 2025)
- MarketBeat: Cleveland-Cliffs Inc. (NYSE:CLF) Sees Significant Increase in Short Interest (Jun 18, 2025)
- MarketBeat: Cleveland-Cliffs (NYSE:CLF) Stock Price Down 1.3% - Here's Why (Jul 12, 2025)
- MarketBeat: Terril Brothers Inc. Sells 604,675 Shares of Cleveland-Cliffs Inc. (NYSE:CLF) (Aug 13, 2025)
- MarketBeat: SG Americas Securities LLC Purchases 94,001 Shares of Cleveland-Cliffs Inc. (NYSE:CLF) (Jun 18, 2025)
About this seasonal analysis
Seasonal pattern data is sourced from TradeWave.ai, which analyzes historical price behavior across annual calendar windows going back up to 30 years. Read the full data methodology or the book The 100-Year Pattern by Afshin Moshrefi (2026 edition). Past performance of seasonal patterns does not guarantee future results. This article is for informational purposes only and does not constitute investment advice.