Goldman Sachs (GS) Has Dropped in 5 of 6 Midterm Windows Starting Apr. 21
Goldman Sachs is up more than 50% this year, but an approaching 12-day midterm-election seasonal window has usually seen the stock slip, creating a tactical test for the rally.

What is the seasonal pattern for Goldman Sachs (GS)?
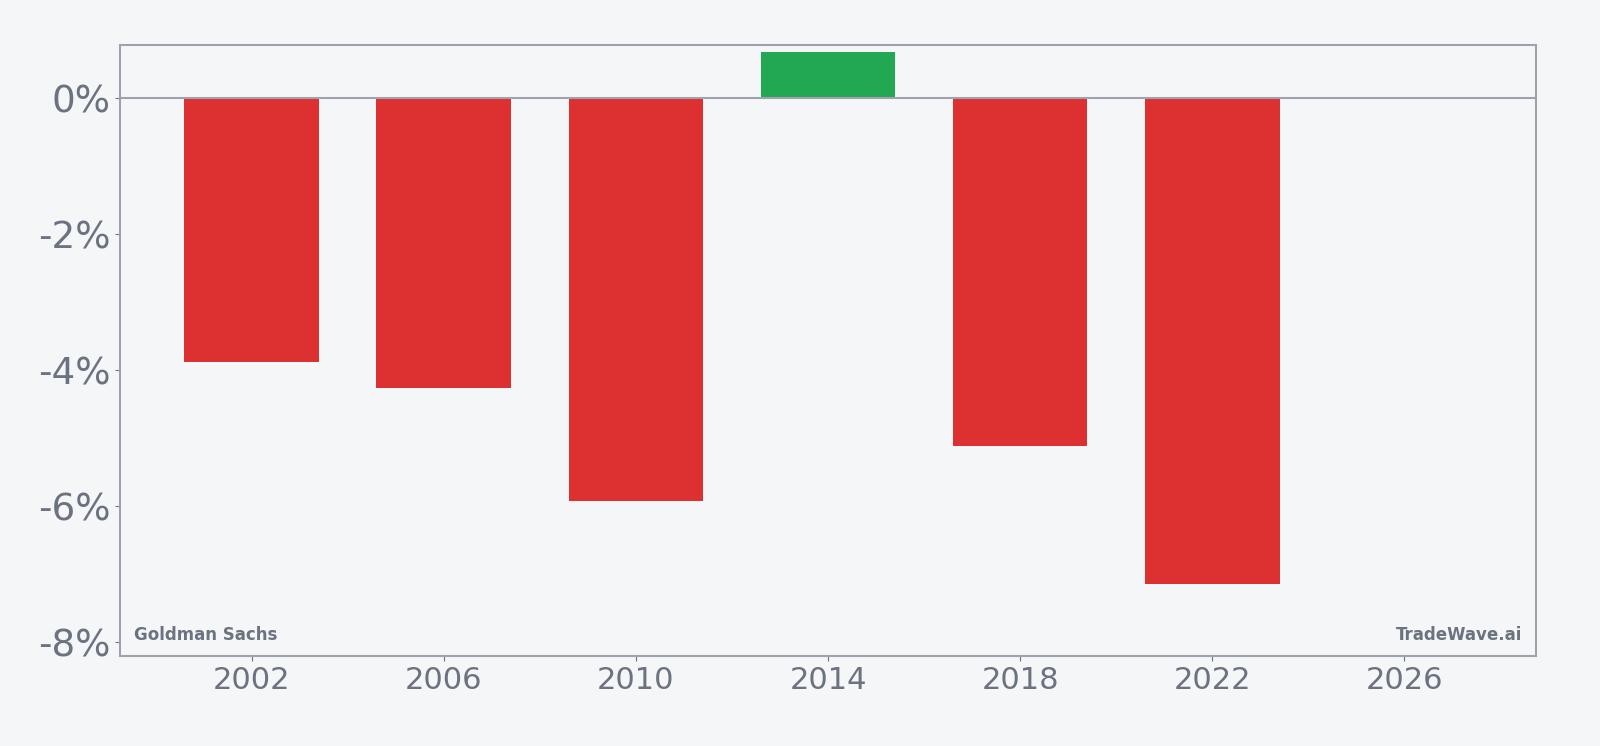
Goldman Sachs has fallen in 5 of 6 midterm-election-year windows starting around Apr 21, with an average 5.27% gain in winning years for the short setup.
- 5 wins and 1 loss for the short setup in this window, with winners averaging 5.27% moves in the trade direction.
- The 12-day window begins on Apr 21 and covers the last 6 midterm election years, a phase that often trades differently from typical years.
- Percent Profitable is 83%, with 5 winners and 1 loser across the sample.
- Avg Profit in winning years is 5.27%, while Avg Profit - All, including the lone losing year, is 4%.
- Maximum adverse excursions have reached nearly 10% in some years, showing that even successful shorts have faced sharp squeezes.
- A TradeWave Ratio of 2.28 and a Sharpe ratio of 1.54 point to a historically efficient but volatile short window.
According to historical data from TradeWave.ai, this midterm-election slice of the calendar has behaved very differently from an average spring for Goldman Sachs. The next section walks through what that pattern has looked like and how it lines up with today’s backdrop.
How has Goldman Sachs (GS) traded in this April midterm-year window?
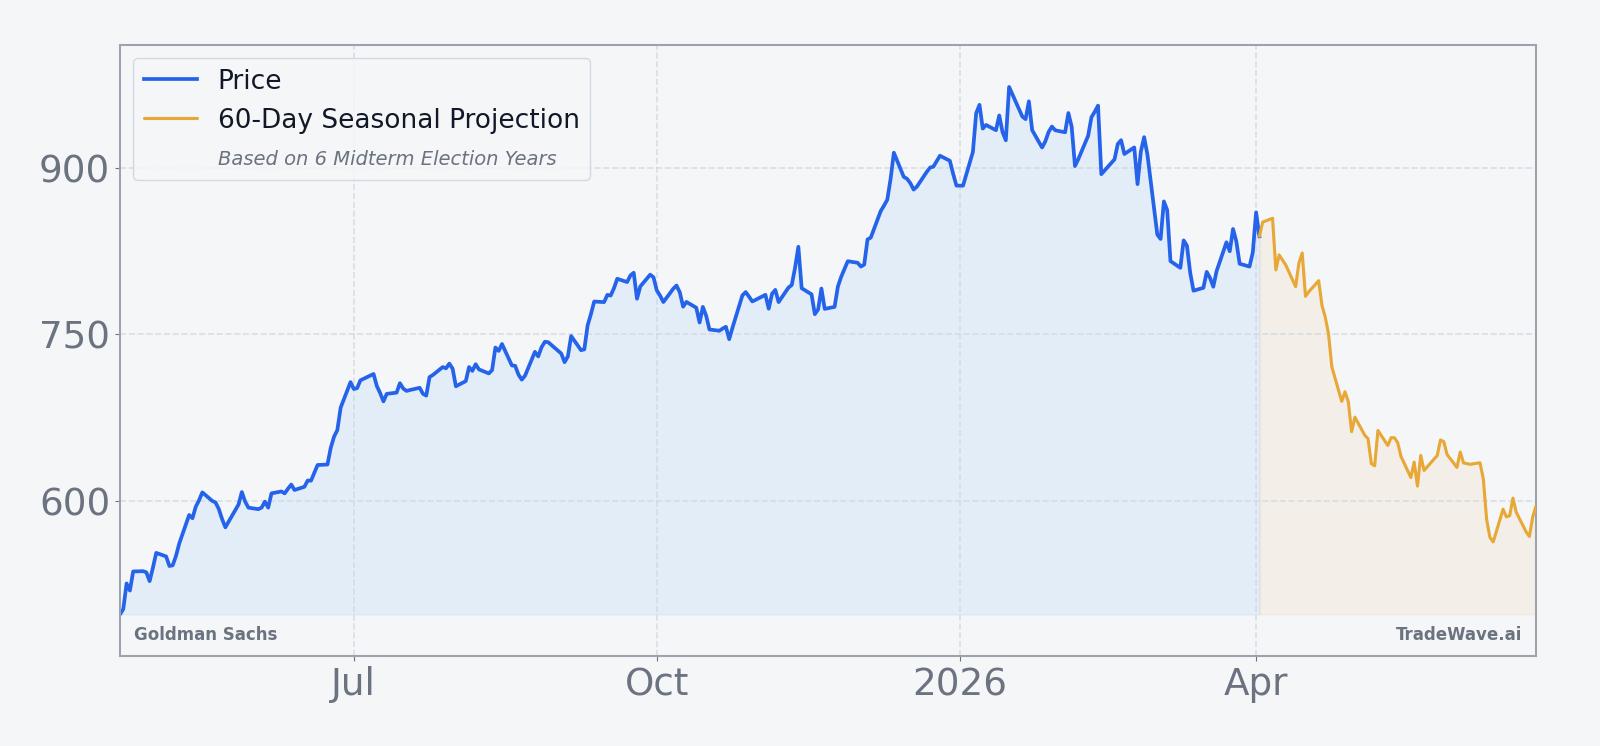
In the last six midterm election years, Goldman Sachs has moved lower in this late-April window in five of six cases, making it a historically favorable stretch for short positions. The stock closed Monday at $863.04, up 0.3% on the day and roughly 51% year to date, leaving it about 12.4% below its 52-week high of $984.70.[8]
The presidential election cycle matters here because midterm years often bring policy uncertainty, regulatory noise and shifting expectations for rates and fiscal spending, all of which feed directly into big banks’ trading and deal pipelines. Grouping only midterm years isolates that environment and shows how Goldman Sachs has tended to trade when Washington is in the middle of the cycle rather than on the cusp of an election.
Across the six midterm-year samples, the short setup has been profitable 83% of the time, with 5 winners and 1 loser. In winning years, Goldman Sachs has moved an average of 5.27% in the short direction over the 12-day span, while including the lone losing year brings the all-years average move to 4% in favor of shorts. That combination of a high hit rate and only modest dilution from the losing year is what makes this GS seasonal trend stand out.
The per-year table shows that 2022 was the strongest year for the pattern, with a 7.14% net decline in the stock during the window and a worst intraperiod drawdown of 9.6% from the entry price. At the other end of the spectrum, 2014 was the only losing year for shorts, with Goldman Sachs finishing the window up 0.68% even though the stock still traded as much as 2.41% against the short at one point. That mix of outcomes illustrates how the pattern has usually favored downside but has not been one-way.
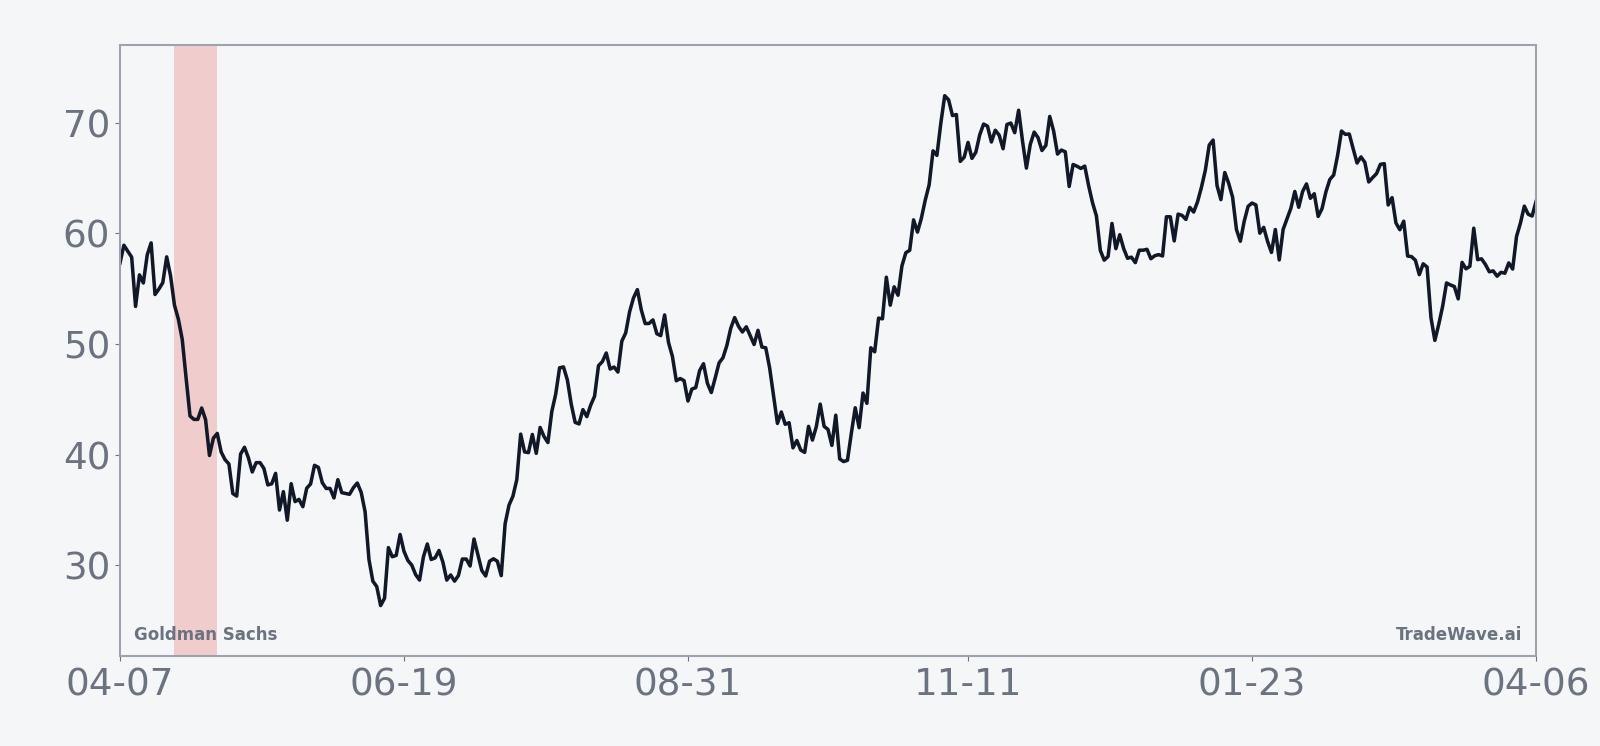
The historical seasonal average curve slopes lower fairly steadily across the 12 days, rather than showing a single crash point. In prior midterm years, the typical pattern has been a grind lower for Goldman Sachs during this stretch, with rallies tending to fade rather than extend.
Year-by-year bars that include both peak run-ups and worst drawdowns show how much the stock has swung inside the window even when the final result favored shorts.
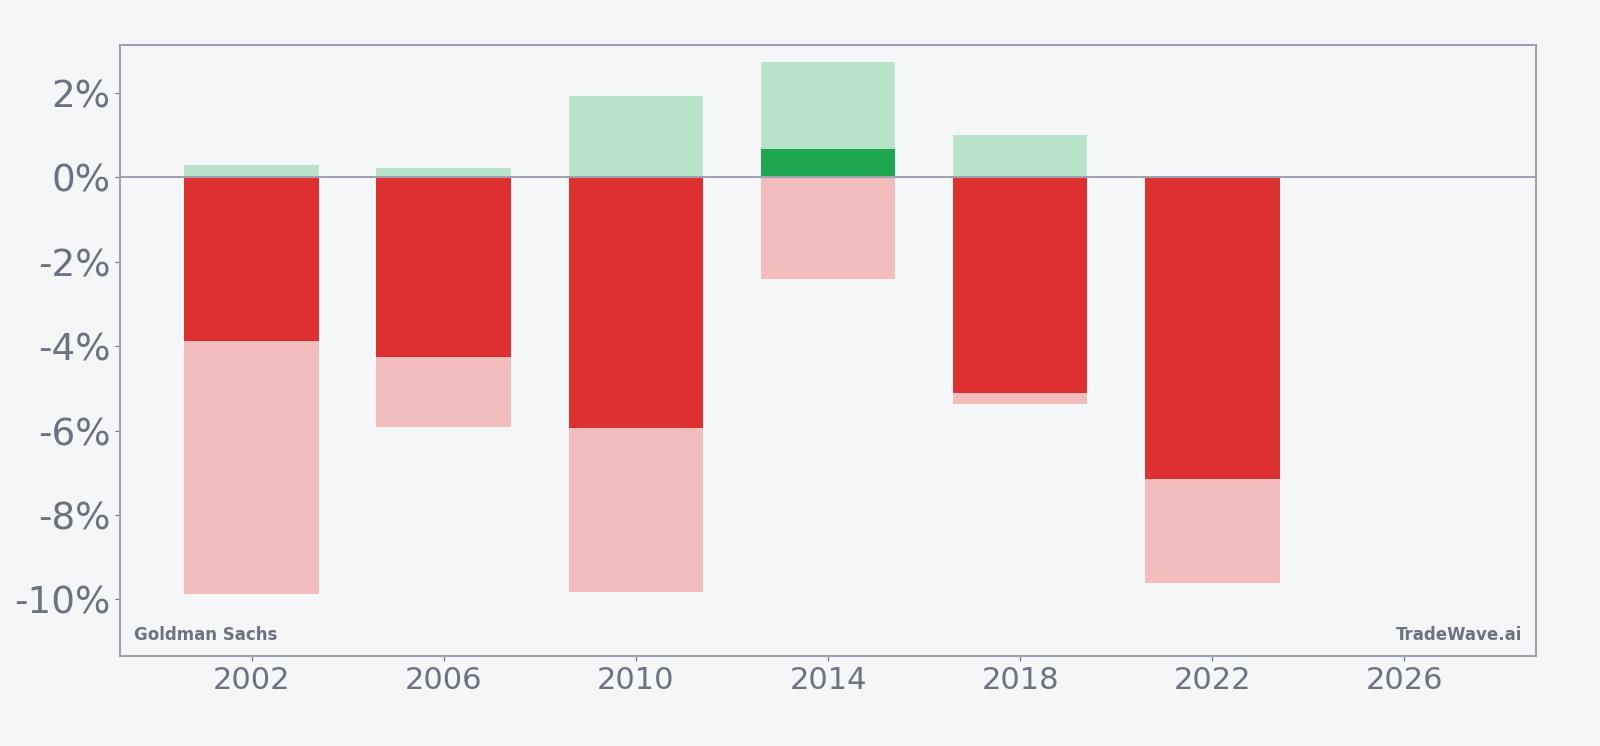
The maximum favorable excursions in winning years have often stretched beyond the final net move, which is what drives a TradeWave Ratio of 2.28 and signals that intraperiod swings can be large relative to the closing result. At the same time, maximum adverse excursions have reached between about 5% and nearly 10% in several years, meaning shorts have had to sit through meaningful squeezes even when the window ultimately finished in their favor. Add it up: five for six in the trade direction, but with enough two-way volatility that position sizing has mattered as much as direction.
History does not guarantee future results; adverse excursions can be large even in winning windows, and past midterm-year behavior may not repeat.
Why does Goldman Sachs (GS) follow this seasonal pattern?
This pattern may reflect how midterm-year policy uncertainty intersects with Goldman Sachs’ deal and trading calendar. One likely driver is that corporate clients often pause or reshuffle capital markets activity around spring policy debates, which can affect revenue expectations and risk appetite for bank stocks. Analysts have also pointed to institutional portfolio repositioning in midterm years, where investors trim financials after strong runs into the year, creating a short-term air pocket that shows up in this specific April window.
What is driving Goldman Sachs (GS) today?
Goldman Sachs finished Monday at $863.04, up 0.3% on the session, extending a powerful run that has lifted the stock roughly 51% so far in 2026 and left it about 12.4% below its 52-week high of $984.70.[8] The move comes as investors continue to digest a 12% jump in fourth-quarter profit to $4.62 billion on record investment banking and markets revenue, which underscored how much the firm is benefiting from a rebound in dealmaking and trading activity.[5] In March 2026, Goldman Sachs also outlined performance-based job cuts planned for April, a reminder that management is still focused on cost discipline even as revenue improves.[8]
In January 2026, The Wall Street Journal reported that the bank’s Q4 profit increase was driven by a surge in advisory and underwriting fees, reinforcing the idea that a potential record year for mergers and acquisitions in 2026 could push earnings above $60 per share if the pipeline holds up.[2][5] That bullish earnings backdrop sits alongside a still-supportive analyst view: Bank of America’s research, cited by CNBC in late 2025, showed a Buy consensus rating and a $900 price target for Goldman Sachs, a level that is close to where the stock trades today and reflects expectations formed before the latest leg of the rally.[2][3] On the regulatory front, Reuters reported on Mar 19, 2026 that the upcoming job cuts are targeted and performance-based rather than part of a broad restructuring, suggesting the firm is fine-tuning headcount rather than pulling back from growth initiatives.[8]
The chart below places the latest move against Goldman Sachs’ past year of trading and a 60-day seasonal projection.
What should traders watch as this Goldman Sachs (GS) window approaches?
The first marker is timing: the 12-day window tied to the last six midterm election years begins on Apr 21, so any shift in tone around that date will be watched closely against the historical pattern. Price-wise, traders will focus on whether Goldman Sachs can push back toward the $900 area and potentially challenge the 52-week high near $985, or whether rallies stall as the window opens and the stock starts to mirror the typical grind lower seen in prior midterm years. Volatility inside the window will matter as much as direction, given that past episodes have featured intraperiod squeezes of 5% to almost 10% even when shorts ultimately worked.
Macro and policy catalysts will also be key. Expectations for record M&A in 2026, highlighted in late 2025 coverage, mean any signs of deal delays or regulatory pushback could hit sentiment for Goldman Sachs right as the seasonal window kicks in.[2] Traders will be watching the firm’s commentary on its advisory pipeline, capital markets activity and trading conditions, along with any follow-up detail on the April performance-based job cuts, for clues on whether the current earnings momentum can offset what has historically been a soft patch for the stock.[5][8] If Goldman Sachs holds firm or breaks higher through this window, it would mark a clear departure from the last six midterm cycles; if instead the stock starts to fade from recent highs with choppy intraday swings, it would look much more like the historical script.
Sources
- Seeking Alpha: Goldman Sachs stock dips after Q3 expenses, headcount climb; earnings and revenue beat (Oct 14, 2025)
- CNBC: JPMorgan downgrades Goldman Sachs, favors cheaper rivals (Oct 21, 2025)
- Reuters: Goldman's profit beats estimates as dealmaking rebound boosts investment banking (Oct 14, 2025)
- The Wall Street Journal: Goldman Sachs Profit Rises on Jump in Dealmaking (Jan 15, 2026)
- CNBC: Tuesday Wall Street stocks noted by analysts include Nvidia, Apple, Tesla, Goldman Sachs, Meta, Crocs, Carvana, Reddit, Spotify & more (Oct 21, 2025)
- CNBC: One of Goldman's big trade recommendations for rest of year is gold miners (Sep 8, 2025)
- Reuters: Goldman Sachs to make performance-based job cuts in April, source says (Mar 19, 2026)
About this seasonal analysis
Seasonal pattern data is sourced from TradeWave.ai, which analyzes historical price behavior across annual calendar windows going back up to 30 years. Read the full data methodology or the book The 100-Year Pattern by Afshin Moshrefi (2026 edition). Past performance of seasonal patterns does not guarantee future results. This article is for informational purposes only and does not constitute investment advice.