Expedia Group (EXPE) Has Rallied 10 of 10 Times in This 13-Day April Window
Expedia Group is heading into a short April seasonal window that has never been negative in the past decade, even as the stock trades well below its 52-week high in a still-competitive online travel market.

What is the seasonal pattern for Expedia Group (EXPE)?
Expedia Group has risen in 10 of 10 years during this mid-April 13-day window, with an average gain of 2.83% in winning years.
- 10 for 10 in this window, with Expedia Group averaging 2.83% gains across all winning years.
- The upcoming pattern runs from Apr 10 for 13 trading days and has been a consistently bullish EXPE seasonal trend.
- Percent Profitable is 100%, with 10 winners and 0 losers over the past decade in this Expedia Group trading window.
- Average winner gains of 2.83% come with a TradeWave Ratio of 1.94, showing meaningful intraperiod travel in the trade direction.
- The Sharpe ratio of 1.42 signals a favorable risk-adjusted profile for this historical seasonality, despite some years seeing notable drawdowns before finishing higher.
- Maximum adverse moves in prior years show that even “10 for 10” windows can involve sharp pullbacks before the pattern plays out.
According to historical data from TradeWave.ai, this mid-April stretch has behaved very differently from an average month for Expedia Group. The next section walks through how that pattern has unfolded in prior years and what it means as the 2026 window approaches.
How has Expedia Group (EXPE) traded in this April seasonal window?
Expedia Group has posted gains in every single iteration of this 13-day April window over the past decade, averaging a 2.83% rise with a long bias. The stock closed Thursday at $227.67, down 1.4% on the day and about 25.1% below its 52-week high of $303.80, leaving room on the chart if the pattern repeats.[1]
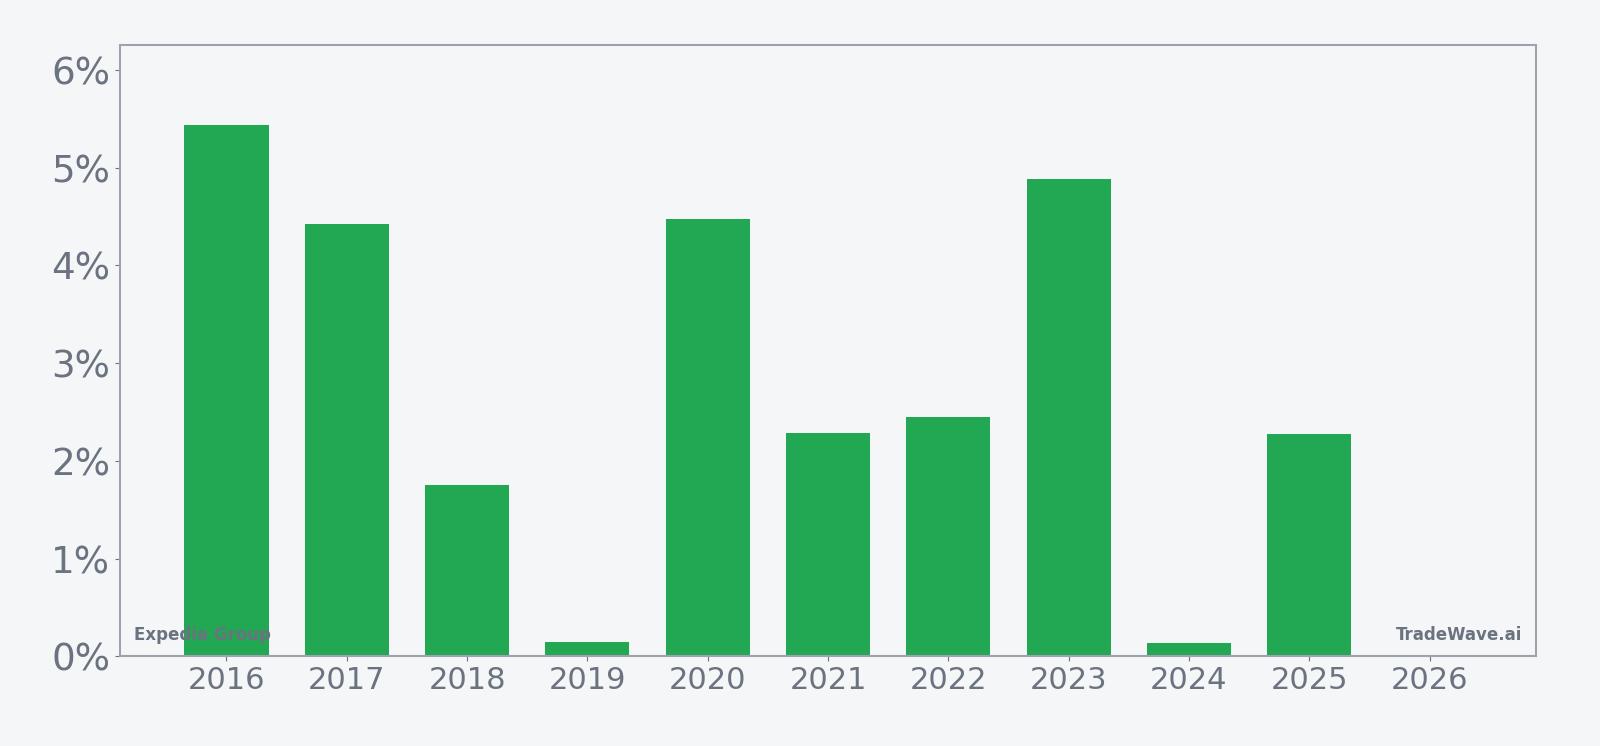
Across the 10-year sample, the strongest year in this Expedia Group seasonal pattern was 2016, when the stock gained 5.44% in the window after a maximum favorable move of 9.11% from the entry. The softest outcome was 2019, which still finished slightly positive at 0.15% after a modest 3.29% peak run-up, underscoring that even the weaker years have not flipped negative.
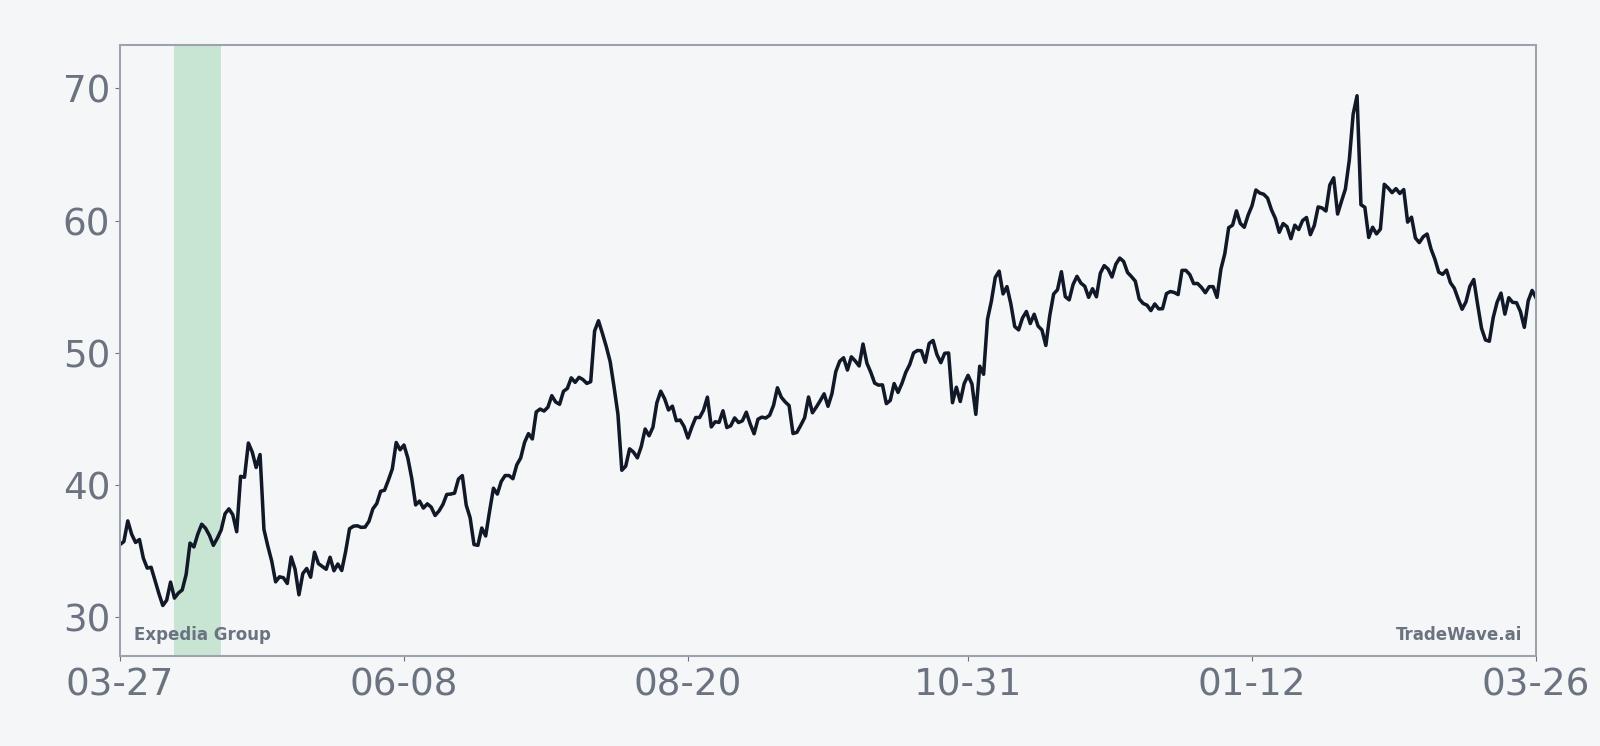
The 10-year average curve for this EXPE seasonal trend slopes higher, with gains tending to build steadily rather than in a single spike. In several years, including 2020 and 2023, the maximum favorable move reached between roughly 7% and 10% at some point in the window, which is much larger than the final net gain, hinting at intraperiod volatility that active traders might care about.
A combined view of yearly net returns and intraperiod swings shows how upside and downside have coexisted inside this bullish window.
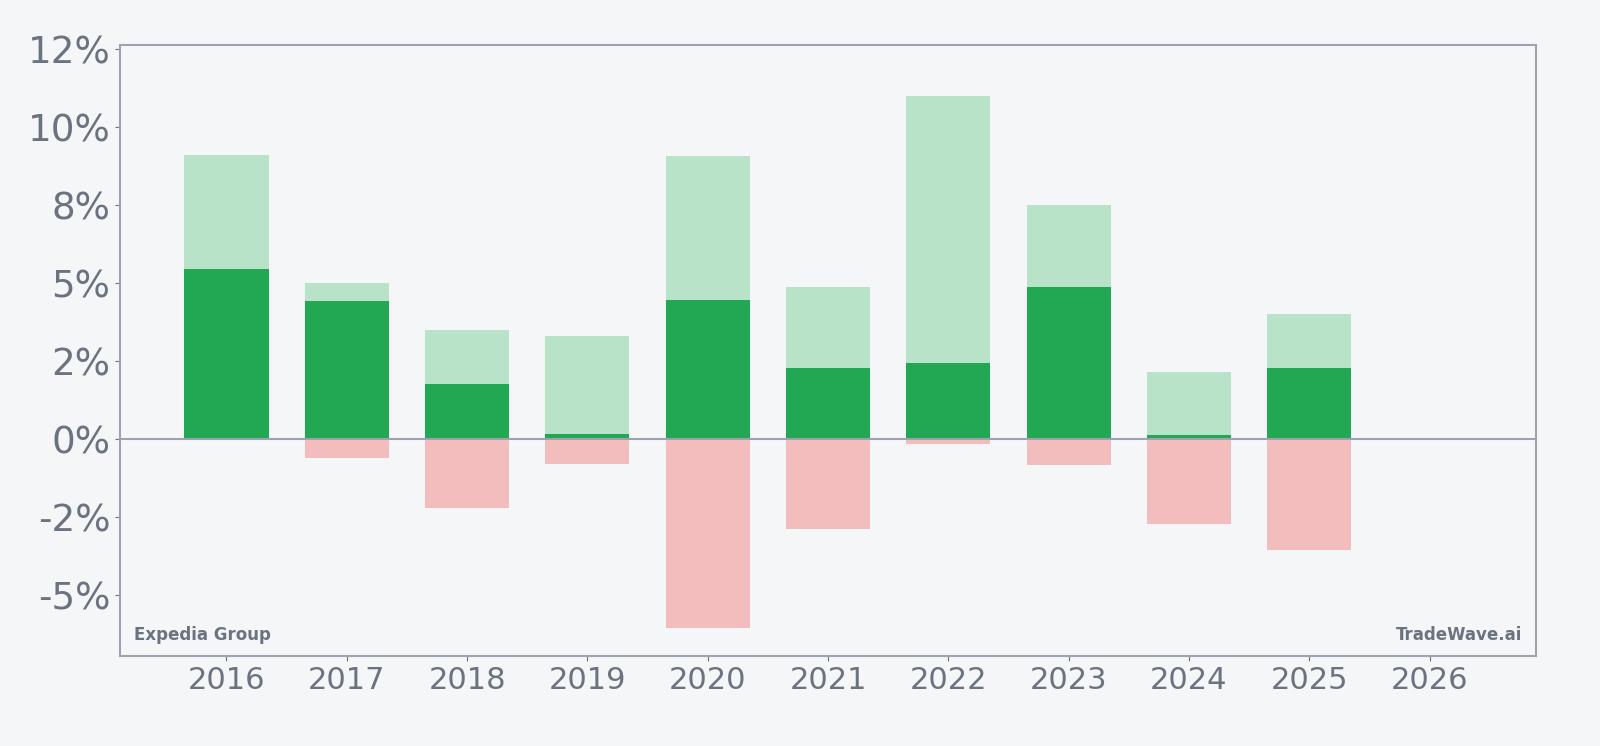
The bar chart shows that while every year finished green, several windows saw meaningful drawdowns before recovering. In 2020, for example, the stock’s best intraperiod move was a 9.07% rally, but the worst drawdown from entry was a 6.06% slide, illustrating how quickly the tape can swing even inside a historically friendly stretch. Other years, such as 2018 and 2024, show smaller net gains paired with adverse moves of around 2% to 3%, which may matter for traders sizing risk.
History does not guarantee future results; adverse excursions can be large even in winning windows, and past patterns may not repeat.
Put simply, this Expedia Group seasonal window has been quietly powerful: 10 winners out of 10, positive average returns, and repeated instances where the stock traveled meaningfully in the long direction within a short 13-day span.
Why does Expedia Group (EXPE) follow this seasonal pattern?
One likely driver is the travel booking cycle, as mid-April often captures late-spring and early-summer trip planning that flows through online travel agencies. Analysts have also pointed to how marketing campaigns and promotional calendars can bunch in this period, lifting gross bookings and sentiment around travel stocks.[1] The pattern may further reflect institutional portfolio positioning ahead of the summer travel season, when investors reassess exposure to consumer and leisure names.
What is driving Expedia Group (EXPE) today?
Expedia Group shares slipped 1.4% to $227.67 on Thursday, leaving the stock about 25.1% below its 52-week high of $303.80 and up roughly 7.3% over the past month.[1] The pullback comes after a powerful run that followed a travel rebound narrative and strong execution on AI-driven product improvements, which have helped the company grow bookings even as competition from peers like Booking remains intense.[1][6]
In Feb 2026, Forbes highlighted that global travel demand remains resilient despite macro uncertainty, and suggested that a path to $258 for the stock depends on revenue growth staying on track with management’s outlook.[1] That analysis pointed to full-year 2025 gross bookings guidance of 3% to 5% growth, with potential acceleration toward 7% in 2026 as demand improves, framing Expedia as a beneficiary of a still-healthy consumer willing to spend on experiences.[1]
The chart below situates the latest move in its recent multi-month context and overlays the upcoming seasonal projection.
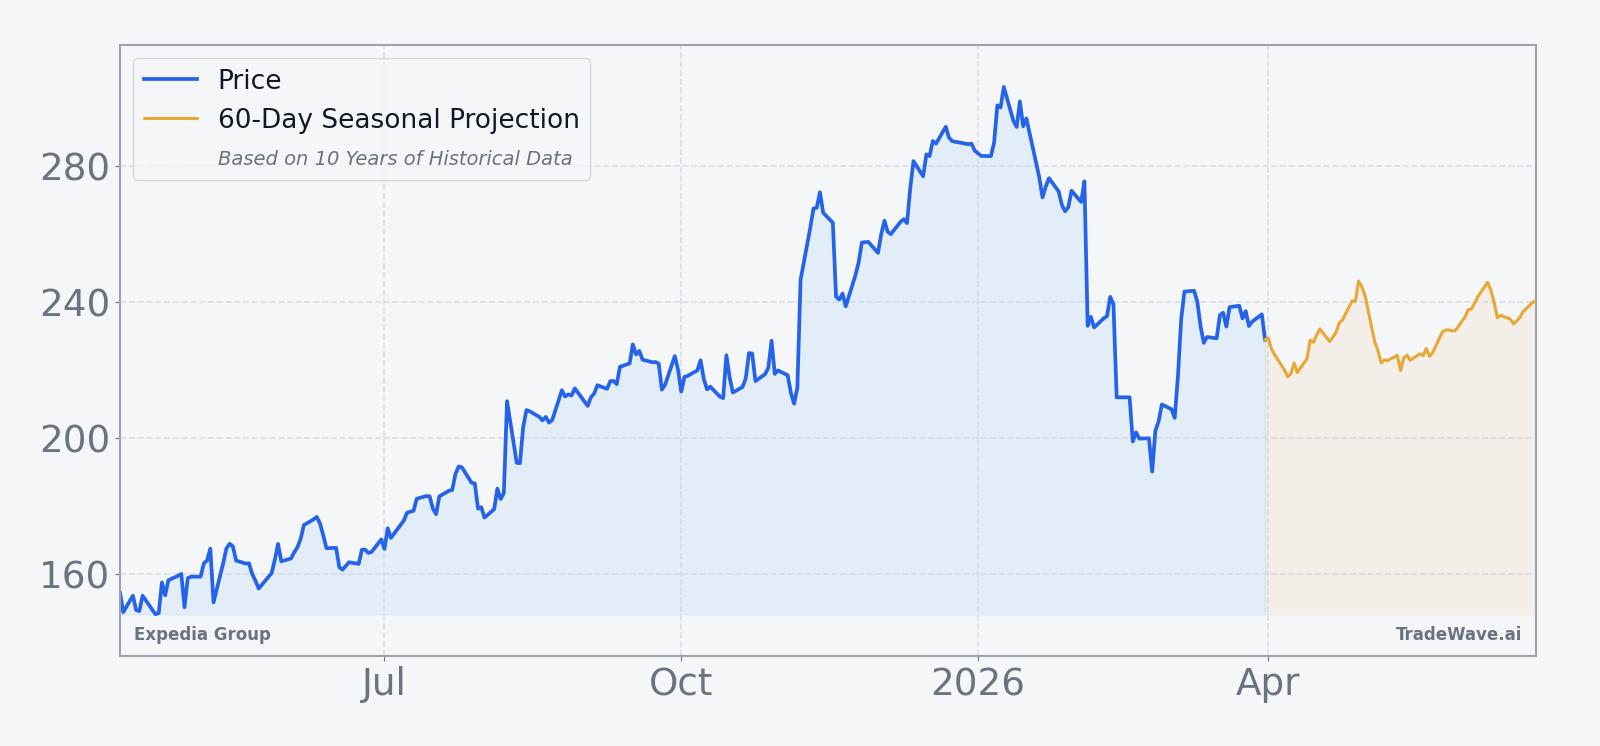
Looking back, the stock’s recent history has been shaped by earnings beats and a sharp post-earnings reaction. In Aug 2025, Reuters reported that Expedia shares soared after an upbeat forecast tied to a rebound in U.S. travel, as the company raised its full-year gross bookings outlook.[3] On Nov 7, 2025, Forbes noted that the stock surged more than 18% after a blowout third-quarter earnings call, with revenue up 9% year-on-year and net income jumping 40%, underscoring how quickly sentiment can swing when the company delivers on growth and profitability.[4]
Sector context also matters. A Feb 2026 comparison of Expedia and its peers pointed out that Expedia’s revenue growth of 7.6% trails some rivals that have leaned harder into AI and personalization, raising questions about long-term share gains even as the travel pie grows.[6] For now, the combination of a still-supportive macro travel backdrop and a stock trading well below its 52-week high sets the stage for the upcoming EXPE seasonal pattern to intersect with a market that is neither euphoric nor washed out.
What do earnings say about Expedia Group’s outlook?
Expedia’s recent earnings track record has been solid, with both Q2 and Q3 2025 results topping expectations. The company reported Q3 2025 revenue of $4.4 billion, with earnings per share of $7.33 versus $5.04 a year earlier, reflecting operating leverage as travel volumes recovered.[1][4] In Q2 2025, revenue came in at $3.79 billion, ahead of consensus estimates of $3.71 billion, and management raised its full-year gross bookings forecast to 3% to 5%, citing strong travel demand.[2][3]
Guidance has been constructive rather than euphoric. Management has talked about bookings growth of 3% to 5% for 2025, with the potential to accelerate toward 7% in 2026 if demand trends hold, which would keep Expedia on a steady, if not hyper-growth, trajectory.[1] Street commentary framed this as a “road to $258” scenario, where execution on technology, loyalty, and supply partnerships needs to line up with the macro tailwind for the stock to close the gap to that target.[1]
Consensus ratings reflect that balance. According to Trefis via Forbes, analysts carry a Buy rating on the stock with a consensus price target around $258, implying upside from current levels but not a moonshot.[1] That target was set when the stock traded closer to that level, so investors may treat it more as a marker of a prior regime than a fresh line in the sand.
How does the macro travel backdrop affect Expedia Group?
The macro story around Expedia remains tied to a resilient travel cycle. In Feb 2026, Forbes described a “travel rebound” that has persisted despite economic uncertainty, supported by consumer spending and international travel trends that have kept planes and hotels full.[1] That resilience has helped offset concerns about higher rates and inflation, which could otherwise weigh on discretionary travel budgets.
At the same time, the online travel sector is in a technology arms race. A Feb 2026 comparison of Expedia and its peers noted that Expedia’s 7.6% revenue growth lags some rivals that have leaned more aggressively into AI-driven search, pricing, and personalization.[6] For investors, that means the macro tide is lifting all boats, but competitive positioning and product innovation will determine who captures the most incremental bookings.
How are investors valuing Expedia Group going into this window?
With shares at $227.67 and a consensus target of $258 from Trefis via Forbes, the market is pricing in further upside but also acknowledging execution risk.[1] The stock’s roughly 25.1% discount to its 52-week high suggests that investors have already digested much of the post-earnings euphoria from 2025 and are now weighing steady growth against competitive and macro uncertainties.[1]
For traders focused on stock pattern analysis, that setup matters. A historically strong EXPE seasonal trend is about to intersect with a valuation that is no longer stretched, a travel sector that remains healthy, and a company that has shown it can surprise to the upside on earnings when demand and execution line up.[1][3][4][6]
What should traders watch in this Expedia Group (EXPE) window?
As the 13-day April window opens on Apr 10, the first thing to watch is how EXPE behaves around key technical levels. A push back toward the 50-day moving average near $235 and then toward the low $240s would be consistent with the historical pattern of steady gains inside this window, while a break below recent lows would mark a clear departure from the past decade’s behavior.[1]
Second, earnings and booking commentary will matter. Any updates on 2026 gross bookings growth relative to the 7% potential discussed in February, or signs that international travel demand is cooling, could either reinforce or undercut the bullish seasonal backdrop.[1] Traders will also be watching how Expedia’s growth stacks up against peers, given the sector’s ongoing AI-driven competition.[6]
Finally, intraperiod volatility is worth monitoring. Prior years show that even in a “10 for 10” window, maximum adverse moves have sometimes reached several percentage points before the stock finished higher, so sharp pullbacks inside the window would not be unprecedented. If EXPE rallies early and holds gains with only shallow dips, it would echo the strongest historical years; if it whipsaws or fades hard, that would be a clear sign that this cycle is breaking from the usual Expedia Group seasonal pattern.
Sources
- [1] Forbes – “Expedia’s Road To $258: Is A Travel Rebound Priced In?” (Feb 25, 2026)
- [2] Reuters – “Expedia shares soar on upbeat forecast, US travel rebound” (Aug 08, 2025)
- [3] Reuters – “Expedia shares soar on upbeat forecast, US travel rebound” (Aug 08, 2025)
- [4] Forbes – “Expedia Stock Surges 18% After Blowout Third Quarter Earnings Call” (Nov 07, 2025)
- [6] Forbes – “Expedia Vs. Peers: Who Claims The Booking Throne?” (Feb 18, 2026)
About this seasonal analysis
Seasonal pattern data is sourced from TradeWave.ai, which analyzes historical price behavior across annual calendar windows going back up to 30 years. Read the full data methodology or the book The 100-Year Pattern by Afshin Moshrefi (2026 edition). Past performance of seasonal patterns does not guarantee future results. This article is for informational purposes only and does not constitute investment advice.