Vulcan Materials Company (VMC) Has Rallied in 8 of 10 Early-April Windows, Averaging 8.14% Gains
Vulcan Materials Company is about to enter a historically strong 30-day spring trading window just as the stock trades well below its 52-week high and investors weigh infrastructure-spending risk.

What is the seasonal pattern for Vulcan Materials Company (VMC)?
Vulcan Materials Company has risen in 8 of 10 years during this early-April 30-day window, with an average gain of 8.14% in winning years.
- 8 for 10 in this window, with winning years averaging 8.14% gains and a 6% average when all years are included.
- The upcoming 30-day window starts Apr 4, 2026 and has been a historically bullish VMC seasonal trend for long positions.
- Percent Profitable sits at 80%, with 8 winners and 2 losers across the past decade of this Vulcan Materials Company trading window.
- Average loss in down years has been limited to -2.05%, while the TradeWave Ratio of 1.46 points to meaningful travel in the trade direction.
- Intraperiod swings have featured sizable peak run-ups alongside occasional drawdowns, underscoring that even a strong seasonal edge comes with volatility.
According to historical data from TradeWave.ai, this specific early-April stretch has behaved very differently from an average month for VMC in prior years.
How has Vulcan Materials Company (VMC) traded in this April seasonal window?
Vulcan Materials Company has risen in 8 of the past 10 iterations of this 30-day spring window, with winning years averaging 8.14% gains and a 6% average across all years. The stock closed Friday at 279.88, down 0.1% on the day and about 15.5% below its 52-week high of 331.09, after slipping 2.56% over the past month. That combination of a strong historical April pattern and a pullback from highs gives this year’s window extra focus for traders watching the construction-materials seasonal outlook.
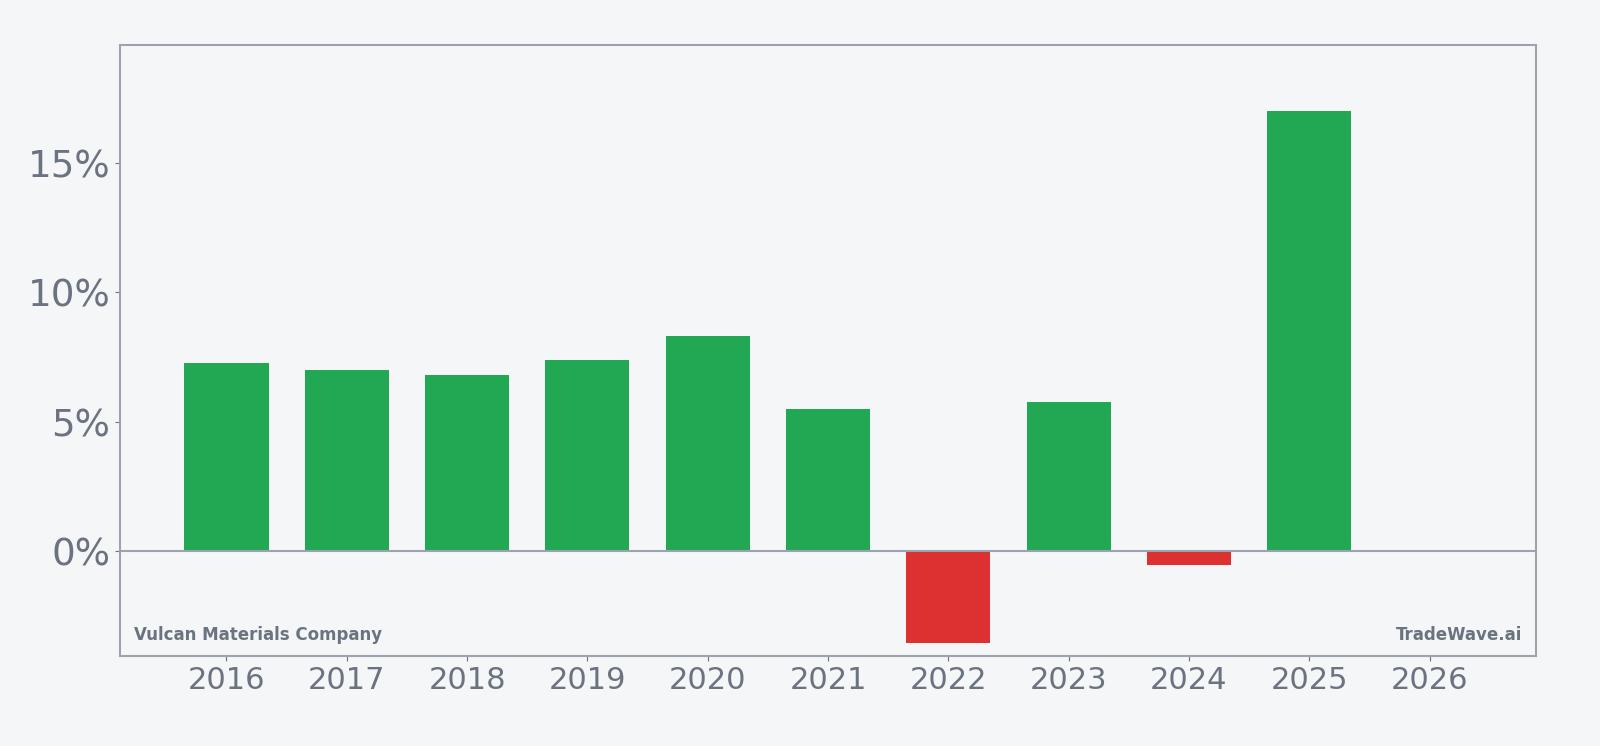
For this long-direction pattern, positive years have been both frequent and sizable. Across the decade, the window has delivered a 78% cumulative return, with a median gain of 6.9%, which lines up closely with the typical single-year outcome. The two losing years, 2022 and 2024, posted relatively modest net declines of -3.55% and -0.55% respectively, compared with double-digit upside in the strongest year, 2025, when VMC gained 17.03% between entry and exit.
Intraperiod swings have been meaningful. In 2020, for example, the best point-to-peak move, or maximum favorable excursion, reached 20.66% even though the final net gain was 8.3%. By contrast, the worst drawdown from entry, or maximum adverse excursion, hit -8.16% in 2022 and -5.69% in 2024, showing that even years that finish near flat or modestly down can involve sizable downside air pockets along the way.
The year-by-year profile shows that most winning windows have seen upside of roughly 6% to 8% with adverse moves contained to the low single digits. 2019, for instance, delivered a 7.4% net gain with only a -0.82% worst drawdown, while 2016 and 2017 posted gains of 7.29% and 6.99% with maximum adverse excursions of -1.32% and -2.51% respectively. The outlier downside year, 2022, combined a shallow peak of 0.96% with that -8.16% drawdown, underscoring that the pattern is not a one-way bet.
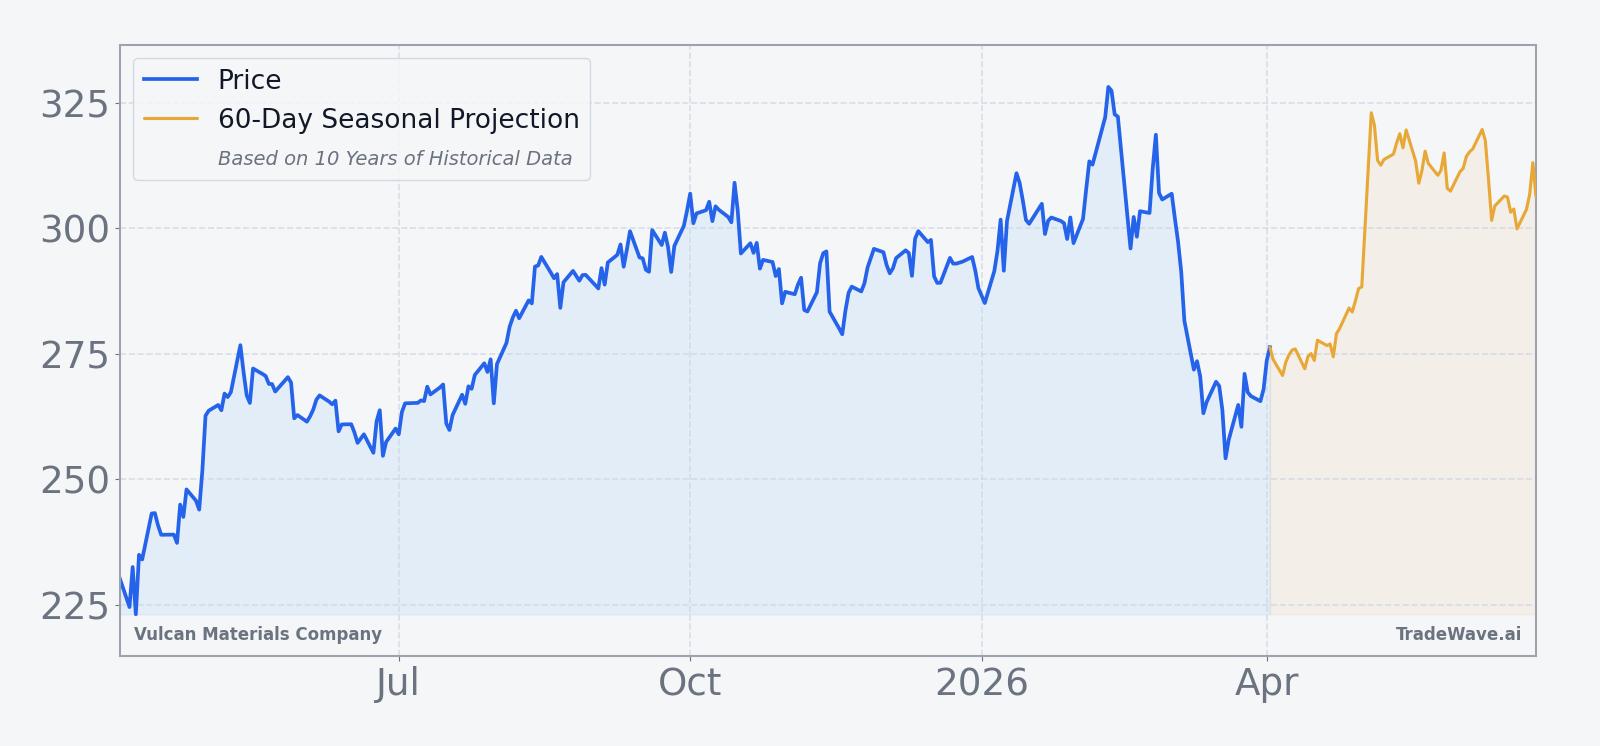
The 10-year seasonal trend chart suggests that, in winning years, much of the upside has tended to accrue steadily rather than in a single spike. The average path slopes higher across the window, with only brief pauses, which fits a narrative of construction and infrastructure demand building into late spring rather than a one-off catalyst.
A combined view of net results and intraperiod swings helps frame both the upside potential and the risk inside this window.
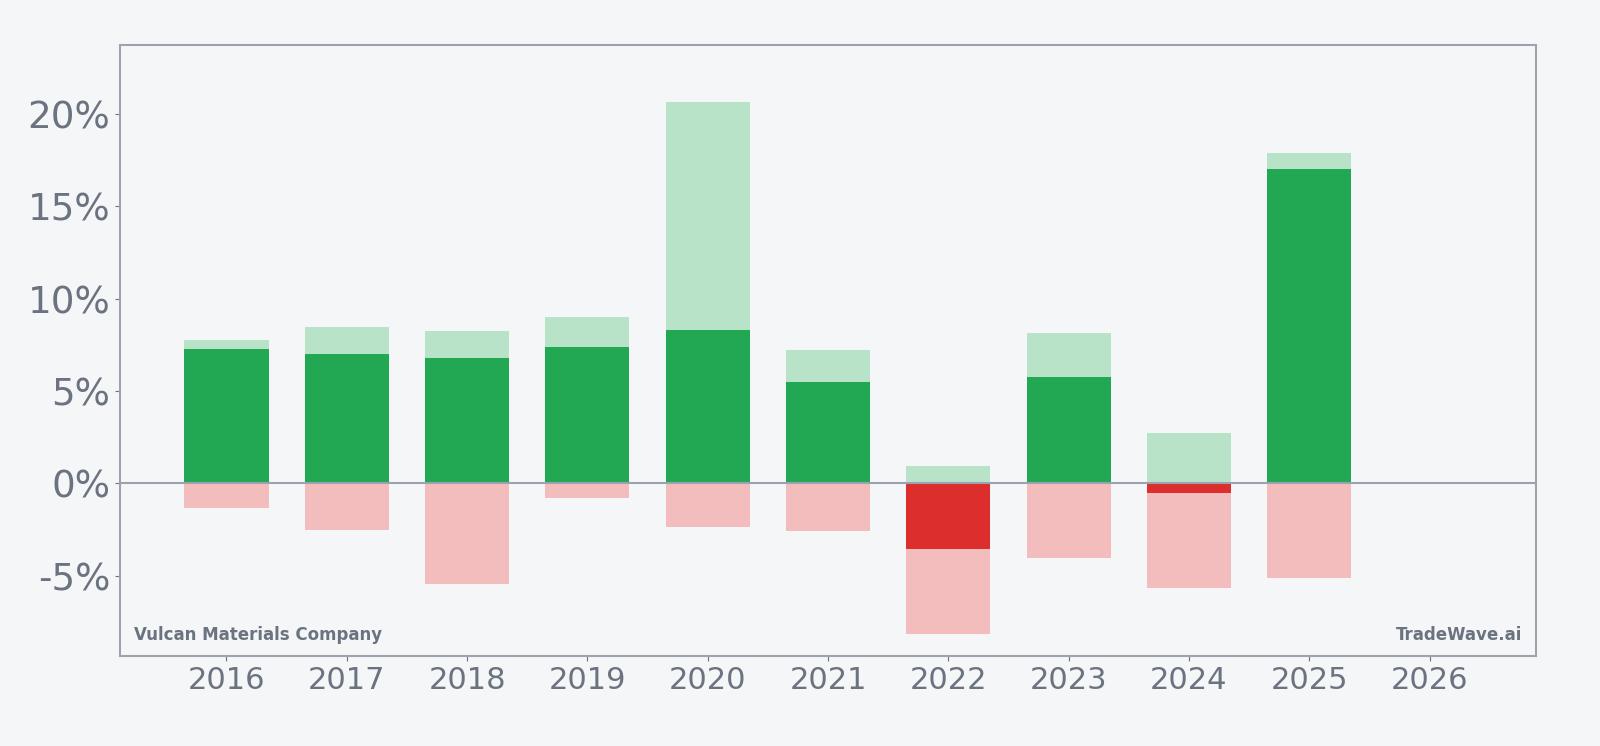
The stacked net, peak run-up and drawdown bars show a clear pattern: upside spikes have often stretched well beyond the final close, while downside has usually been more limited but occasionally sharp. Add it up and you get a window that has historically favored longs, but one where timing and risk management still matter.
History does not guarantee future results; adverse excursions (MAE) can be large even in winning windows.
Why does Vulcan Materials Company (VMC) follow this seasonal pattern?
One likely driver is the way public and private construction projects ramp into the heart of the building season, which can sharpen demand expectations for aggregates and asphalt in early spring. Analysts have also pointed to the timing of state and local budget cycles, where approvals and bid awards often cluster around this part of the year, influencing order visibility for materials suppliers. The pattern may further reflect institutional portfolio rotation into infrastructure and industrial names as investors position for warmer-weather activity.
What is driving Vulcan Materials Company (VMC) today?
Vulcan Materials Company finished Friday at 279.88, down 0.09% on the session, after trading between 275.42 and 284.53 on volume of about 1.42 million shares, slightly below its 20-day average of roughly 1.52 million. The stock is about 15.5% below its 52-week high of 331.09 and comfortably above its 52-week low near 216.62, with price also sitting under the 50-day moving average of 291.87, a sign that the recent pullback has cooled what had been a strong uptrend.
Fundamentally, the big swing factor for VMC remains government and infrastructure spending. In Sep 2025, analysis of the company’s outlook flagged potential government spending cuts as a key risk, given Vulcan’s heavy exposure to highway, street and public-works projects that depend on federal, state and local budgets.[1] Any shift in expectations around infrastructure bills, transportation funding or municipal finances can quickly change how investors value the company’s multi-year project pipeline.
On the earnings front, there is no confirmed date yet for the next Vulcan Materials Company report in the current data set, and no fresh guidance or consensus estimates are available. That leaves traders leaning more on macro and sector signals than on a near-term earnings catalyst as the stock approaches this seasonal window. With the shares already off their highs and trading below the 50-day moving average, the setup heading into early April looks more like a consolidation than a momentum chase.
Macro context also matters for a materials name like VMC. The risk of government spending reductions identified in 2025 still hangs over the story, since tighter fiscal policy could slow the pace of new infrastructure awards and pressure volumes over time.[1] At the same time, any signs that funding for roads, bridges and public works is holding up or even expanding would likely be read as a tailwind for aggregates demand, especially as the construction season ramps.
Valuation markers are not detailed in the current dataset, but the stock’s position below its recent highs and under its 50-day moving average suggests that some optimism has already been priced out. For investors who track stock pattern analysis and historical seasonality, that combination of a softer tape and a historically strong April window is what makes this particular stretch stand out.
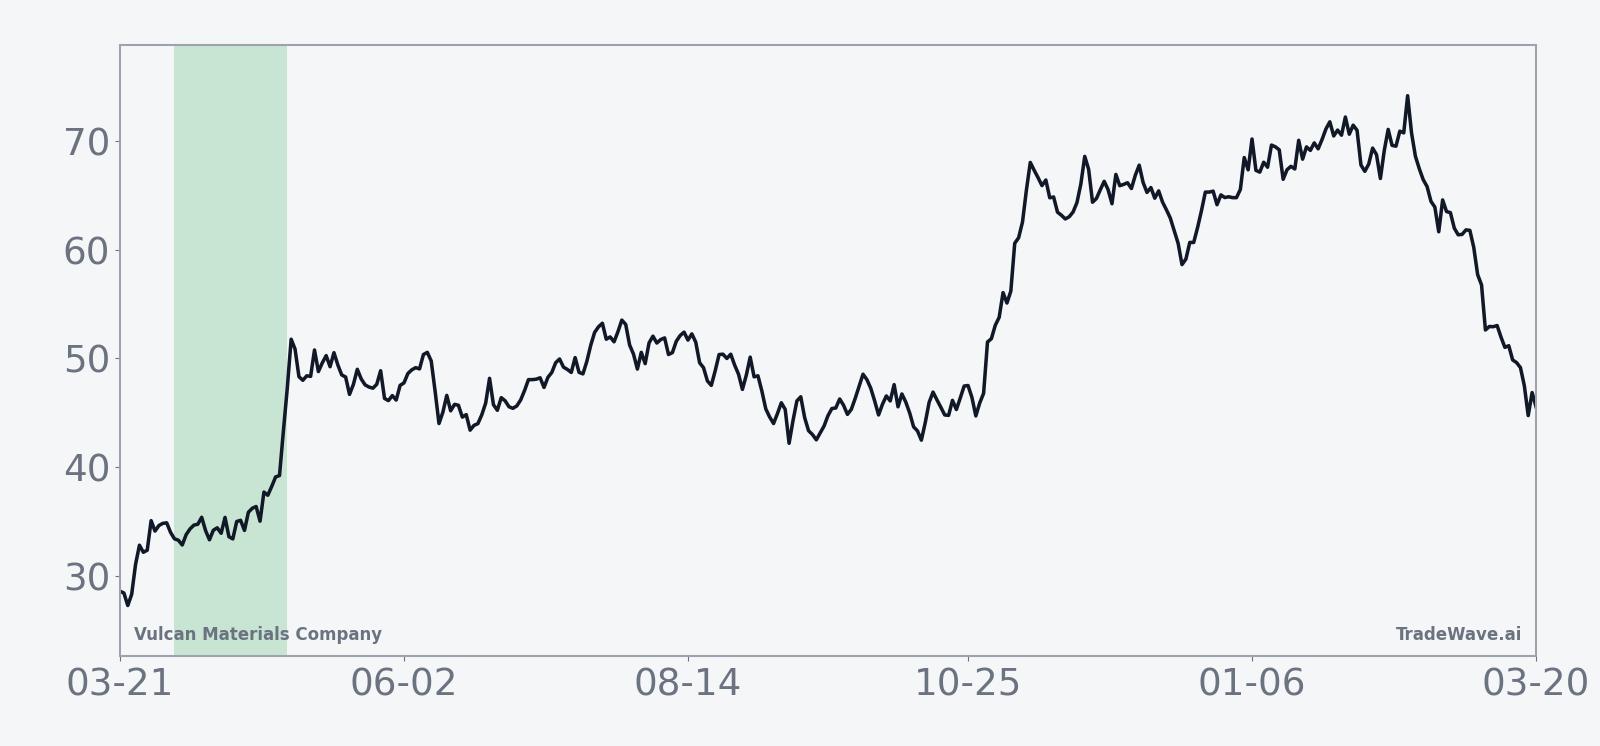
The chart below situates the latest pullback and the upcoming 30-day window within VMC’s past year of trading, along with a short-term seasonal projection.
What should traders watch in this Vulcan Materials Company (VMC) window?
First, watch how VMC behaves as the window opens around the 279.88 area and the nearby 50-day moving average at 291.87. A push back toward the low 290s with contained intraperiod drawdowns would be consistent with the historical pattern of steady spring gains, while a break toward the mid-260s would look more like the weaker 2022 and 2024 regimes.
Second, keep an eye on headlines and data around infrastructure and government budgets. Any confirmation that transportation or public-works funding is holding up, or that new projects are being awarded at a healthy clip, would support the bullish seasonal backdrop for aggregates demand. Conversely, renewed focus on spending cuts or delayed appropriations would test how much of the 80% win rate investors are willing to lean on this year.[1]
Third, monitor volume and intraday volatility inside the window. Historically, some of the best years have seen strong maximum favorable moves early in the period, even when final gains were smaller, so a pattern of early upside spikes on rising volume would fit the established VMC seasonal trend. If instead the stock grinds sideways on light activity, that would suggest the market is less willing to express a clear view on the construction-materials seasonal outlook this time around.
Finally, track how any bounce or further pullback interacts with the broader materials and industrials complex. VMC is a bellwether for U.S. aggregates demand, and its behavior in this historically strong April window can offer a useful read on how confidently investors are leaning into the 2026 construction season.
Sources
About this seasonal analysis
Seasonal pattern data is sourced from TradeWave.ai, which analyzes historical price behavior across annual calendar windows going back up to 30 years. Read the full data methodology or the book The 100-Year Pattern by Afshin Moshrefi (2026 edition). Past performance of seasonal patterns does not guarantee future results. This article is for informational purposes only and does not constitute investment advice.