Occidental Petroleum (OXY) Has Risen in 9 of 10 Midterm Springs Starting Apr. 11
Occidental Petroleum is heading into a historically strong 22-day spring trading window even as shares sit just below their 52-week high and energy faces shifting macro headwinds.

What is the seasonal pattern for Occidental Petroleum (OXY)?
Occidental Petroleum has risen in 9 of 10 midterm-year spring windows starting around Apr. 11, with an average gain of 4.05% in winning years.
- 9 for 10 in this window, averaging 4.05% gains in winning years across the last 10 midterm election cycles.
- The upcoming 22-day window begins on Apr. 11 and has been a historically bullish OXY seasonal trend in midterm years.
- Percent Profitable sits at 90%, with 9 winners and just 1 loser in the sample.
- Average profit across all years, including the lone down year, is still 4%, underscoring the strength of this Occidental Petroleum trading window.
- The TradeWave Ratio of 1.44 points to meaningful intraperiod travel in the long direction, while a Sharpe ratio of 0.82 reflects solid risk-adjusted returns.
- Even in winning years, adverse moves have occurred inside the window, so traders still need to respect drawdown risk.
According to historical data from TradeWave.ai, this specific midterm-year spring stretch has behaved very differently from an average month for OXY, and the next iteration is just days away.
How has Occidental Petroleum (OXY) traded in this midterm-year spring window?
In the last 10 midterm election years, Occidental Petroleum has finished this 22-day April window higher in 9 cases, averaging a 4.05% gain when it wins. The next run of this pattern begins on Apr. 11, with OXY last changing hands at $62.97, up 1.19% on the day and about 6.7% below its 52-week high of $67.45.[2] That combination of a strong historical seasonality and a stock trading near the upper end of its one-year range gives this window more weight than a typical calendar quirk.
The election-cycle lens matters here. This pattern is not built from 10 consecutive calendar years, but from the last 10 midterm election years, a phase that often brings policy uncertainty, shifting regulation and choppy risk appetite across energy and cyclicals. Grouping by the presidential cycle isolates how OXY has behaved when Washington is in the same part of its four-year rhythm as it is today.
Historically, the trade direction for this window is long. Percent Profitable is 90%, with 9 winners and 1 loser, and the all-years average outcome is a 4% gain over the 22 trading days. The median profit of 2.0% shows that even the more modest years have tended to finish green, while the cumulative return across all 10 midterm iterations adds up to 41%.
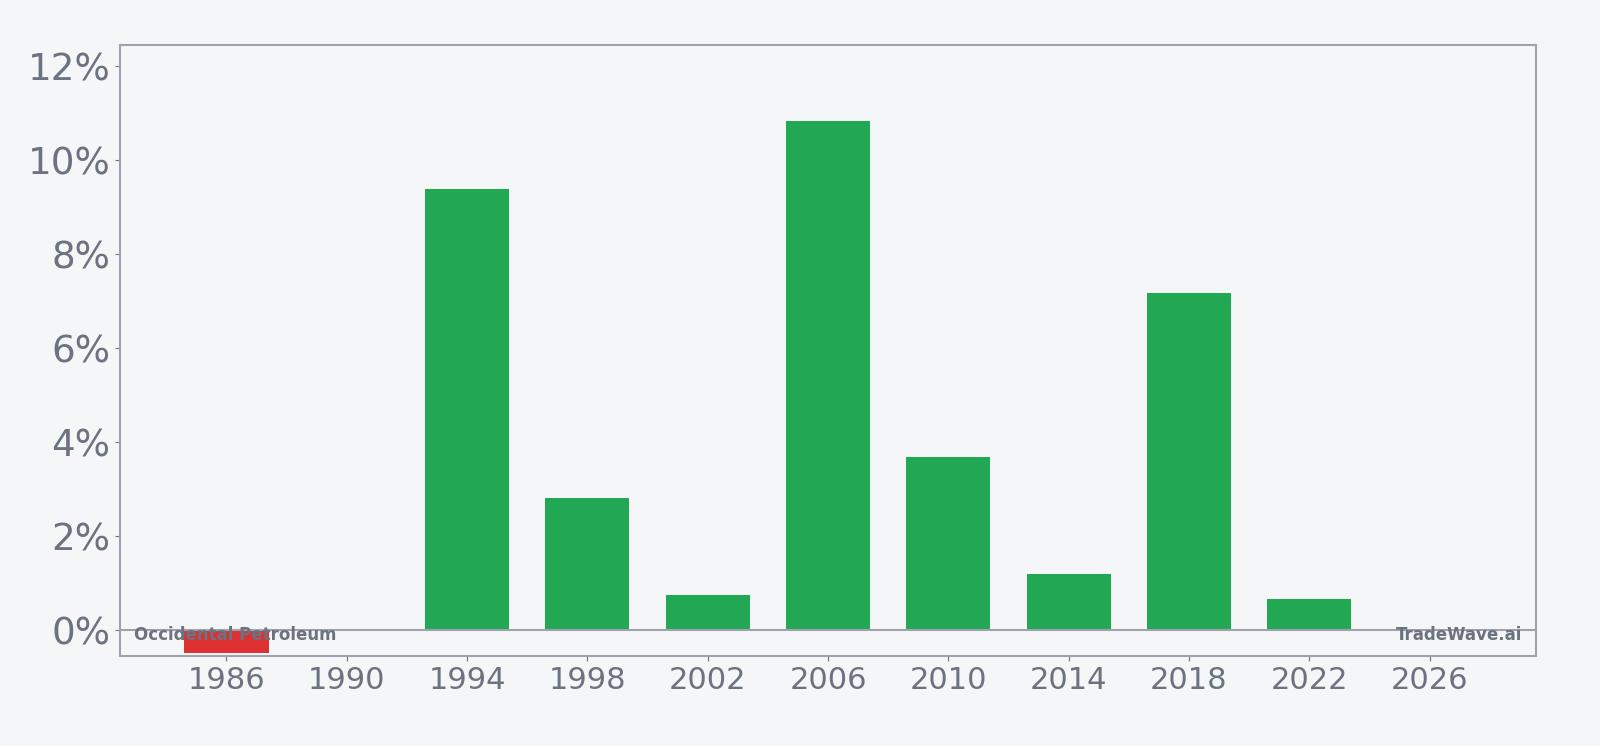
Average profit in the winning years clocks in at 4.05%, but the distribution is lumpy. The strongest example came in 2006, when OXY rallied 10.82% from late April into early May, with a maximum favorable move of 12.57% and only a 0.31% worst drawdown from entry. At the other end of the spectrum, 1986 delivered the lone losing outcome, a 0.48% decline that still saw the stock up as much as 2.89% inside the window before a 5.29% adverse swing pulled it back.
The intraperiod profile shows why traders treat this as more than a simple average-return story. Maximum favorable excursions have repeatedly stretched into the high single digits or low double digits, including 11.72% in 1994, 9.74% in 2022 and 8.97% in 2018. At the same time, maximum adverse moves have ranged from shallow dips of around 0.02% in 2014 to a sharp 11.03% drawdown in 2022, underscoring that even winning years can involve uncomfortable volatility.
Trend statistics back up the bullish tilt. The pattern’s long-trend score of 69 versus 10 on the short side, and an even stronger 81 versus 6 on the shorter-term trend view, point to a tendency for gains to build rather than mean-revert away. The annualized return of 3.53% for this narrow slice of the calendar is notable given the short 22-day holding period.
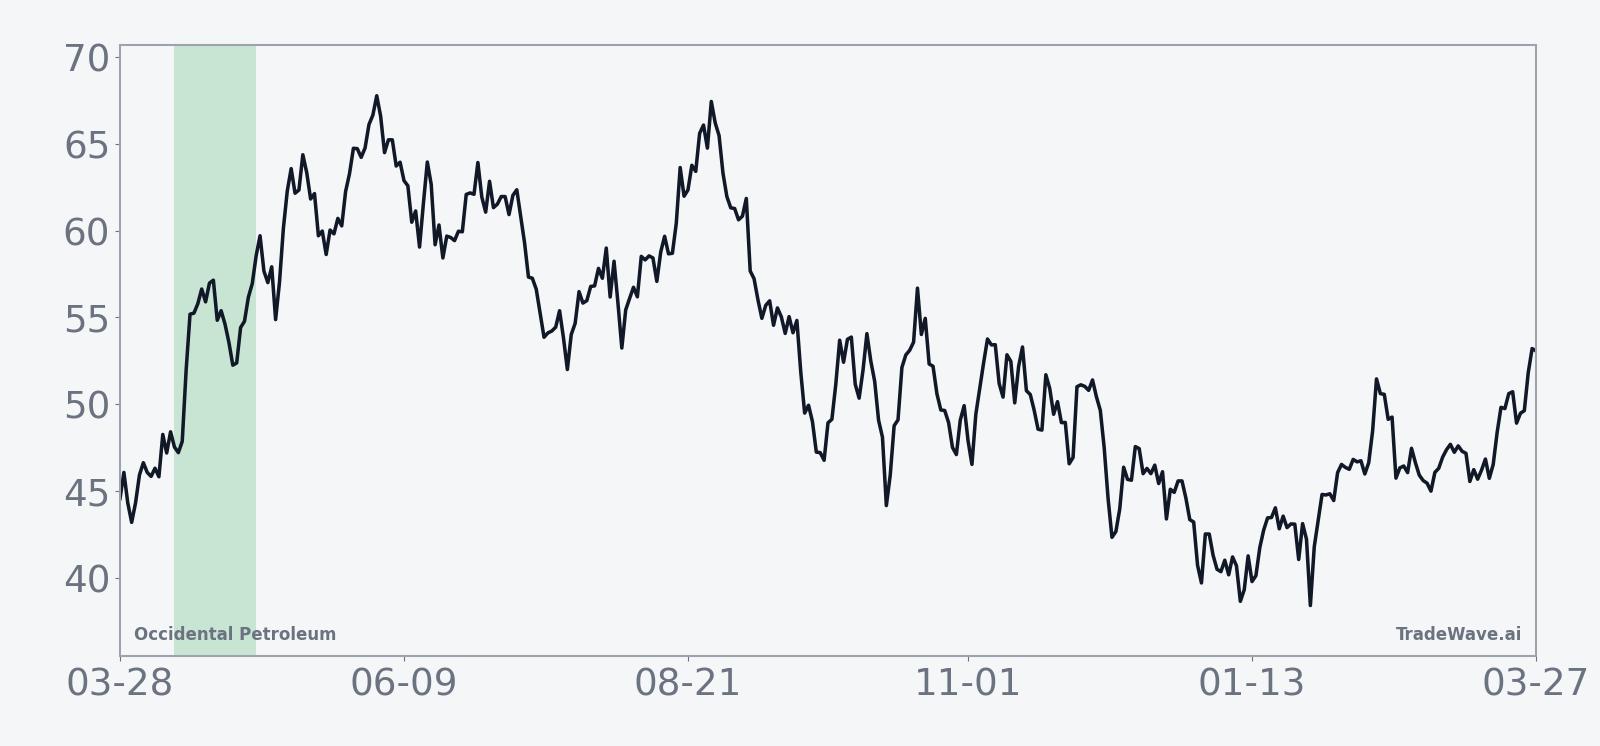
The historical seasonal average curve slopes higher through most of the window, with gains tending to accrue steadily rather than in a single spike. In several years, the strongest part of the move has clustered in the middle of the window, after a brief early dip that has offered better entry levels for traders willing to sit through volatility.
Year-by-year bars that combine net results with best and worst intraperiod swings show how upside and downside have coexisted in this pattern.
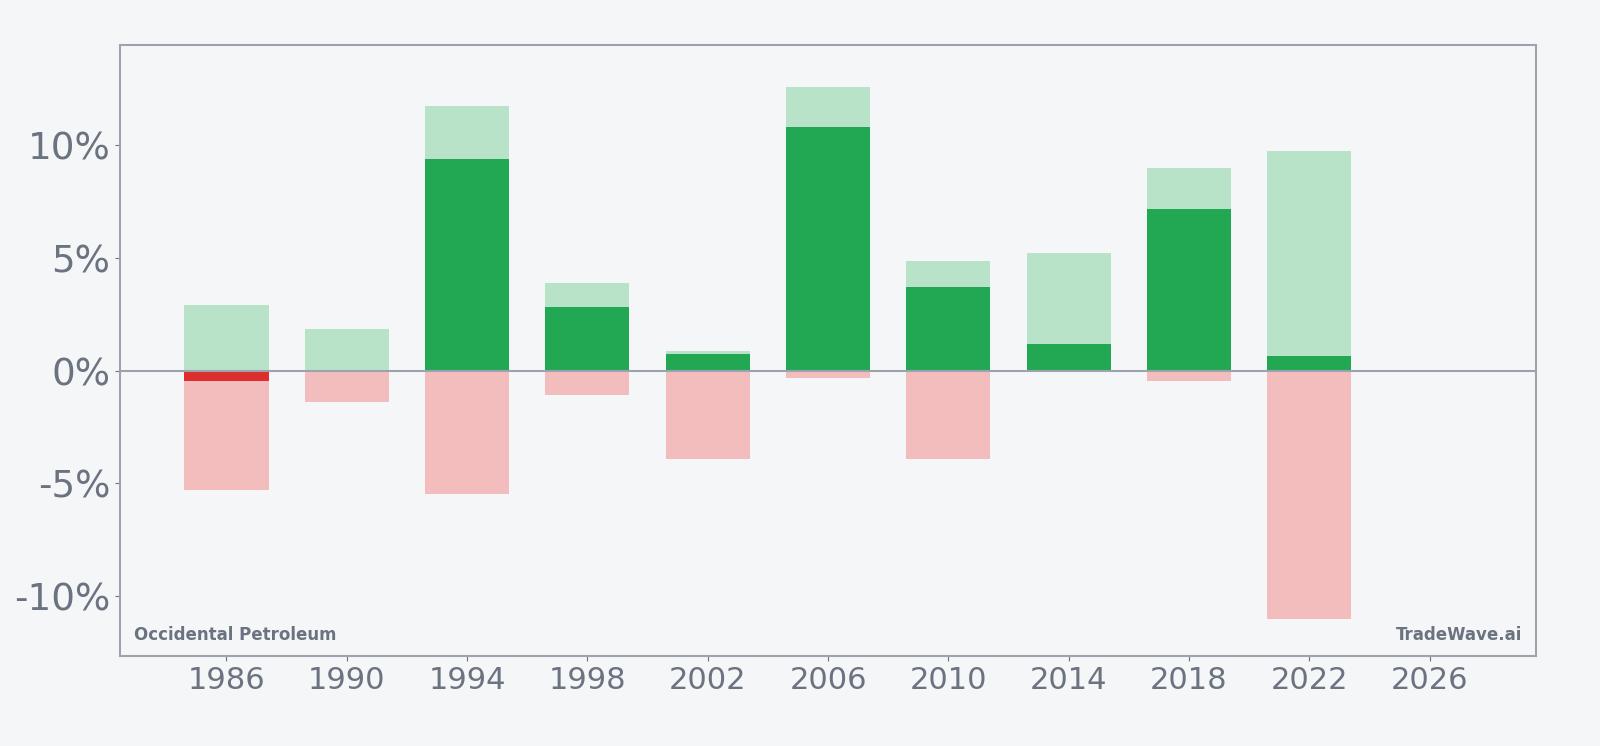
The stacked net, MFE and MAE bars make the trade-off clear: historically, OXY has offered sizable upside runs in this window, but the worst intraperiod drawdowns have sometimes been large even in years that finished higher. History does not guarantee future results; adverse excursions can be large even in winning windows.
Why does Occidental Petroleum (OXY) follow this seasonal pattern?
This midterm-year spring pattern may reflect a mix of energy sector rotation, the timing of OPEC+ policy decisions and how investors position around Occidental’s balance sheet and capital-return plans. One likely driver is that midterm years often bring clarity on regulation and fiscal priorities after early-year uncertainty, which can support higher-beta energy names. The window also sits in a period when crude demand expectations for the summer driving season firm up, giving integrated and upstream producers like OXY a tailwind when macro conditions cooperate.[2]
What is driving Occidental Petroleum (OXY) today?
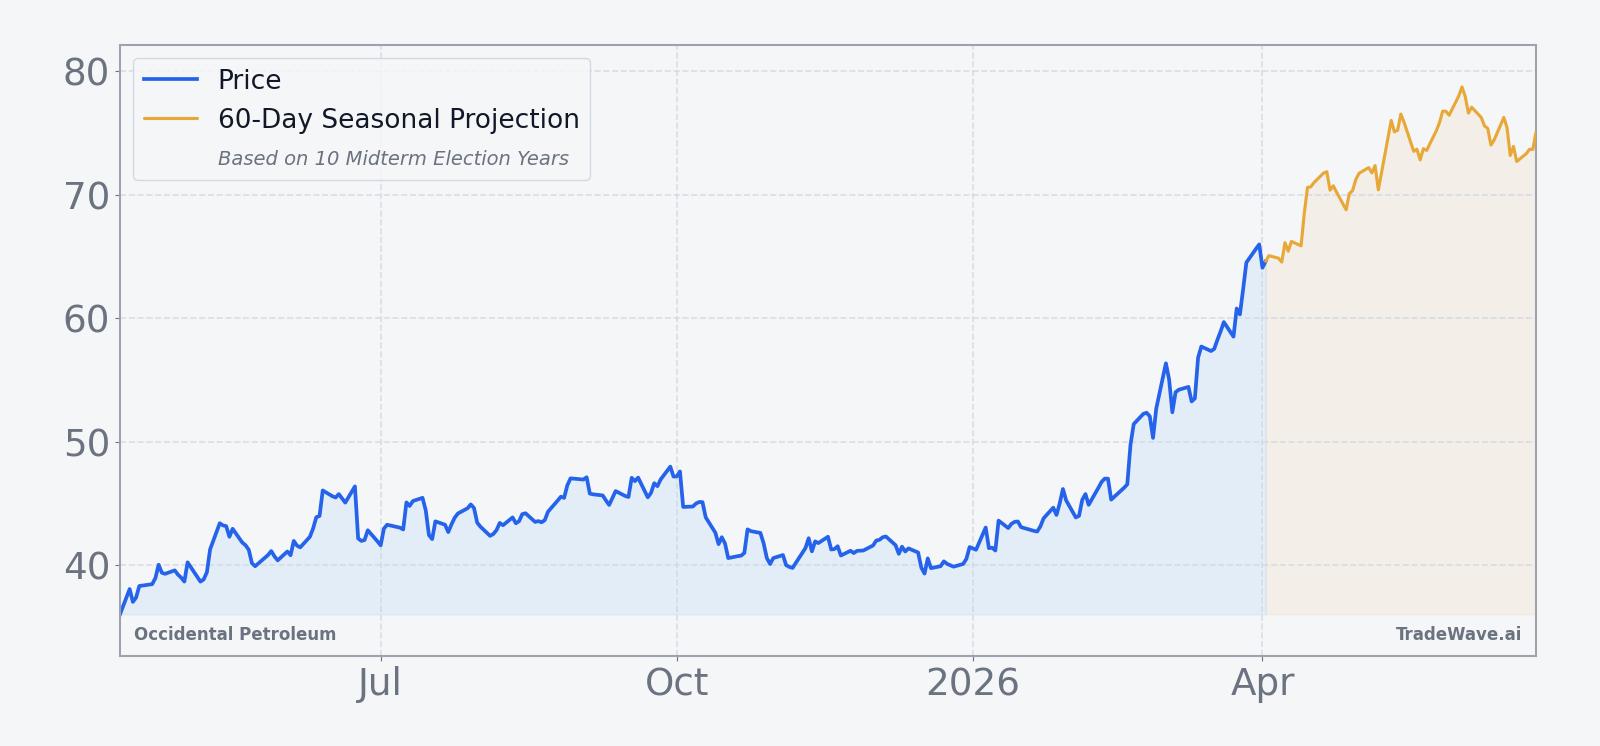
Occidental Petroleum shares closed at $62.97, up 1.19% on the session, extending a roughly 18.28% gain over the past month as the stock pushes toward its 52-week high of $67.45 on above-average volume of 22.18 million shares versus a 20-day average of about 23.08 million.[2] The move leaves OXY trading well above its 50-day moving average of $52.77, a sign of a firm uptrend heading into the midterm-year seasonal window.
In late 2025, Occidental’s strategic pivot around its OxyChem petrochemical unit was a major focus for investors, with multiple reports detailing talks and then a sale agreement with Berkshire Hathaway valued near $10 billion, aimed at debt reduction and a sharper focus on core oil and gas operations.[1][3][4][5][6] Those transactions and discussions, while dated, framed OXY as a balance-sheet repair story tied closely to oil price swings and capital discipline rather than pure production growth.
Macro conditions remain central. Oil market dynamics, including OPEC+ output decisions, have the potential to pressure crude prices and, by extension, Occidental’s revenue base, even as the company leans on asset sales and cost control to support margins.[2] Sector analysts have also highlighted that a stronger balance sheet from divestitures could give OXY more flexibility on buybacks and dividends in future cycles, which can matter for how the stock trades into historically strong seasonal windows.[1][2]
The chart below situates the latest move in its recent multi-month context alongside a 60-day seasonal projection.
What should traders watch as this OXY seasonal window opens?
As Apr. 11 approaches, the key watchpoint is whether OXY can hold above its 50-day moving average and continue to trade in the upper band of its 12-month range while the seasonal window is active.[2] A pattern-consistent year would likely feature OXY staying bid or grinding higher through the 22-day stretch, even if intraday swings remain sharp.
Macro catalysts will matter. Any fresh signals from OPEC+ on production, or shifts in demand expectations tied to global growth, could either reinforce or overwhelm the historical seasonality for energy stocks.[2] Traders will also be watching for updates on Occidental’s capital allocation and balance-sheet strategy in the wake of its petrochemical divestiture, since a clearer path on debt and shareholder returns has previously influenced how the stock trades around strong seasonal windows.[1][3][4][5]
Inside the window, behavior around pullbacks will be telling. In prior midterm years, some of the best outcomes still included mid-window drawdowns of several percentage points before rallies resumed. If OXY sells off sharply and fails to recover during the 22-day stretch, that would mark a clear break from the historical pattern. If instead dips are bought and the stock finishes the window higher, it would extend a 9-for-10 record that has quietly defined this slice of the calendar for Occidental Petroleum.
Sources
- Seeking Alpha: Berkshire Hathaway nears $10B deal for Occidental's petrochem unit - WSJ (Sep. 30, 2025)
- Forbes: Time To Buy Occidental Petroleum Stock? (Oct. 8, 2025)
- Reuters: Occidental to sell OxyChem unit to Berkshire for $9.7 billion (Oct. 2, 2025)
- Reuters: Berkshire in talks for $10 billion deal for Occidental's petrochemical unit (Sep. 30, 2025)
- Reuters: Occidental in talks to sell OxyChem unit for at least $10 billion (Sep. 28, 2025)
- CNBC: Stocks making the biggest moves premarket: Occidental Petroleum, Lithium Americas, Fair Isaac & more (Oct. 2, 2025)
About this seasonal analysis
Seasonal pattern data is sourced from TradeWave.ai, which analyzes historical price behavior across annual calendar windows going back up to 30 years. Read the full data methodology or the book The 100-Year Pattern by Afshin Moshrefi (2026 edition). Past performance of seasonal patterns does not guarantee future results. This article is for informational purposes only and does not constitute investment advice.