Gap Inc. (GAP) Faces Tariff Hit to Margins as Historically Weak Spring Window Opens
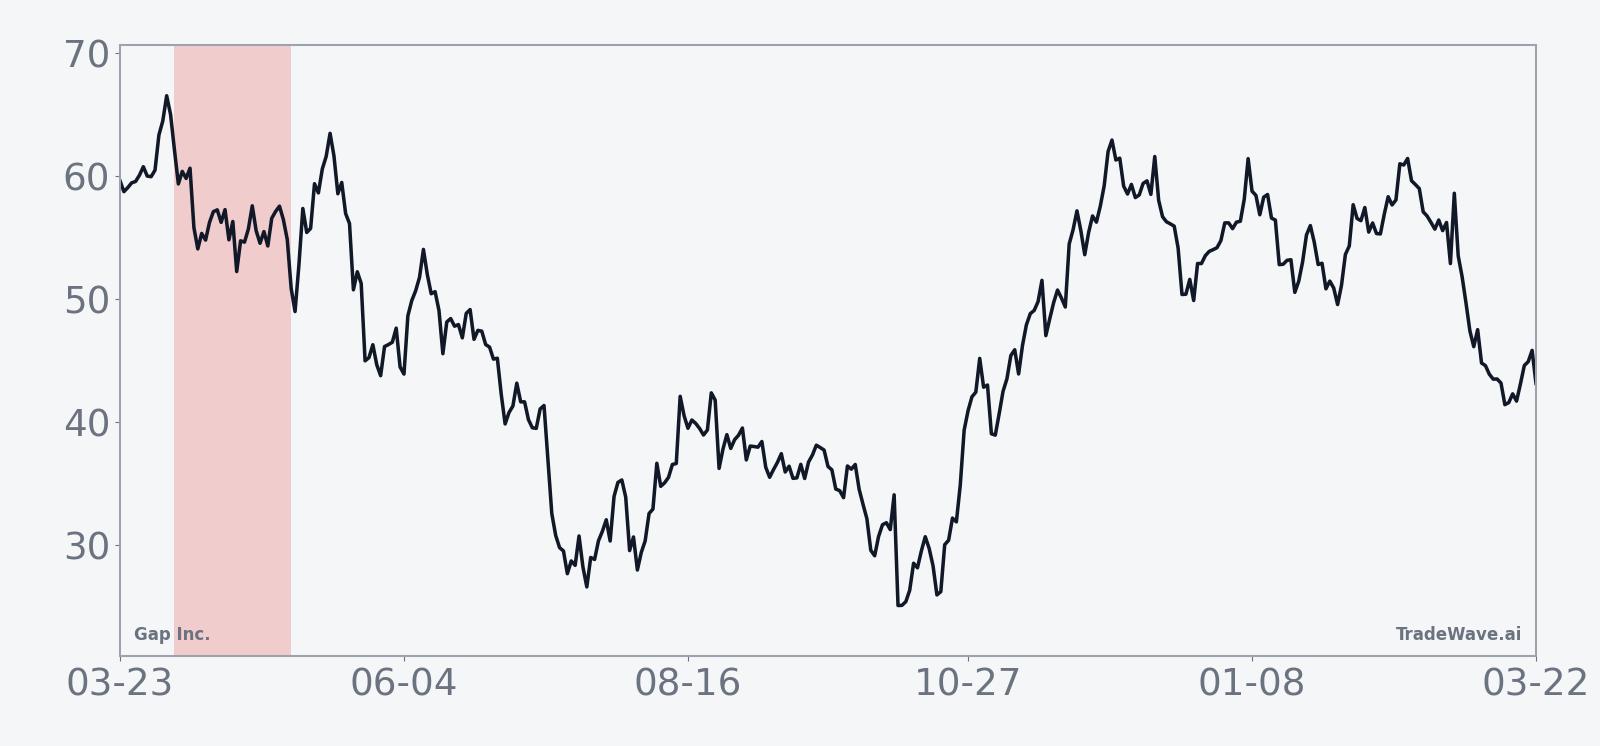
Gap Inc. is heading into a historically weak 31-day midterm-year window just as the stock trades well below its recent peak and investors digest tariff and demand headwinds.

What is the seasonal pattern for Gap Inc. (GAP)?
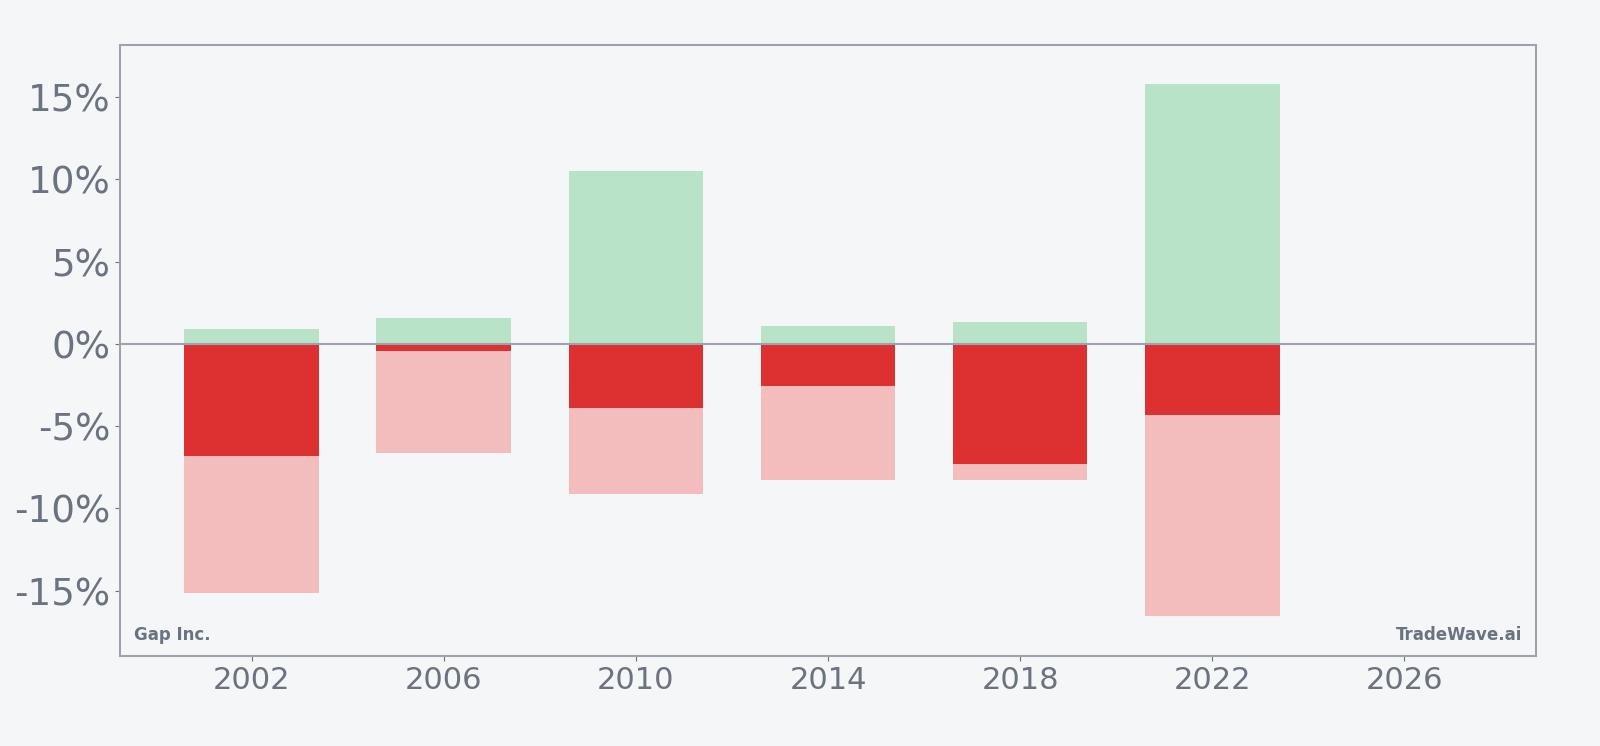
Gap Inc. has fallen in 6 of 6 midterm-year spring windows starting around Apr 6, with an average 4.22% gain for short positions in winning years.
- 6 for 6 in this window for shorts, with average winning trades returning 4.22% over 31 days.
- The upcoming pattern runs from Apr 6 for 31 trading days and has historically favored downside in Gap Inc. during midterm election years.
- Percent Profitable is 100%, with 6 winners and 0 losers across the last six midterm-year cycles.
- The trade direction is short, meaning prior windows have typically rewarded positioning for Gap Inc. to drift lower rather than rally.
- Intraperiod swings have been sharp, with some years showing double-digit peak drawdowns before the trade ultimately worked in favor of shorts.
- Across all six cycles, cumulative returns for the short pattern total 27%, with a Sharpe ratio of 1.5 and a TradeWave Ratio of 2.52.
According to historical data from TradeWave.ai, this specific midterm-year spring stretch has behaved very differently from an average month on the calendar for Gap Inc., and the next iteration begins in a matter of days.
How has Gap Inc. (GAP) traded in this midterm-year spring window?
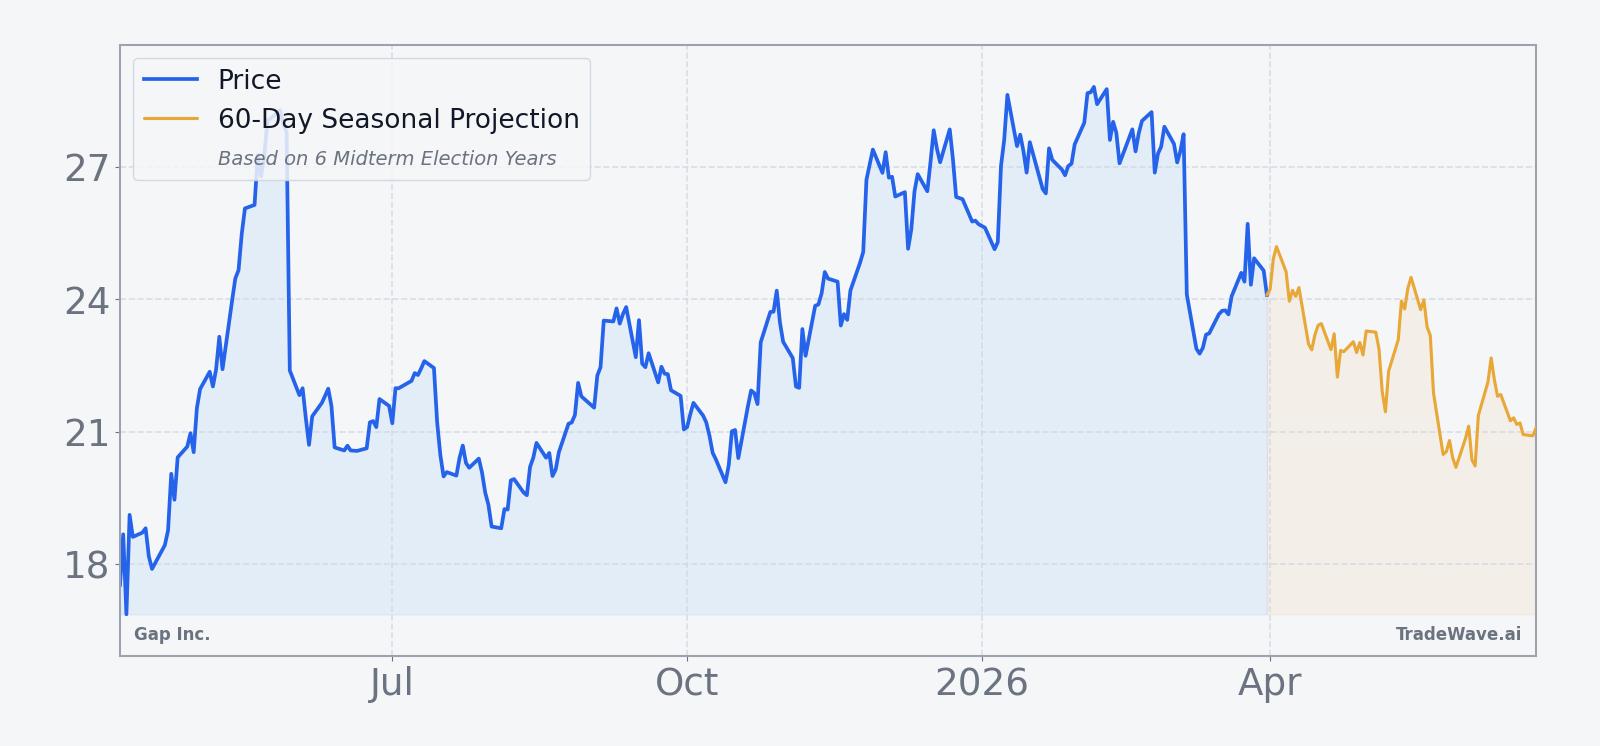
Grouping by the presidential election cycle shows that midterm-year springs have been a consistent trouble spot for Gap Inc., with shorts winning in every one of the last six cycles. The new 31-day window begins on Apr 6 and arrives with the stock at $24.20, about 17.6% below its 52-week high of $29.36 and after a rough month that saw shares drop 11.19%.
This seasonal window begins on Apr 6 and spans 31 trading days, covering the early part of the midterm election year when policy noise and consumer-spending worries often collide for retailers. Historically, during this period, Gap Inc. has shown a clear downside bias that aligns with a short trade direction rather than a long one.
Across the last six midterm election years, every single instance of this window has ended with Gap Inc. lower, which translates into a 100% success rate for short positions, with 6 winners and 0 losers. Average profit for those winning shorts is 4.22%, while the median outcome is close at 4.1%, suggesting the pattern is not being skewed by just one outlier year.
The per-year record shows how this plays out in practice. In 2002, a short entered at $8.79 and exited at $8.19, a net return of 6.83% for the short, even though the stock briefly moved 0.89% against the position and at one point traded 15.12% in favor of the short before bouncing. In 2022, the short window captured a 4.3% gain from $11.31 to $10.83, but that year also featured a 15.8% best intraperiod move in favor of the short and a 16.52% worst drawdown against it, underscoring how volatile this slice of the calendar can be.
Those intraperiod swings are captured in two key measures. The maximum favorable excursion, or MFE, is the best point-to-peak move in the trade direction during the window, while the maximum adverse excursion, or MAE, is the worst drawdown from the entry price before the trade is closed. In Gap Inc.’s case, several years show double-digit MFE and MAE values, which means shorts have often seen both meaningful rallies against them and sizable drops in their favor inside the same 31-day stretch.
The TradeWave Ratio (TWR) for this pattern is 2.52, which describes how far price typically travels in the trade direction within the window, independent of the final close. Combined with a Sharpe ratio of 1.5 based on end-of-window outcomes, the statistics point to a pattern that has historically delivered consistent net gains for shorts but with enough volatility to punish poor timing.
Trend metrics inside the window lean heavily toward the short side. Across the lookback, the pattern logged 36 trend-short days versus just 4 trend-long days, and in the more recent subset that ratio widened to 44 short-trend days versus 1 long-trend day. That skew suggests that once the window opens, down days have tended to cluster, even if there are occasional sharp countertrend rallies.
The cumulative return profile across all six midterm-year windows adds another layer. When you stack the windows on top of each other, the average path shows losses for Gap Inc. building gradually rather than in a single air pocket, with the bulk of the short-side gains accruing in the middle of the 31-day span. Add it up and the cumulative return for the short pattern is 27% across the six cycles, which is a meaningful drag for a single recurring calendar slice.
A second view combines net results with the best and worst intraperiod swings to show how far Gap Inc. has tended to travel in both directions during this window.
History does not guarantee future results, and even in a window with a perfect track record for shorts, adverse excursions can be large before the trade moves in the historical direction.
Why does Gap Inc. (GAP) follow this seasonal pattern?
One likely driver is the way the retail earnings calendar lines up with the political cycle. Early in midterm election years, Gap Inc. is often digesting holiday and early-spring results just as tariff headlines, consumer-confidence jitters and inventory resets hit, which can pressure margins and sentiment at the same time.[4][5][6] This pattern may also reflect institutional portfolio repositioning away from discretionary names in the first half of midterm years, when policy uncertainty and rate debates tend to be elevated.
What is driving Gap Inc. (GAP) today?
Gap Inc. shares closed at $24.20 on Apr 1, up 1.55% on the day, after trading between $23.80 and $24.73 on volume of about 7.6 million shares, below the 20-day average of roughly 9.7 million. The stock is about 17.6% below its 52-week high of $29.36 and still well above its 52-week low near $15.98, leaving it in the middle of its recent range after a 11.19% slide over the past month.
The latest leg of weakness followed Gap’s Mar 6 report of fourth-quarter earnings that missed Wall Street’s profit expectations by a penny a share, even as revenue landed in line at $4.24 billion.[1] Shares dropped 8% in the immediate aftermath as investors focused on softer margins and the lingering impact of tariffs on profitability, a concern that management has flagged as a 100 to 110 basis-point drag on annual operating margin.[1][6] A subsequent analysis on Mar 9 highlighted how the post-earnings slide came on heavy trading volume, underscoring how quickly sentiment can swing in this name when results disappoint.[3]
Those pressures build on a longer stretch of mixed fundamentals. In Nov 2025, Gap beat quarterly sales and profit estimates on the back of marketing-driven demand at Old Navy and its namesake brand, but by Aug 2025 the company was warning that soft apparel demand and tariffs were weighing on sales and margins, particularly at Athleta.[4][5] Management has guided to a 100 to 110 basis-point tariff hit to annual operating margin and has had to balance that against promotional activity to keep traffic flowing, a tricky setup for a mall-heavy retailer in a choppy consumer environment.[5][6]
Analysts have been trying to look through the noise. In Jan 2026, UBS reiterated a bullish stance and a $41 price target, arguing that improving Athleta sales and better inventory discipline could support more than 50% upside from then-current levels, although that target reflects a more optimistic regime than the one investors are trading against after the March earnings stumble.[2] The combination of a constructive longer-term view and a fragile near-term margin story is part of what makes the upcoming seasonal window so interesting: the historical pattern has favored shorts at precisely the moment when fundamental narratives tend to be in flux.
The chart below situates the latest move in its recent multi-month context and overlays the next 60 days of seasonal tendencies.
What should traders watch as this Gap Inc. seasonal window opens?
First, the calendar. The 31-day midterm-year spring window starts on Apr 6, so price action in the days immediately before and after that date will show whether Gap Inc. is respecting its historical tendency to drift lower or trying to break the pattern. A firm push back toward the $26 to $27 area early in the window would mark a clear departure from the typical path, while renewed selling that keeps the stock pinned below its 50-day moving average near $26.34 would be more in line with past cycles.
Second, the macro and policy backdrop. Any fresh headlines on tariffs or trade policy that alter the expected 100 to 110 basis-point margin drag could quickly change how investors value Gap’s earnings power, especially in a midterm election year when trade and consumer issues often move to the front of the political agenda.[5][6] Retail demand data, including monthly sales reports and commentary from peers, will also matter, since the last few quarters have shown how sensitive Gap’s traffic and pricing power are to shifts in discretionary spending.[4][5]
Third, volume and reaction around the next fundamental catalyst. The March selloff came on heavy trading as investors digested the Q4 miss, and any similar spike in activity during this window would be a sign that institutions are again using the period to reset positions.[1][3] If downside days arrive on rising volume while rallies look thin, that would rhyme with the historical pattern of short-friendly trends dominating this stretch. Conversely, a series of strong up days on solid volume would be an early signal that the 6-for-6 record for shorts is facing a real test.
Finally, traders should keep an eye on how Gap Inc. trades relative to the broader retail group. If the stock underperforms peers during the window, it would reinforce the idea that company-specific issues like tariffs, brand mix and inventory are driving the seasonal weakness. If it moves in line with or better than the sector despite the historical pattern, that would suggest the market is starting to price in a cleaner story for margins and demand than the last few quarters have delivered.
Sources
- [1] CNBC, "Stocks making the biggest moves premarket: Oil stocks, Gap, Marvell Technology, Samsara and more" (Mar 6, 2026)
- [2] CNBC, "Gap shares can rally more than 50% as Athleta sales improve, says UBS" (Jan 8, 2026)
- [3] Forbes, "Why Is GAP Stock Sliding?" (Mar 9, 2026)
- [4] Reuters, "Gap beats quarterly sales, profit estimates on marketing-driven demand" (Nov 20, 2025)
- [5] Reuters, "Gap misses quarterly sales estimates on soft apparel demand, warns of tariff hit" (Aug 28, 2025)
- [6] Reuters, "Gap forecasts weaker annual margin growth amid tariff concerns, shares fall" (Aug 28, 2025)
About this seasonal analysis
Seasonal pattern data is sourced from TradeWave.ai, which analyzes historical price behavior across annual calendar windows going back up to 30 years. Read the full data methodology or the book The 100-Year Pattern by Afshin Moshrefi (2026 edition). Past performance of seasonal patterns does not guarantee future results. This article is for informational purposes only and does not constitute investment advice.