Allstate (ALL) Has Risen in 6 of 7 Midterm Spring Windows, Averaging 4.78% Gains
Allstate is trading just below record highs as it approaches an 18-day midterm-year spring window that has historically skewed bullish for the stock.

What is the seasonal pattern for Allstate (ALL)?
Allstate has risen in 6 of 7 midterm-year spring windows during this 18-day pattern, with an average gain of 4.78% in winning years.
- 6-for-7 record in this window, with winning years averaging 4.78% gains and a 31% cumulative return across the sample.
- Percent Profitable is 86%, with 6 winners and 1 loser across the last seven midterm election years in this April window.
- The all-years average outcome, including the lone losing year, is still a solid 4% gain, pointing to a consistently positive ALL seasonal trend.
- The upcoming 18-day Allstate trading window starts Apr 2 and sits in the early part of the midterm election year, a phase that often sees sector rotation and policy repricing.
- Historical intraperiod swings show modest worst drawdowns compared with upside runs, with the TradeWave Ratio at 2.59 and a Sharpe ratio of 1.57 for this setup.
- Maximum favorable moves in strong years have topped 9%, while the single losing year saw only a shallow final decline, underscoring a historically supportive but not risk-free window.
According to historical data from TradeWave.ai, this specific midterm-year spring stretch has behaved differently from an average month for Allstate, and the next iteration is about to open.
How has Allstate (ALL) traded in this midterm-year spring window?
Allstate has risen in 6 of the last 7 midterm election years during this 18-day spring window, averaging 4.78% gains in the winning runs. The new window begins on Apr 2, just as shares change hands at 207.27, up 2.2% on the day and about 4.4% below the 52-week high of 216.75.[1] For a stock already near record territory, that combination of a historically bullish April pattern and elevated price makes this slice of the calendar hard for traders to ignore.
The pattern is built on the last seven midterm election years, so it lines up with the same phase of the presidential cycle that markets are entering now. Grouping by election cycle matters for a property-casualty insurer like Allstate because midterm years often bring regulatory noise, rate debates and shifting expectations for consumer balance sheets, all of which can change how investors price financials in the spring.
Historically, the trade direction for this window has been long. Percent Profitable sits at 86%, with six winning years and just one losing year, and the all-years average outcome is a 4% gain despite that lone down period. The median result is a 4.57% rise, which lines up closely with the 4.78% average gain in winning years, suggesting the bullish outcomes have been relatively clustered rather than driven by a single outlier.
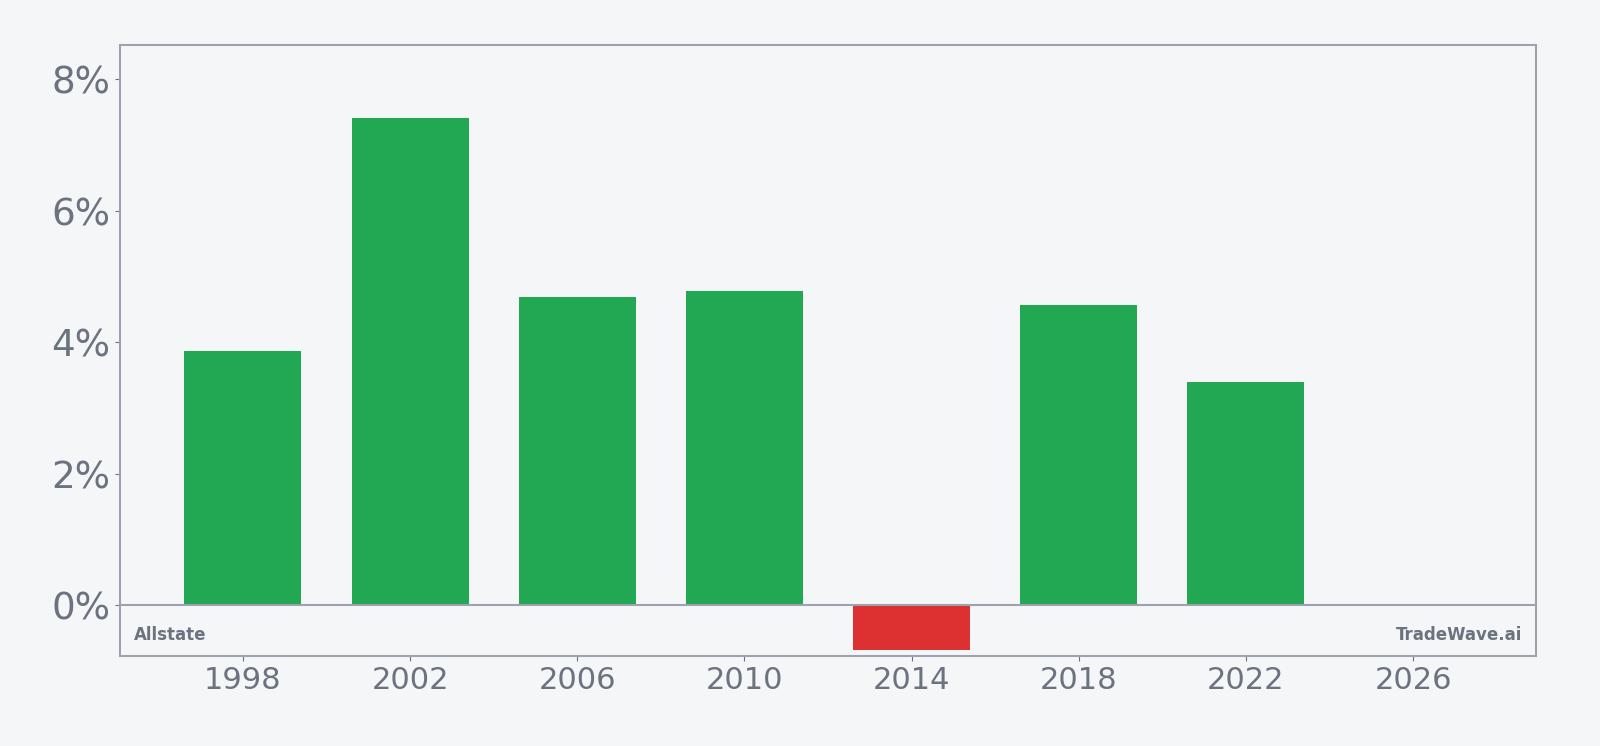
Looking at individual years, 2002 stands out as the strongest run, with Allstate gaining 7.41% from entry to exit and posting a maximum favorable move of 9.16% inside the window. The weakest outcome came in 2014, when the stock finished the stretch down 0.68% after a modest 2.01% peak run-up and a worst drawdown of 2.39%. Add it up and the cumulative return across all seven midterm-year windows is 31%, which is a meaningful contribution for a slice of the calendar that spans just 18 trading days each cycle.
The historical seasonal average trend for this window shows gains building steadily rather than spiking in a single day. In prior midterm years, the typical pattern has been a firm start, a brief mid-window pause, and then additional upside into the final days, which fits a narrative of investors gradually adding exposure rather than chasing a one-off headline.
A closer look at yearly net returns alongside peak run-ups and worst drawdowns shows how upside and downside have traded off inside the window.
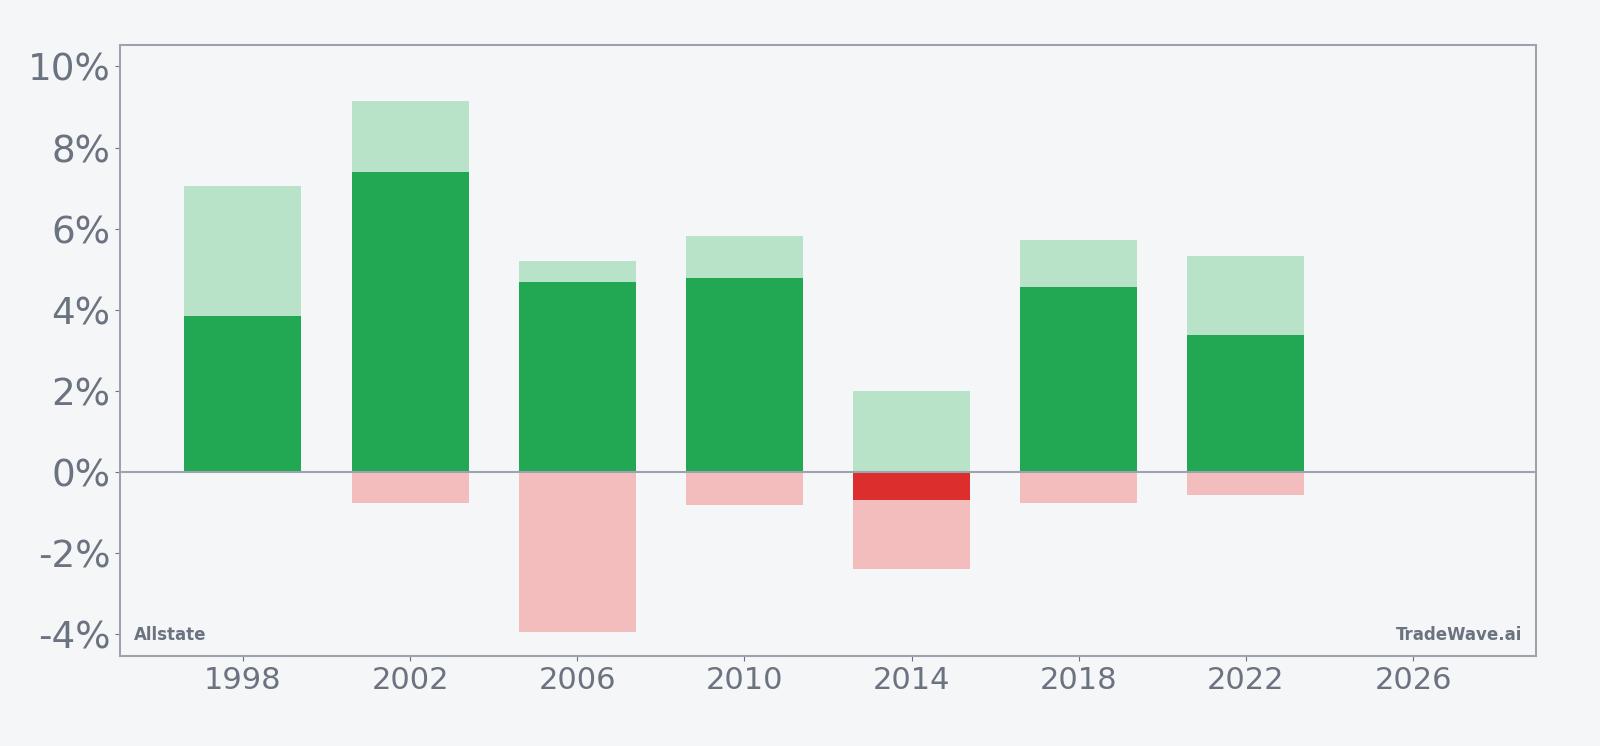
The stacked net, maximum favorable move and maximum adverse move profile shows that upside has generally outweighed downside without requiring traders to stomach extreme drawdowns. In the strongest years, Allstate’s best intraperiod rallies have run between about 5% and 9%, while the worst drawdowns have mostly stayed inside a roughly 4% pocket, with 2006 the only year where the adverse move approached that level. That balance is reflected in a TradeWave Ratio of 2.59 and a Sharpe ratio of 1.57, which together point to a historically efficient long setup rather than a lottery-ticket spike.
History does not guarantee future results, and even in winning windows the worst intraperiod drawdowns (MAE) can be uncomfortable for traders who are overleveraged or too tightly risk-managed.
Why does Allstate (ALL) follow this seasonal pattern?
One likely driver is the way Allstate’s earnings calendar and guidance cadence line up with the midterm-year policy backdrop. Property-casualty insurers often see investor attention pick up around spring as management teams update loss trends, pricing power and capital return plans, and in midterm years that can intersect with shifting expectations for regulation and consumer credit. This pattern may also reflect institutional portfolio repositioning into financials and insurance as investors rebalance after first-quarter macro data and adjust risk ahead of the heavier political news flow later in the year.
What is driving Allstate (ALL) today?
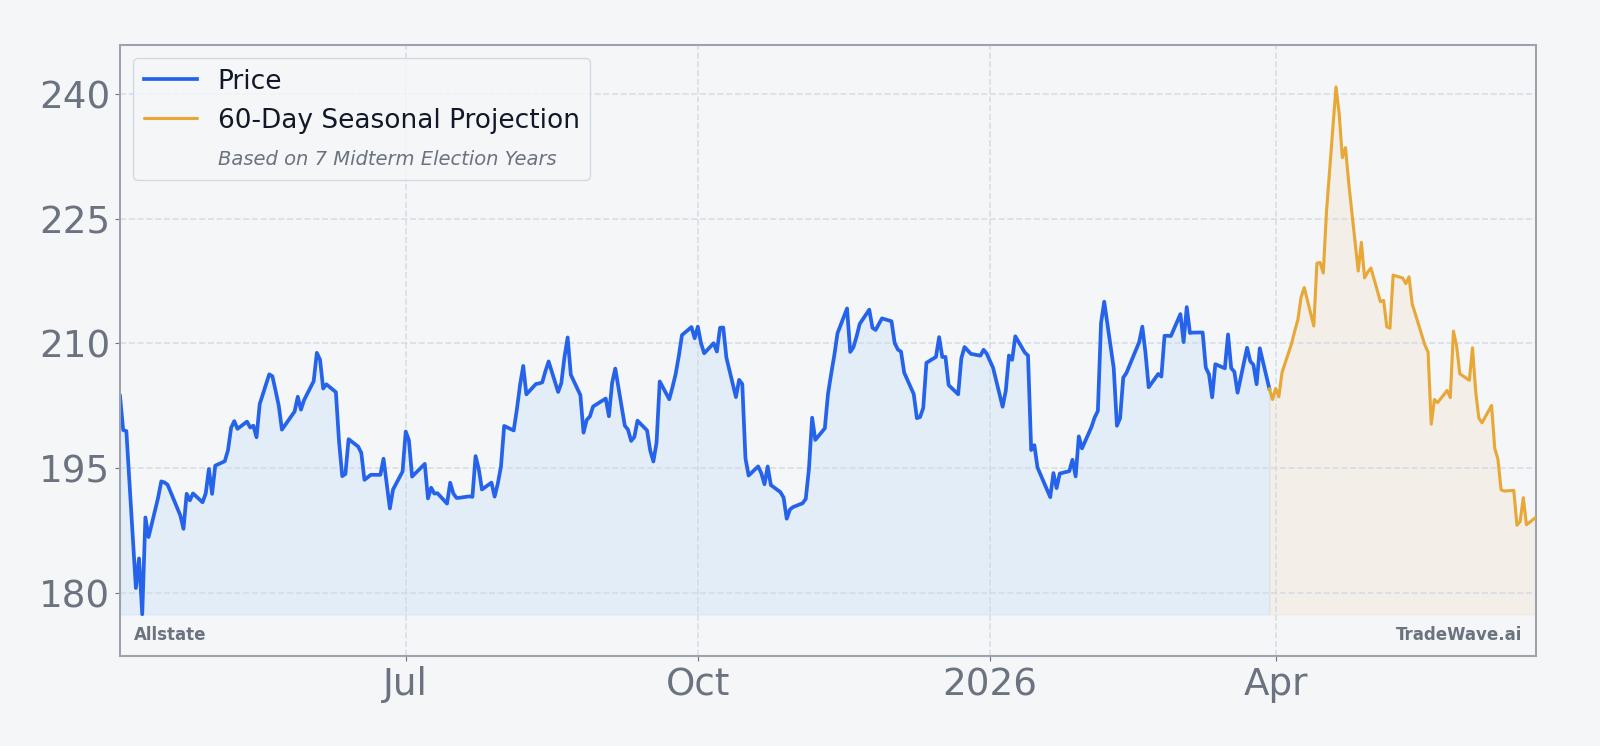
Allstate shares closed at 207.27 on Mar 31, up 2.2% on the session, with intraday trading between 203.42 and 209.05 on volume of about 1.1 million shares.[1] The stock sits roughly 4.4% below its 52-week high of 216.75 and well above the 50-day moving average of 205.05, with the 20-day average volume near 1.4 million shares, signaling a steady uptrend rather than a thinly traded spike.[1] The latest leg higher comes against a backdrop of sharply improved earnings expectations, with Zacks reporting in Nov 2025 that its consensus estimate for Allstate’s current-year earnings had climbed 29.9% over the prior 60 days, helping underpin a Strong Buy rating for the insurer.[1]
The chart below situates the latest move in its recent multi-month context and overlays a 60-day seasonal projection.
What should traders watch in this Allstate (ALL) seasonal window?
For this 18-day stretch starting Apr 2, the first thing to watch is whether Allstate respects the historical pattern of early strength followed by a steady grind higher. A firm tone in the opening days, with pullbacks contained near the 50-day moving average around 205, would be consistent with prior midterm-year windows, while a quick break below that level would signal a departure from the usual script.
Second, the intraperiod swings matter as much as the final outcome. In past cycles, maximum favorable moves have often reached the mid-single digits without forcing traders to sit through deep drawdowns, so a rally that stalls well short of that range or a sudden 4% to 5% air pocket would both be signs that this iteration is behaving differently from the historical Allstate seasonal pattern.
Finally, keep an eye on the broader policy and rate backdrop as the midterm election year unfolds. Any shift in expectations for regulation, catastrophe exposure or consumer credit quality could either reinforce or overwhelm the usual April tailwind for property-casualty names. If Allstate can hold near its highs while delivering another mid-single-digit gain across the window, it would extend a 6-of-7 track record into an even more compelling seasonal trend; if the stock instead chops sideways or breaks lower, traders will have a fresh data point that the midterm-year playbook for this insurer may be evolving.
Sources
About this seasonal analysis
Seasonal pattern data is sourced from TradeWave.ai, which analyzes historical price behavior across annual calendar windows going back up to 30 years. Read the full data methodology or the book The 100-Year Pattern by Afshin Moshrefi (2026 edition). Past performance of seasonal patterns does not guarantee future results. This article is for informational purposes only and does not constitute investment advice.