8-of-9 Midterm April Declines Make Cleveland-Cliffs (CLF) a Short-Side Target
Cleveland-Cliffs is climbing ahead of Q1 earnings even as it trades inside a midterm-year April window that has historically favored short-side setups and sharp swings.
What is the seasonal pattern for Cleveland-Cliffs (CLF)?
Cleveland-Cliffs has been profitable for short-focused traders in 8 of the last 9 midterm-year April windows, with average winning moves of 5.98%.
- 8 wins and 1 loss in this 14-day midterm-year April window, with short trades averaging 5.98% gains in winning years.
- Percent Profitable stands at 89%, with 8 winners and 1 loser across the last 9 midterm election years in this slice of the calendar.
- Including all years, the average outcome is a 4% move in the short direction, showing the impact of the lone losing year.
- The window runs from Apr 13 for 14 trading days, capturing a tight pre-earnings and early-spring stretch for the steel and mining name.
- Intraperiod swings have been meaningful, with both strong favorable runs and sizable drawdowns showing this is a high-volatility trading window.
- The pattern aligns with a midterm election-year backdrop, when industrial and materials stocks often see choppy positioning around policy and growth headlines.
According to historical data from TradeWave.ai, this midterm-year April stretch has behaved very differently from an average month for Cleveland-Cliffs. The next section walks through how that pattern has played out in prior cycles and what it means for the current window.
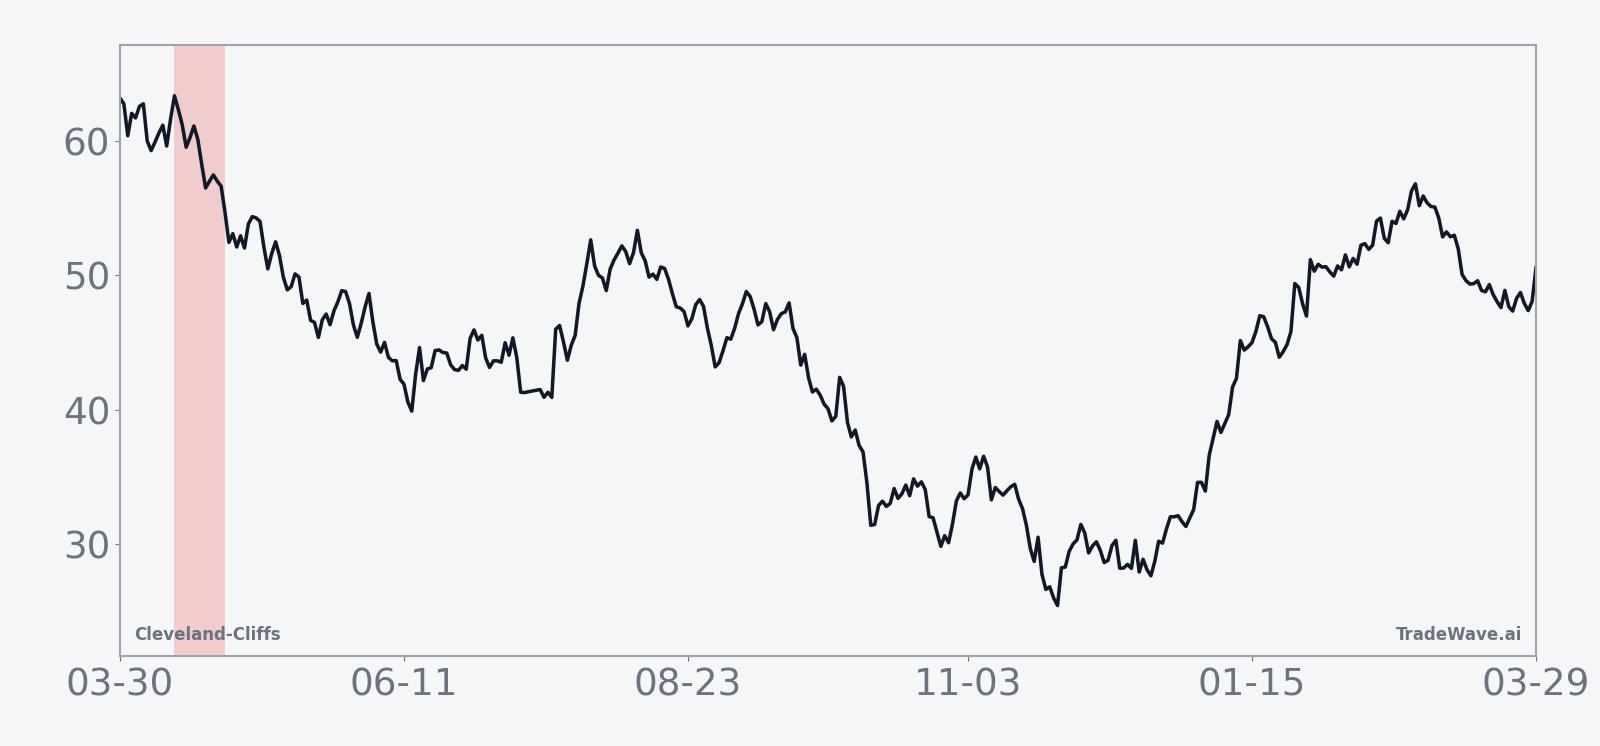
How has Cleveland-Cliffs (CLF) traded in this midterm-year April window?
Cleveland-Cliffs has delivered profitable short-side trades in 8 of the last 9 midterm election years during this 14-day April window, with winning years averaging 5.98% moves in the trade direction. The current window began on Apr 13 with the stock at 9.33, up 3.2% on the day and sitting well below its 52-week high of 16.70 and above its 52-week low of 5.63. That leaves CLF roughly 44.1% under its 52-week high and about 65.7% above its 52-week low, a wide band that underscores how much room the stock has to swing inside a historically active trading window.
This pattern is grouped by the presidential election cycle, focusing on the last 9 midterm election years rather than consecutive calendar years. That matters because midterm years often bring a distinct mix of policy uncertainty, infrastructure talk and rate expectations that can hit industrial and steel names differently than in election or pre-election years.
Year-by-year bars with both peak runs and worst drawdowns show how far CLF has tended to move inside this window.
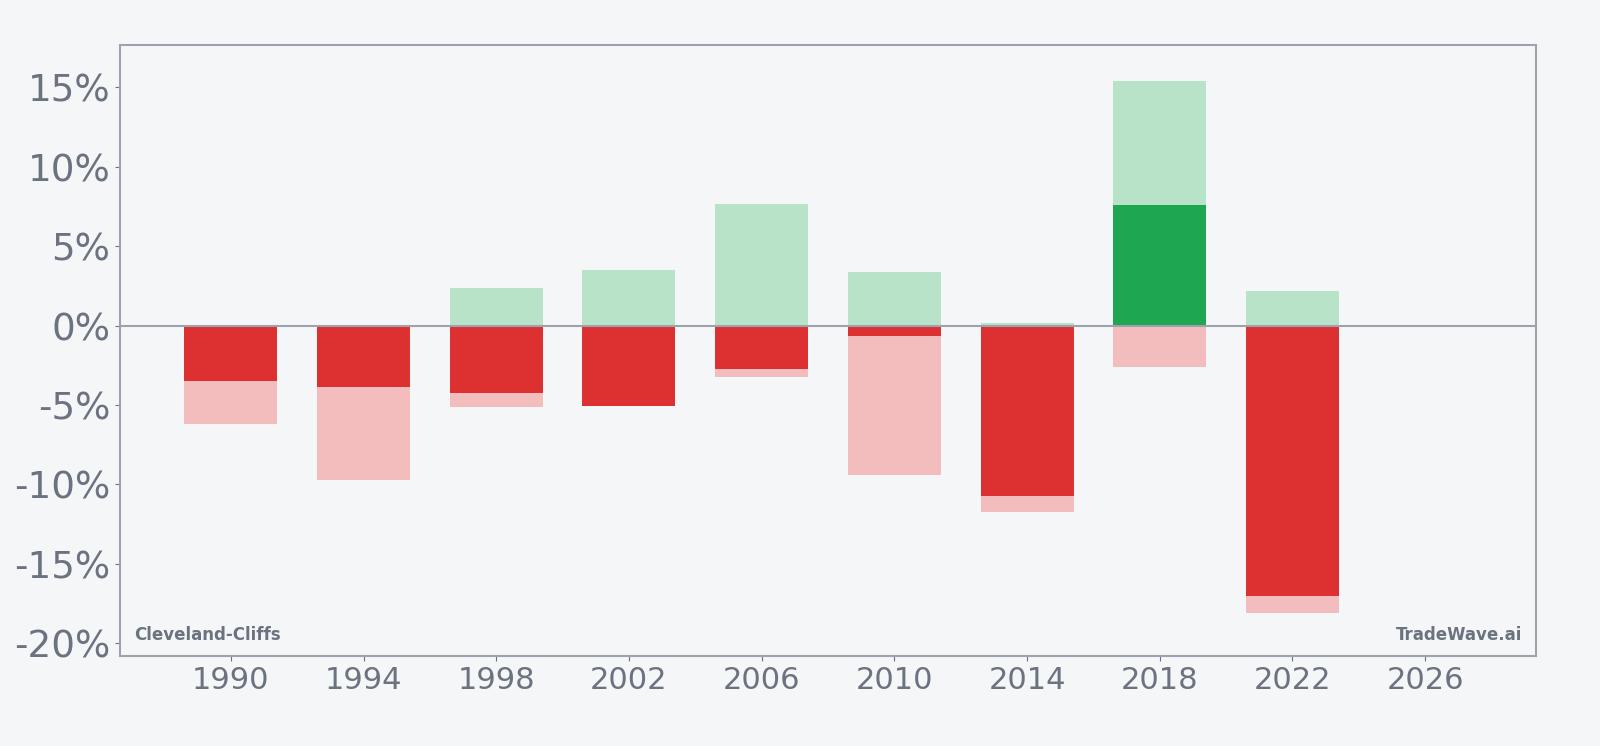
The trade direction for this pattern is short, so negative net returns are the “good” years for the setup and rallies are the outliers. Across the sample, 8 of 9 years finished with CLF lower at the end of the window, and the all-years average move of 4% in the trade direction shows that the lone losing year did not erase the broader tendency. The Sharpe ratio of 0.64 points to a positive but not extreme risk-adjusted profile based on end-of-window outcomes, while a TradeWave Ratio of 1.58 signals that price has typically traveled meaningfully in the trade direction inside the window, even when the final close did not capture the full swing.
Looking at individual years, the weakest outcome for shorts came in 2018, when CLF rallied 7.62% over the window and at one point was up 15.37% from the entry, a classic short-squeeze profile. On the other side, 2022 delivered a 17.05% net drop in the stock with a worst intraperiod drawdown of 18.11% from the entry, showing how quickly downside can build when the pattern lines up with broader selling pressure. Earlier midterm years such as 1994 and 2014 also saw double-digit or near double-digit adverse excursions at some point in the window, even though they ultimately finished as winning short trades.
The maximum favorable move and maximum adverse move history underlines that this is not a quiet drift. In several years, CLF first moved against the short trade by 5% to 10% before rolling over, while in others the stock dropped quickly and then bounced. That mix of sharp runs and deep counter-moves is what traders mean when they talk about a “high-variance” seasonal window.
History does not guarantee future results; adverse excursions can be large even in winning windows, and this pattern has included at least one year where shorts were squeezed hard before the window closed.
Why does Cleveland-Cliffs (CLF) follow this seasonal pattern?
One likely driver is the way midterm election years cluster policy headlines around infrastructure, tariffs and industrial spending, which can swing sentiment for steel and mining stocks in short bursts. Analysts have also pointed to portfolio repositioning around early-year earnings and guidance, when investors reassess demand for autos, construction and energy that feed into Cleveland-Cliffs’ order book. This April window may reflect that tug-of-war, with traders using it to reset exposure ahead of the heavier policy and macro calendar that tends to build later in the midterm year.
What is driving Cleveland-Cliffs (CLF) today?
Cleveland-Cliffs shares closed at 9.33 on Apr 14, up 3.2% on the day, extending a roughly 10.4% gain over the past month as the stock rebounds from a 52-week low of 5.63 but remains far below its 16.70 high.[2] Trading volume of about 7.5 million shares came in below the 20-day average of roughly 17.1 million, suggesting the latest bounce is more about steady buying than a full-blown rush into the name.[2] The move comes with Q1 2026 earnings due on Apr 20, when analysts expect an EPS loss of about 0.37 and revenue near 4.84 billion, a report that will test whether the recent recovery can hold against a still-choppy profit backdrop.[2]
In June 2025, MarketBeat reported that Cleveland-Cliffs had seen a significant increase in short interest alongside insider selling by an executive, a combination that left the stock sensitive to both squeezes and fresh downside when news hits.[8] Other institutional filings through mid-2025 showed a mix of new positions and increased stakes from asset managers, reinforcing the idea that CLF sits in the middle of an active tug-of-war between value buyers and macro bears.[3][4][5][6][7] Consensus from MarketBeat screens as a Hold with a 12.03 price target, modestly above today’s level and reflecting a market that sees room for recovery but is not ready to call a clean uptrend yet.[1][2]
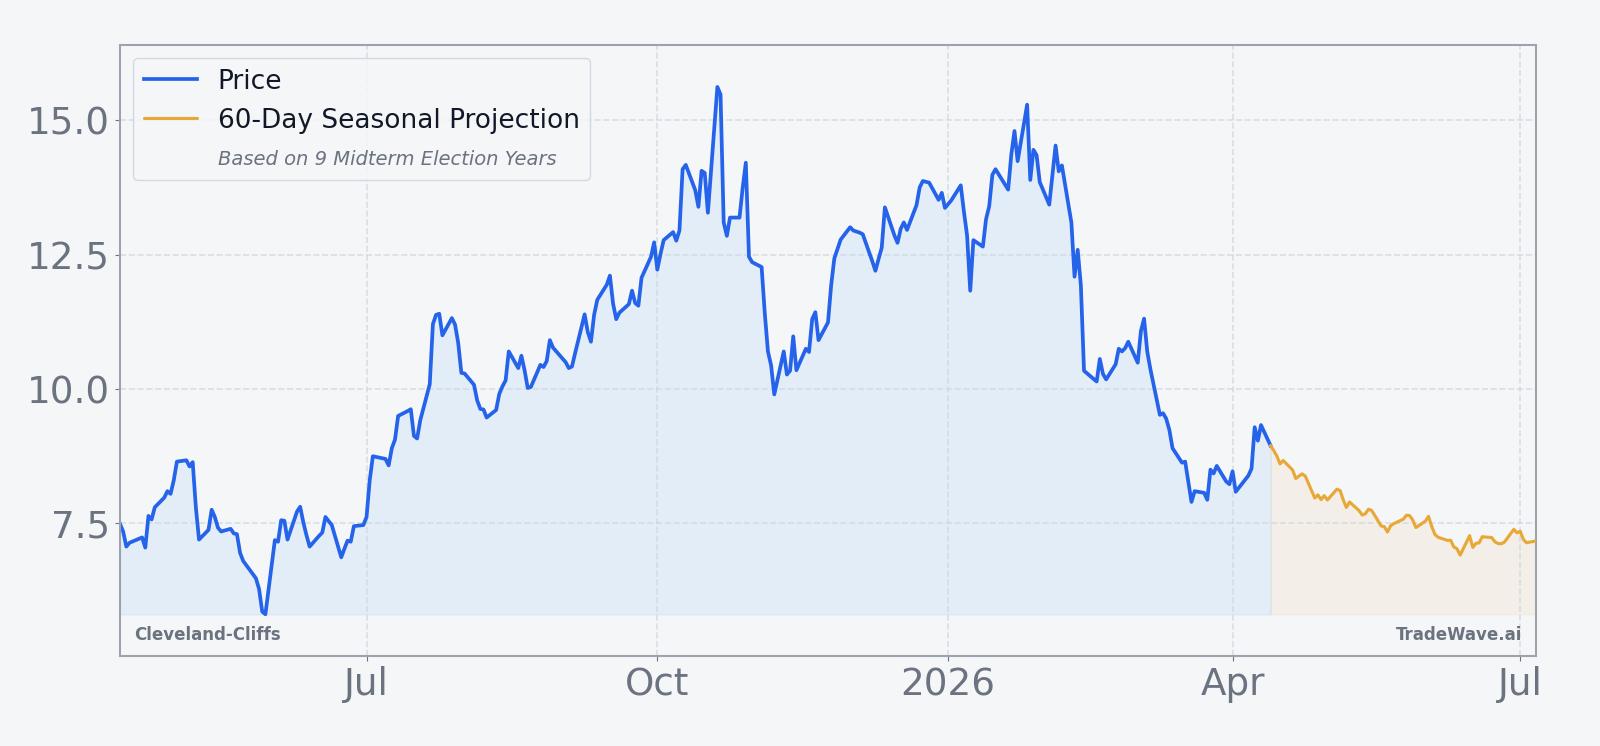
The chart below situates the latest move in its recent multi-month context and overlays a short-term seasonal projection.
What should traders watch in this Cleveland-Cliffs seasonal window?
The first checkpoint is Q1 earnings on Apr 20, which lands squarely inside the 14-day seasonal window and could either reinforce or overwhelm the historical short-side bias.[2] Traders will be watching whether CLF holds above the 50-day moving average around 10.17 or slips back toward the 9 level; behavior around those bands will show whether the recent bounce is gaining traction or fading.[2] A move that quickly retraces a chunk of the past month’s 10.4% gain would line up with the historical pattern of profitable short trades, while a sustained push toward the low teens would look more like the 2018-style squeeze year.
Positioning will also matter. If short interest, which climbed notably in mid-2025, starts to build again around earnings, any downside move could accelerate as the seasonal window progresses.[8] On the flip side, a visible reduction in short interest or a pickup in long-only institutional buying would suggest that the market is leaning against the historical pattern and betting on a more durable recovery. Add it up: this is a short, punchy window where policy noise, earnings and positioning often collide, and how CLF trades through late April will show whether the midterm-year seasonal script is still in play.
Sources
- MarketBeat: Cleveland-Cliffs (NYSE:CLF) Shares Up 3% - What's Next? (Jun 17, 2025)
- MarketBeat: Cleveland-Cliffs (CLF) to Release Earnings on Monday (Apr 13, 2026)
- MarketBeat: Triumph Capital Management Makes New Investment in Cleveland-Cliffs Inc. (NYSE:CLF) (Jul 27, 2025)
- MarketBeat: Drexel Morgan & Co. Increases Holdings in Cleveland-Cliffs Inc. (NYSE:CLF) (Aug 2, 2025)
- MarketBeat: GAMMA Investing LLC Has $582,000 Position in Cleveland-Cliffs Inc. (NYSE:CLF) (Jun 19, 2025)
- MarketBeat: Monaco Asset Management SAM Has $1.97 Million Stock Position in Cleveland-Cliffs Inc. (NYSE:CLF) (Jul 31, 2025)
- MarketBeat: Edgestream Partners L.P. Purchases New Shares in Cleveland-Cliffs Inc. (NYSE:CLF) (Jul 19, 2025)
- MarketBeat: Cleveland-Cliffs Inc. (NYSE:CLF) Sees Significant Increase in Short Interest (Jun 18, 2025)
- MarketBeat: Cleveland-Cliffs (NYSE:CLF) Stock Price Down 1.3% - Here's Why (Jul 12, 2025)
About this seasonal analysis
Seasonal pattern data is sourced from TradeWave.ai, which analyzes historical price behavior across annual calendar windows going back up to 30 years. Read the full data methodology or the book The 100-Year Pattern by Afshin Moshrefi (2026 edition). Past performance of seasonal patterns does not guarantee future results. This article is for informational purposes only and does not constitute investment advice.