Vulcan Materials Company (VMC) Has Gained in 10 of 10 April Windows, Averaging 5.31%
Vulcan Materials Company is approaching a 21-day April seasonal window that has never been negative in the past decade, even as the stock trades well below its 52-week high and faces policy risk around government spending.

What is the seasonal pattern for Vulcan Materials Company (VMC)?
Vulcan Materials Company has risen in 10 of 10 years during this April 21-day window, with an average gain of 5.31% in winning years.
- 10 for 10 in this window, with average gains of 5.31% across all winning years.
- The upcoming 21-day trading window starts Apr 13, 2026 and has been a consistently bullish VMC seasonal trend.
- Percent Profitable is 100%, with 10 winners and 0 losers over the past decade.
- Best single-year gain in the window was 10.91% in 2025, while the weakest was still positive at 0.26% in 2022.
- Intraperiod swings have been meaningful, with historical worst drawdowns inside the window reaching nearly 8% in some years.
- TradeWave Ratio of 3.22 and a Sharpe ratio of 1.49 point to a historically strong long-side seasonal setup.
According to historical data from TradeWave.ai, this mid-April stretch has behaved very differently from an average month on the calendar for Vulcan Materials Company. The next section looks at how that pattern has played out over the past decade and what it implies for the approaching window.
How has Vulcan Materials Company (VMC) traded in this April seasonal window?
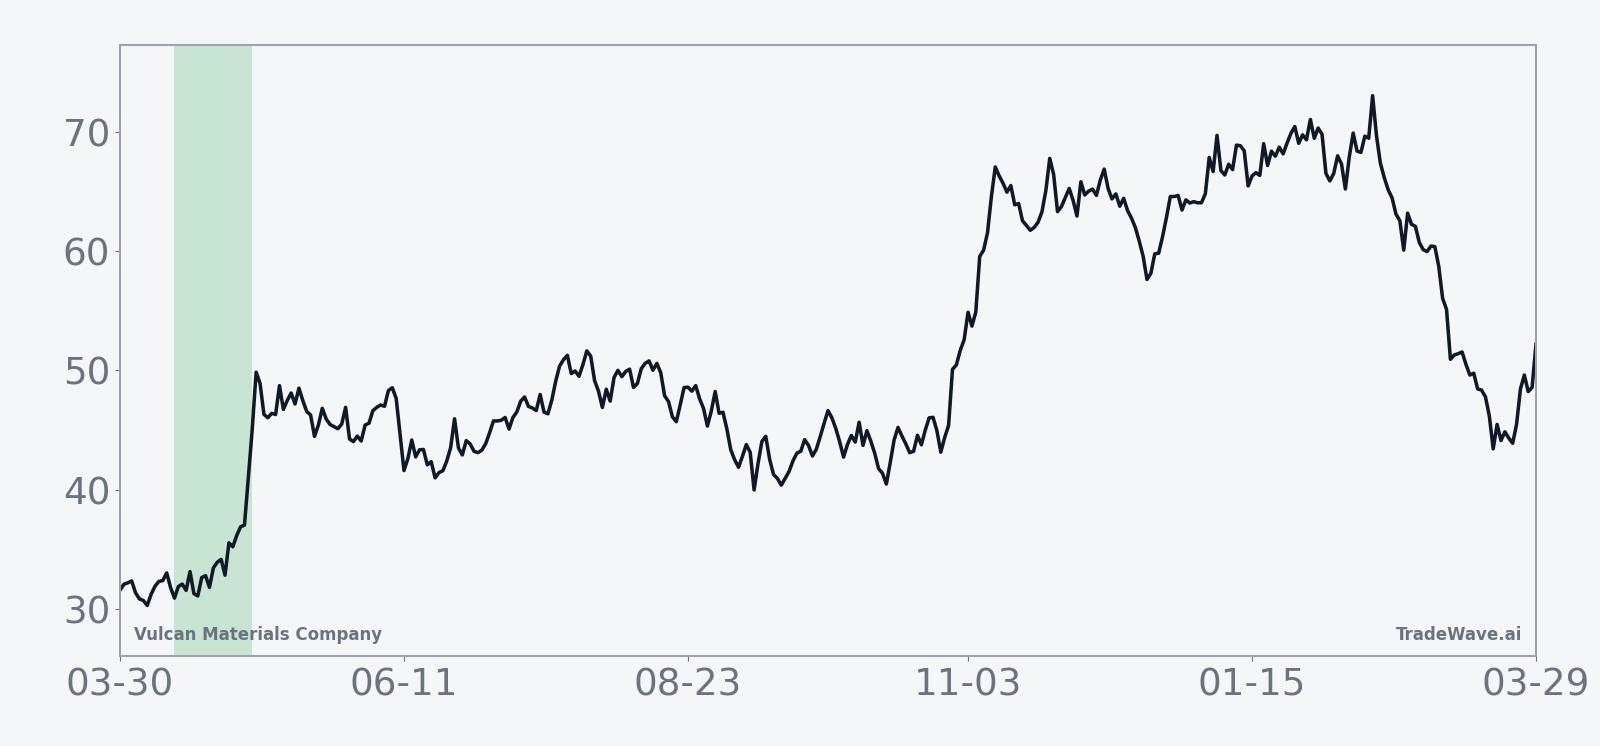
Vulcan Materials Company has posted gains in every one of the past 10 years during the 21 trading days starting Apr 13, averaging a 5.31% rise for long positions in this window. The stock last closed at 277.89, down 1.3% on the day and about 16.1% below its 52-week high of 331.09, leaving room above if the historical pattern repeats. That combination of a clean 10-for-10 record and a pullback from highs makes this upcoming construction-season window one of the more striking calendar patterns on the VMC tape.
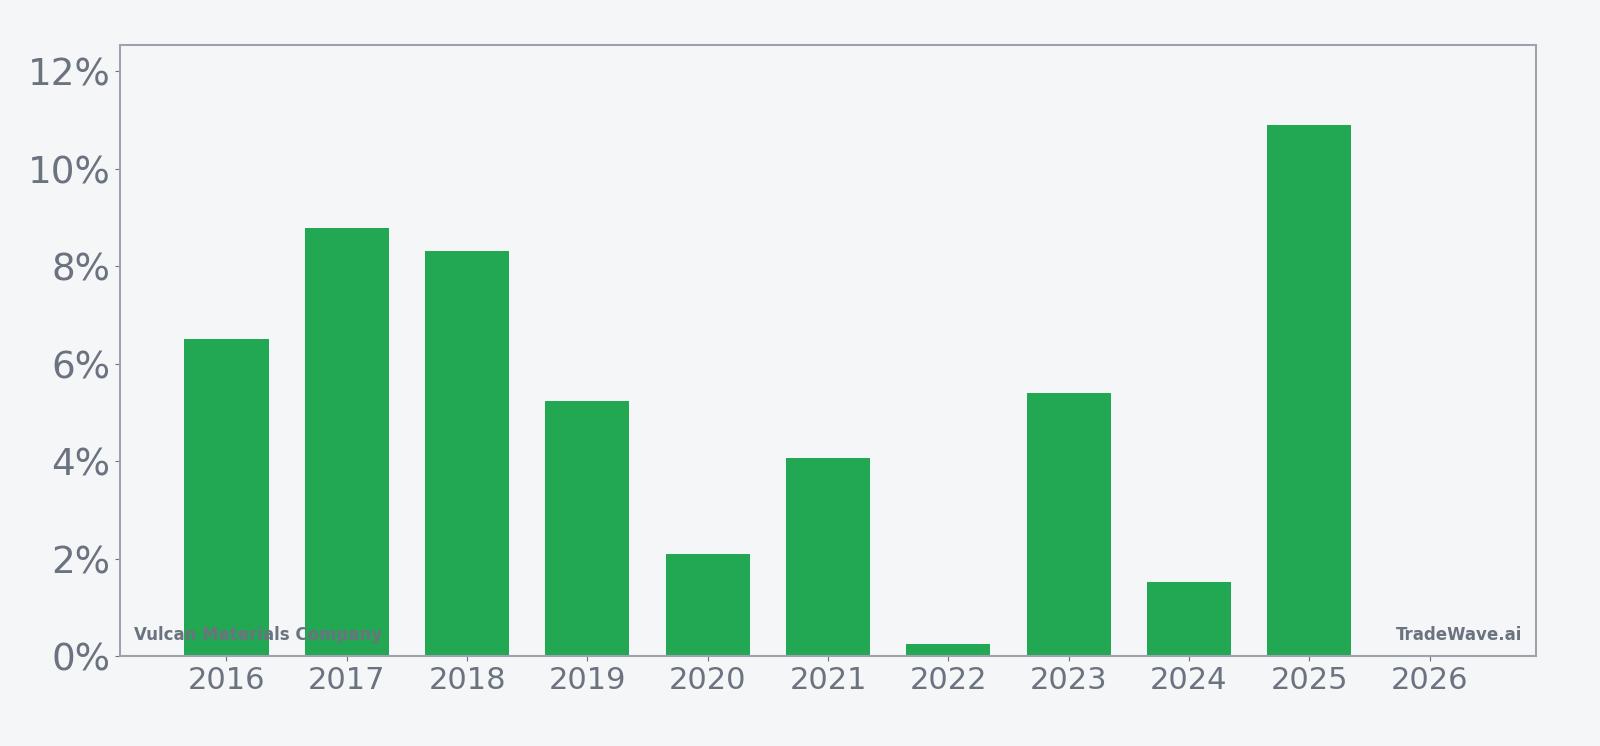
Across the 10-year sample, the trade direction is firmly long. Every iteration of this Vulcan Materials Company trading window finished in the green, from a modest 0.26% gain in 2022 to a double-digit 10.91% jump in 2025. Average profit of 5.31% means the typical winning year has delivered a mid-single-digit move over just three weeks, while the cumulative return across all windows clocks in at 67%.
The per-year table shows how that strength has clustered. In 2017, VMC gained 8.79% in the window, with a maximum favorable move of 10.28% before settling back, while 2018 delivered an 8.32% net return despite a mid-window drawdown of 4.11% from entry. Even the softer years have respected the bullish seasonal bias: 2020 only finished up 2.1%, but the stock still rallied as much as 7.71% at its best point in the window before giving back ground.
Intraperiod volatility has been real. The worst maximum adverse excursion was a 7.97% drawdown in 2020, and 2025 saw the stock drop as much as 4.81% below entry before closing the window with a 10.91% gain. That MAE profile means the pattern has rewarded patience historically, but it has not been a straight line higher.
The historical seasonal average trend suggests gains tend to build steadily through the middle of the window rather than spiking on day one. In several years, including 2016, 2019 and 2023, the strongest part of the move came after an early pause, with the stock grinding higher into the final week of the pattern. That shape fits a narrative of construction and infrastructure demand ramping as spring projects get underway.
A combined view of net returns, peak rallies and worst drawdowns shows how upside and downside have coexisted inside this bullish window.
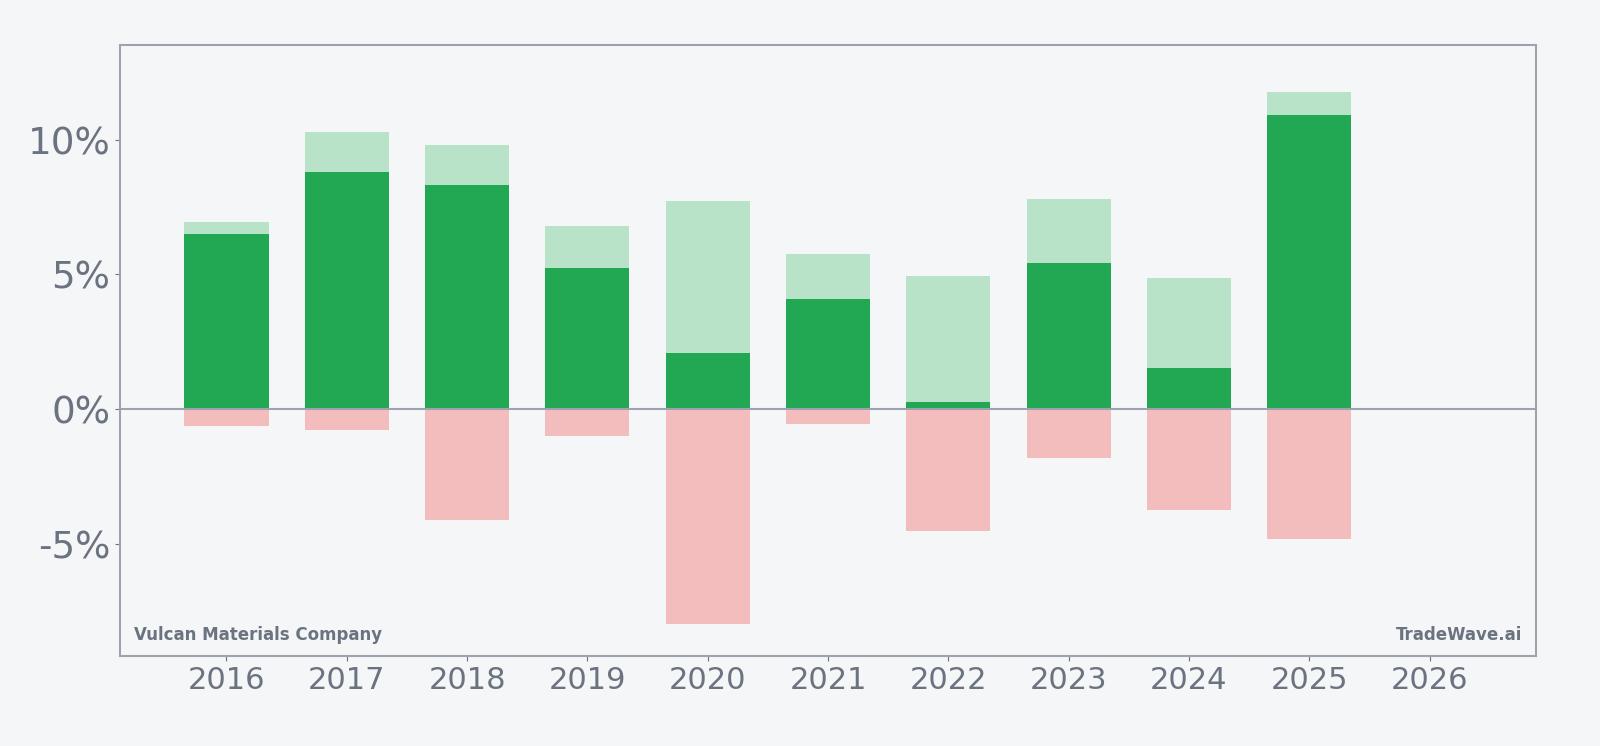
The stacked net, maximum favorable move and maximum adverse move bars underline the trade-off. In strong years like 2017 and 2025, the best intraperiod rallies pushed into double digits while the worst drawdowns stayed in the mid-single digits. In choppier years such as 2020 and 2022, downside excursions were larger relative to the final gain, showing that even a 100% win-rate pattern can feel uncomfortable in real time.
History does not guarantee future results; adverse excursions can be large even in winning windows, and past seasonal strength does not ensure similar outcomes in 2026.
Why does Vulcan Materials Company (VMC) follow this seasonal pattern?
One likely driver is the timing of construction and infrastructure spending, which tends to ramp in late spring as weather improves and projects move from planning to execution. Vulcan Materials Company, as a major aggregates and construction materials supplier, is tightly linked to that cycle, so orders and pricing power often firm up in this part of the year. The pattern may also reflect institutional portfolio positioning around the start of the U.S. construction season, when investors lean into materials names that benefit from public and private project pipelines.
What is driving Vulcan Materials Company (VMC) today?
Vulcan Materials Company shares closed at 277.89 on Apr 8, 2026, down 1.3% on the session and roughly 16.1% below the 52-week high of 331.09, after trading between 275.67 and 280.54 on volume slightly below its 20-day average of about 1.47 million shares. The stock has gained 1.28% over the past month, but the pullback from highs leaves it trading under its 50-day moving average of 290.99, a sign that momentum has cooled ahead of the key spring construction period.
Macro risk is the main fundamental overhang in the current setup. In Sep 2025, analysis flagged potential government spending cuts as a significant risk for Vulcan Materials Company, given its exposure to federally funded infrastructure and public works projects that drive demand for aggregates and asphalt.[1] Any renewed push to trim budgets or delay projects could weigh on volumes and pricing just as the seasonal window opens, even if the historical pattern has been favorable.
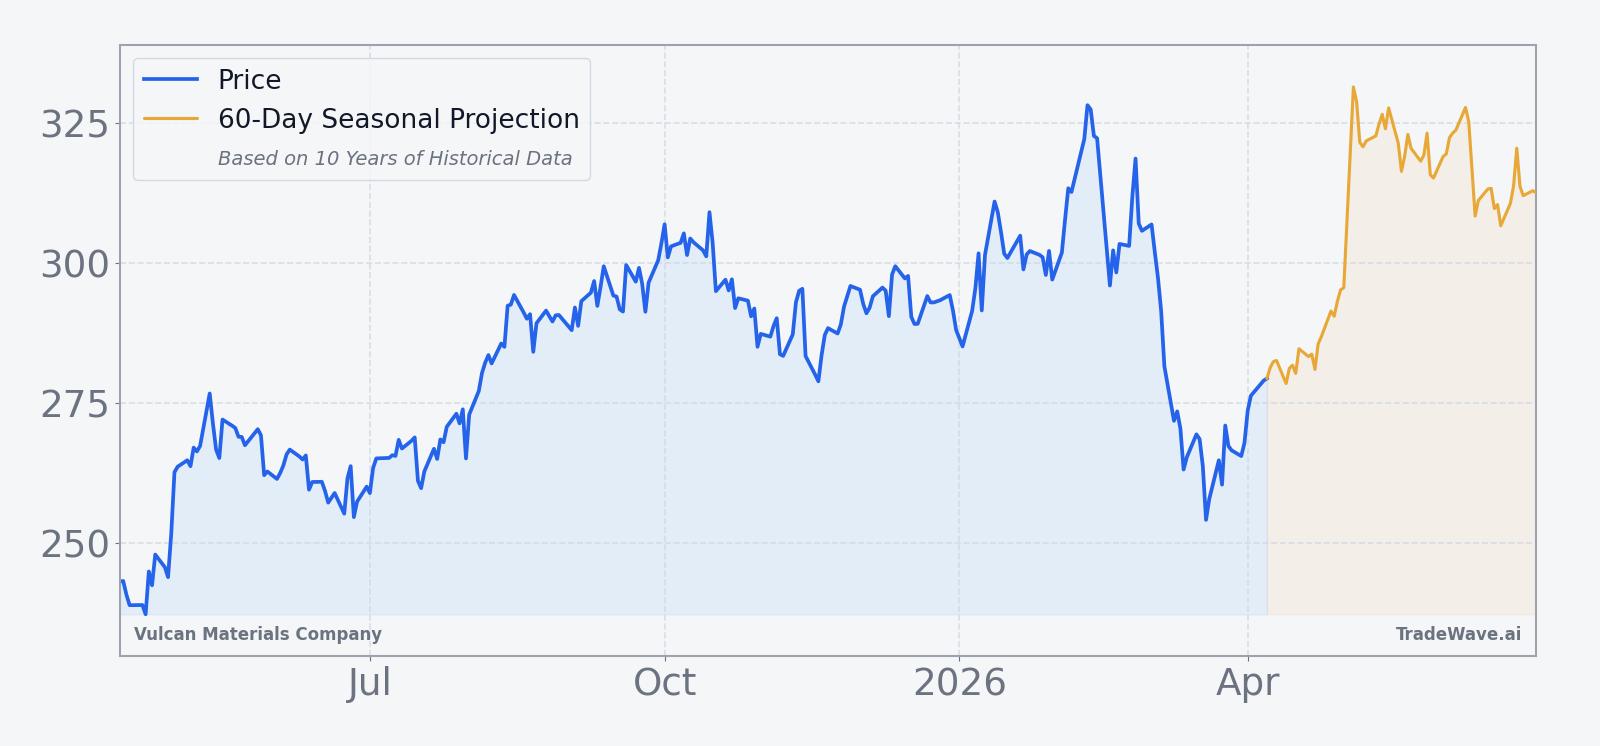
The chart below situates the latest move against the past year of trading and a 60-day seasonal projection overlay.
What should traders watch in this Vulcan Materials Company (VMC) window?
The first marker is how VMC behaves as the Apr 13 window opens relative to its 50-day moving average near 291. A push back above that level with rising volume would be consistent with the historical pattern of mid-April strength, while a failure to reclaim it would signal that macro headwinds are overpowering the usual seasonal tailwind.
Second, watch for any fresh headlines or policy signals around infrastructure and government spending. The 2025 analysis highlighting the risk from potential spending cuts remains relevant for a company whose fortunes are tied to public works budgets, and any sign of delayed or downsized projects could blunt the typical spring demand bump.[1] If those concerns stay in the background, the historical seasonality suggests the path of least resistance in this 21-day stretch has been higher.
Finally, intraperiod volatility deserves respect. Past windows have seen drawdowns of 4% to 8% even in years that finished solidly positive, so traders will be watching whether any early weakness is bought in line with prior patterns or whether selling pressure persists. Add it up: a 10-for-10 track record, a stock trading well below its highs, and a macro backdrop that could either reinforce or derail the usual spring script make this one of the more consequential seasonal windows on the VMC calendar.
Sources
About this seasonal analysis
Seasonal pattern data is sourced from TradeWave.ai, which analyzes historical price behavior across annual calendar windows going back up to 30 years. Read the full data methodology or the book The 100-Year Pattern by Afshin Moshrefi (2026 edition). Past performance of seasonal patterns does not guarantee future results. This article is for informational purposes only and does not constitute investment advice.