Teradyne (TER) Near Highs as 8-of-10 Midterm Late-April Windows Have Led to Declines
Teradyne is hovering near record highs just as a historically weak 23-day midterm-election seasonal window approaches, raising the stakes for traders in a red-hot AI test name.

What is the seasonal pattern for Teradyne (TER)?
Teradyne has fallen in 8 of 10 midterm-election-year windows starting around Apr 21, with an average 5.79% gain in winning years for the short setup.
- 8 for 10 in this window for the short side, with Avg Profit of 5.79% in winning years and 5% when all years are included.
- The upcoming 23-day Teradyne trading window begins Apr 21 and is grouped across the last 10 midterm election years.
- Percent Profitable is 80%, with 8 winners and 2 losers for the short pattern in this historical seasonality slice.
- Trade Direction is short, so years with negative net returns for the stock have been favorable for the pattern.
- Intraperiod swings have been meaningful, with several years showing double-digit peak run-ups and drawdowns inside the same window.
- Sharpe ratio of 0.88 and a TradeWave Ratio of 1.44 point to a historically efficient but volatile short-biased seasonal setup.
According to historical data from TradeWave.ai, this specific late-April window has behaved very differently from an average month for Teradyne. The next section walks through how that pattern has played out across past midterm election years.
How has Teradyne (TER) traded in the late-April midterm window?
In the last 10 midterm election years, Teradyne has fallen in 8 of the 23-day windows that start around Apr 21, making this one of its more reliable short-biased seasonal stretches. Shares finished Monday at 315.43, up 1.9% on the day and about 8.5% below their 52-week high of 344.92.[2]
Because this pattern is grouped by the presidential election cycle, it compares Teradyne only against other midterm election years rather than mixing in very different policy backdrops. That matters for a semiconductor test name tied closely to capital spending and AI infrastructure, where fiscal priorities and regulation can shift meaningfully between election phases.[1]
The seasonal window begins on Apr 21 and runs for 23 trading days. Trade Direction is short, which means the pattern has historically favored years when Teradyne drifted or broke lower during this slice of the calendar. Across those 10 midterm-year samples, Percent Profitable is 80%, with 8 winners and 2 losers for the short setup.
Average profit in the winning short years is 5.79%, while Avg Profit - All, which includes both winners and losers, comes in at 5%. That gap shows that the losing years have been meaningful but not large enough to erase the edge from the stronger down moves. Median Profit of 4.84% sits close to the average, suggesting the typical outcome has not been dominated by a single outlier year.
For a short pattern, negative net returns for the stock are the favorable outcomes. Several years stand out. In 2002, Teradyne dropped 12.31% during the window, with a worst intraperiod drawdown of 17.84% from the entry price and only a modest 2.58% peak move against the short. In 2018, the stock fell 9.42% in the window, but the path was rough, with a worst adverse move of 20.74% before the decline ultimately stuck.
Not every year has delivered clean downside. In 1994, Teradyne finished the window up 5.78%, which counts as a losing year for the short, and the stock’s best intraperiod run-up reached 15.03% from the entry. Even in 1986, when the net return was flat at 0.0%, the stock rallied as much as 10.23% at one point, with only a shallow 1.86% move in the short’s favor.
Those swings show up in the volatility metrics. The TradeWave Ratio is 1.44, which means price has typically traveled a meaningful distance in the trade direction within the window, independent of where it closed. The Sharpe ratio of 0.88 indicates that, based on end-of-window outcomes, the risk-adjusted profile has been solid but not extreme for a short-term seasonal pattern.
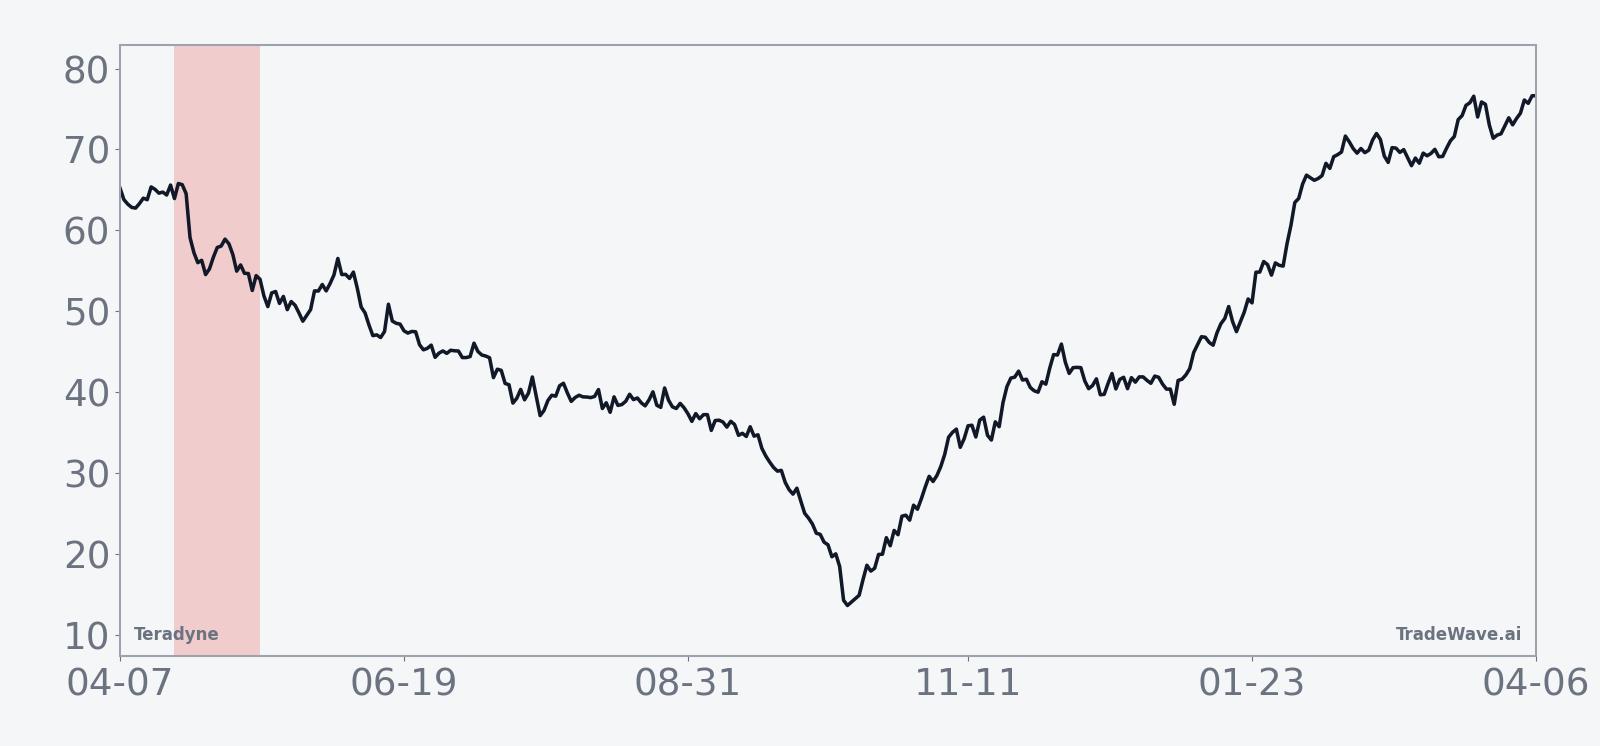
The historical seasonal trend chart shows that, on average, the short-friendly behavior tends to build gradually rather than in a single air pocket. The typical path features early choppiness, followed by a more persistent downward drift into the back half of the window, which is where many of the stronger short years have made their money.
A second view, combining yearly net results with best and worst intraperiod moves, highlights how often Teradyne has swung hard before settling on a direction.
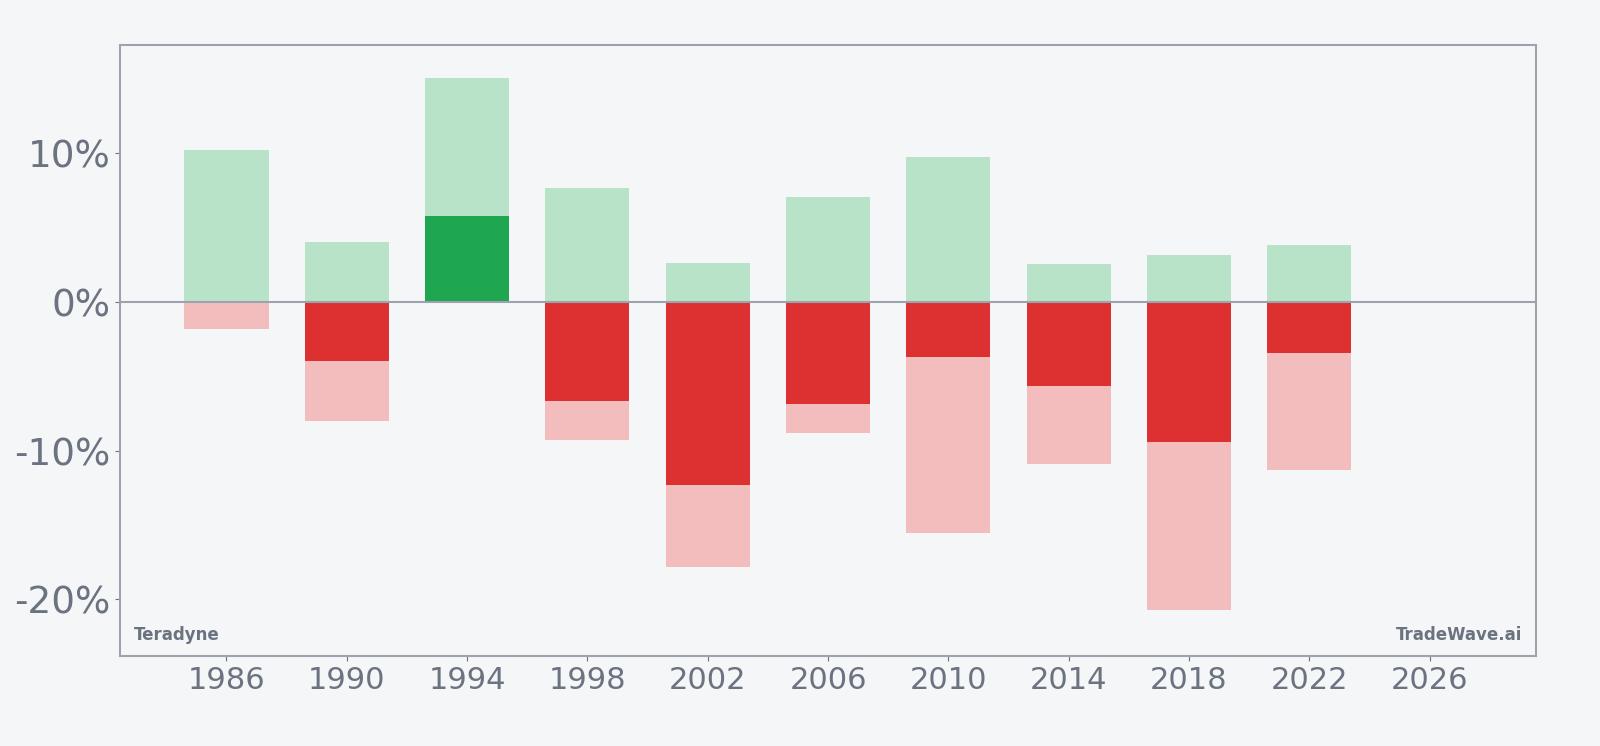
The stacked net, maximum favorable move and maximum adverse move bars show a clear pattern: even in years where the short ultimately worked, Teradyne often staged sizable rallies inside the window before rolling over. In the weaker short years, those rallies never reversed, leaving the pattern with a small cluster of painful squeezes against the trade.
Put together, the message is straightforward. Across the last 10 midterm election years, this late-April window has favored short exposure in 8 of 10 cases, but the path has usually been bumpy rather than smooth.
Why does Teradyne (TER) follow this seasonal pattern?
One likely driver is the way Teradyne’s orders and guidance tend to line up with the midyear semiconductor spending cycle, which can leave April and May exposed to digestion after earlier optimism. Analysts have also pointed to institutional portfolio repositioning around midterm-year policy debates, which can hit cyclical, capex-sensitive names like Teradyne harder than the broader market.[1] The pattern may also reflect traders front-running or fading earnings expectations in a stock that has become tightly linked to AI-related test demand.[2][3]
History does not guarantee future results, and intraperiod downside can be large even in windows that ultimately finish as winners for the pattern.
What is driving Teradyne (TER) today?
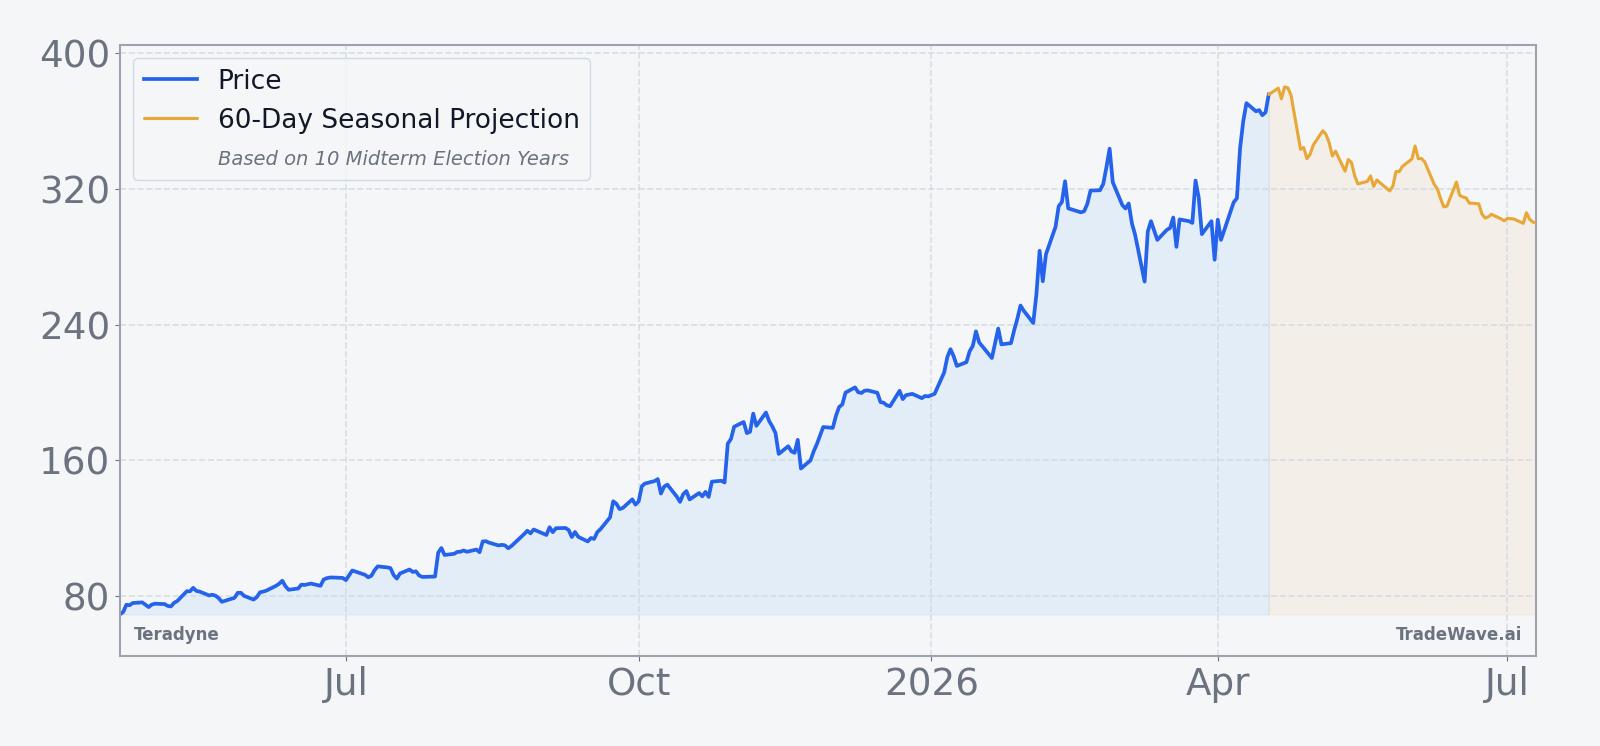
Teradyne closed Monday at 315.43, up 5.82 points or 1.9% on the session, extending a powerful run that has left the stock roughly 15.5% higher over the past month and about 8.5% below its 52-week high of 344.92.[2] The move caps a stretch in which the semiconductor test specialist has repeatedly topped earnings expectations and guided to strong AI-driven demand, including a Feb 2 report showing Q4 revenue of $1.08 billion, up 44% year over year, and adjusted EPS of $1.80 versus estimates of $1.37.[2][3]
In Feb 2026, management projected Q1 2026 adjusted EPS between $1.89 and $2.26 on revenue of $1.15 billion to $1.25 billion, pointing to broad-based growth across businesses and continued momentum from AI-related workloads in System-on-a-Chip and memory test.[1][2] That guidance helped cement Teradyne’s role as a high-beta way to play the build-out of AI data centers, a theme that has also drawn attention from analysts who have highlighted the stock as an under-the-radar AI beneficiary in prior cycles.[4]
Teradyne’s current price sits comfortably above its 50-day moving average of 296.13, with average 20-day volume around 3.1 million shares, underscoring how much institutional interest has built around the name.[2] The stock’s sharp climb from a 52-week low near 65.29 has already delivered a multi-bagger move for long-term holders, which makes any historically weak seasonal stretch more relevant for traders watching for signs of fatigue.
The chart below situates the latest move against the past year’s rally and overlays a 60-day seasonal projection for context.
What should traders watch as this Teradyne seasonal window approaches?
With the late-April midterm-year window less than two weeks away, the key question is whether Teradyne’s current strength can overpower a historically short-friendly stretch. Traders will be watching how the stock behaves as it approaches the 344.92 52-week high and whether pullbacks stay shallow or begin to resemble the deeper intraperiod drawdowns seen in prior midterm windows.[2]
On the macro side, any shifts in AI capex commentary from large cloud providers or changes in fiscal and regulatory rhetoric around semiconductor investment could matter more than usual during this period.[1][3] A continuation of strong order commentary would argue for resilience against the historical pattern, while signs of digestion or delayed spending could line up with the window’s short bias.
Inside the window itself, behavior around volatility will be telling. If Teradyne spikes higher early in the period and then fades, that would rhyme with several past years where rallies ultimately gave way to lower closes. A clean breakout that holds above prior highs through the full 23-day stretch, by contrast, would mark one of the rarer losing years for the short setup and signal that the current AI-driven regime is overpowering the usual midterm election-year seasonality.
Sources
- Forbes: What Is Happening With Teradyne Stock? (Oct 30, 2025)
- CNBC: Teradyne stock pops on earnings beat driven by AI demand (Feb 3, 2026)
- The Wall Street Journal: Teradyne Profit Rises as Sales Surge on AI-Related Demand (Feb 2, 2026)
- Business Insider: 3 Under-the-Radar AI Stocks for Investors to Watch, According to UBS (Oct 28, 2025)
About this seasonal analysis
Seasonal pattern data is sourced from TradeWave.ai, which analyzes historical price behavior across annual calendar windows going back up to 30 years. Read the full data methodology or the book The 100-Year Pattern by Afshin Moshrefi (2026 edition). Past performance of seasonal patterns does not guarantee future results. This article is for informational purposes only and does not constitute investment advice.