Shorts Eye EQT Corporation (EQT) After 8-for-8 Midterm Decline Run Averaging 12.58% Profits
EQT Corporation is heading into a midterm-election-year seasonal window that has consistently favored the short side, even as the stock trades well below its 52-week high.

What is the seasonal pattern for EQT Corporation (EQT)?
EQT Corporation has fallen in 8 of 8 midterm-election-year windows starting around April 18, with an average 12.58% gain for short positions in winning years.
- 8 for 8 in this window, with short trades averaging 12.58% profits in winning years across the last eight midterm election cycles.
- The upcoming 164-day window begins on Apr 18, 2026 and has historically been a bearish seasonal stretch for EQT Corporation.
- Percent Profitable is 100%, with 8 winners and 0 losers for the short-side pattern in this specific election-cycle grouping.
- Average annualized return for the pattern is 12.36%, supported by a Sharpe ratio of 1.43 that reflects strong risk-adjusted results.
- The TradeWave Ratio of 2.0 indicates that price has typically traveled meaningfully in the trade direction within the window, offering room for sizable swings.
- Individual years have seen net declines as deep as 24.4%, underscoring that intraperiod volatility can be substantial even in a consistently profitable setup.
According to historical data from TradeWave.ai, this midterm-election-year stretch has behaved very differently from an average calendar window for EQT. TradeWave.ai’s seasonal database flags the coming 164 trading days as one of the stock’s most consistently negative regimes in the election cycle.
How has EQT Corporation (EQT) traded in this midterm-year window?
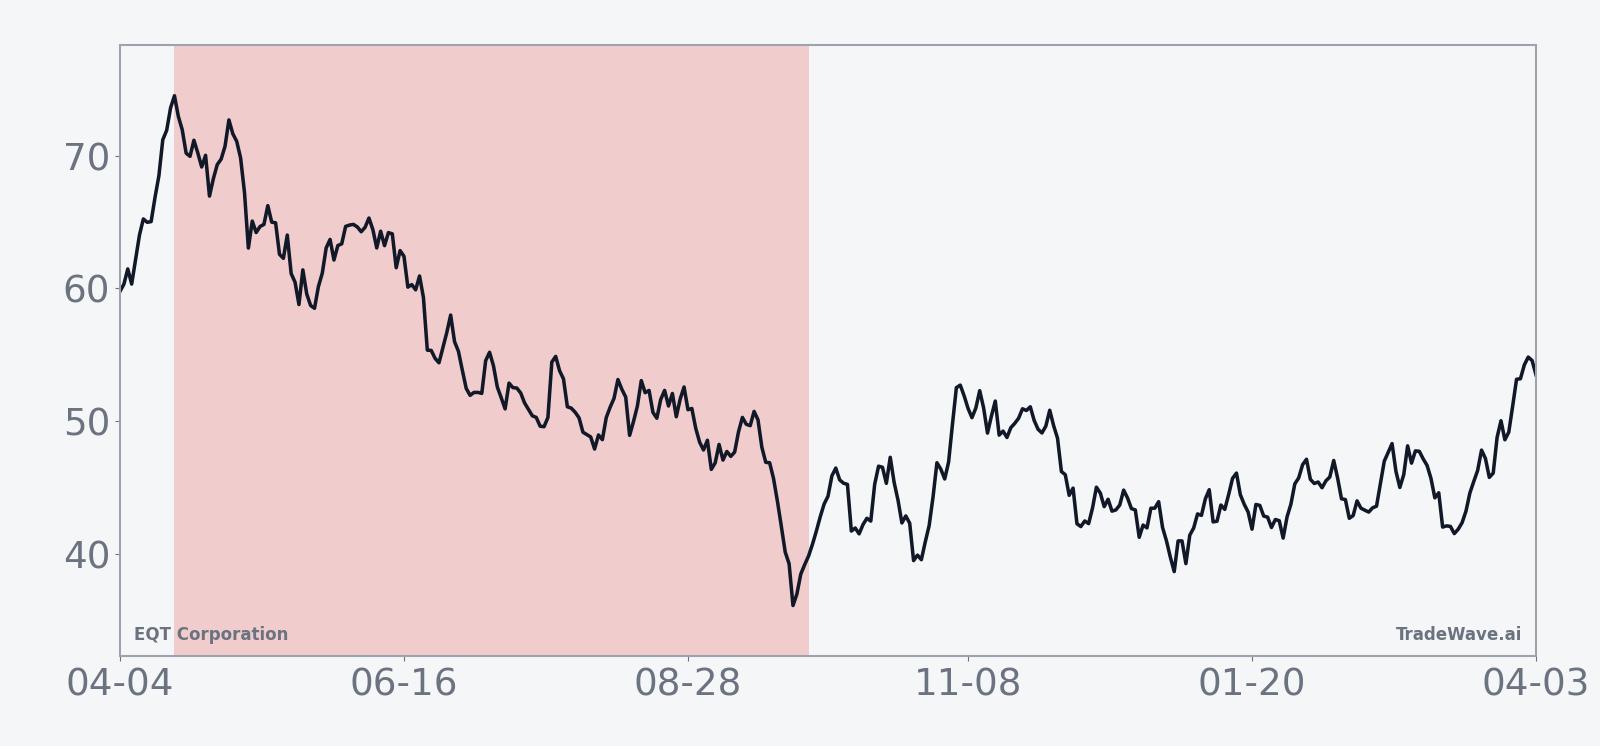
EQT Corporation has fallen in every one of the last eight midterm election years during the 164-day window that starts around Apr 18, with short positions posting an average profit of 12.58%. Shares finished Friday at 58.68, down 1.3% on the day and about 14.0% below the 52-week high of 68.24, leaving room on the chart if the historical seasonal trend reasserts itself.
The presidential election cycle matters here because this pattern is built only from midterm election years, a phase that often brings policy uncertainty, shifting regulation and choppy risk appetite. Grouping EQT’s behavior by this specific phase strips out noise from other parts of the cycle and focuses on how the stock has traded when Washington is in the middle of a term and investors are recalibrating expectations for energy policy and spending.
Historically, the trade direction for this window has been short, and the record is clean: 8 winners, 0 losers, and 100% of years profitable for traders positioned for downside. Average profit across those winning years is 12.58%, with a median outcome of 10.96%, which means the typical midterm-year iteration has delivered a double-digit decline from entry to exit for EQT. The cumulative return across all eight cycles is 153%, and the annualized return of 12.36% with a Sharpe ratio of 1.43 points to a pattern that has not only been consistent but also attractive on a risk-adjusted basis.
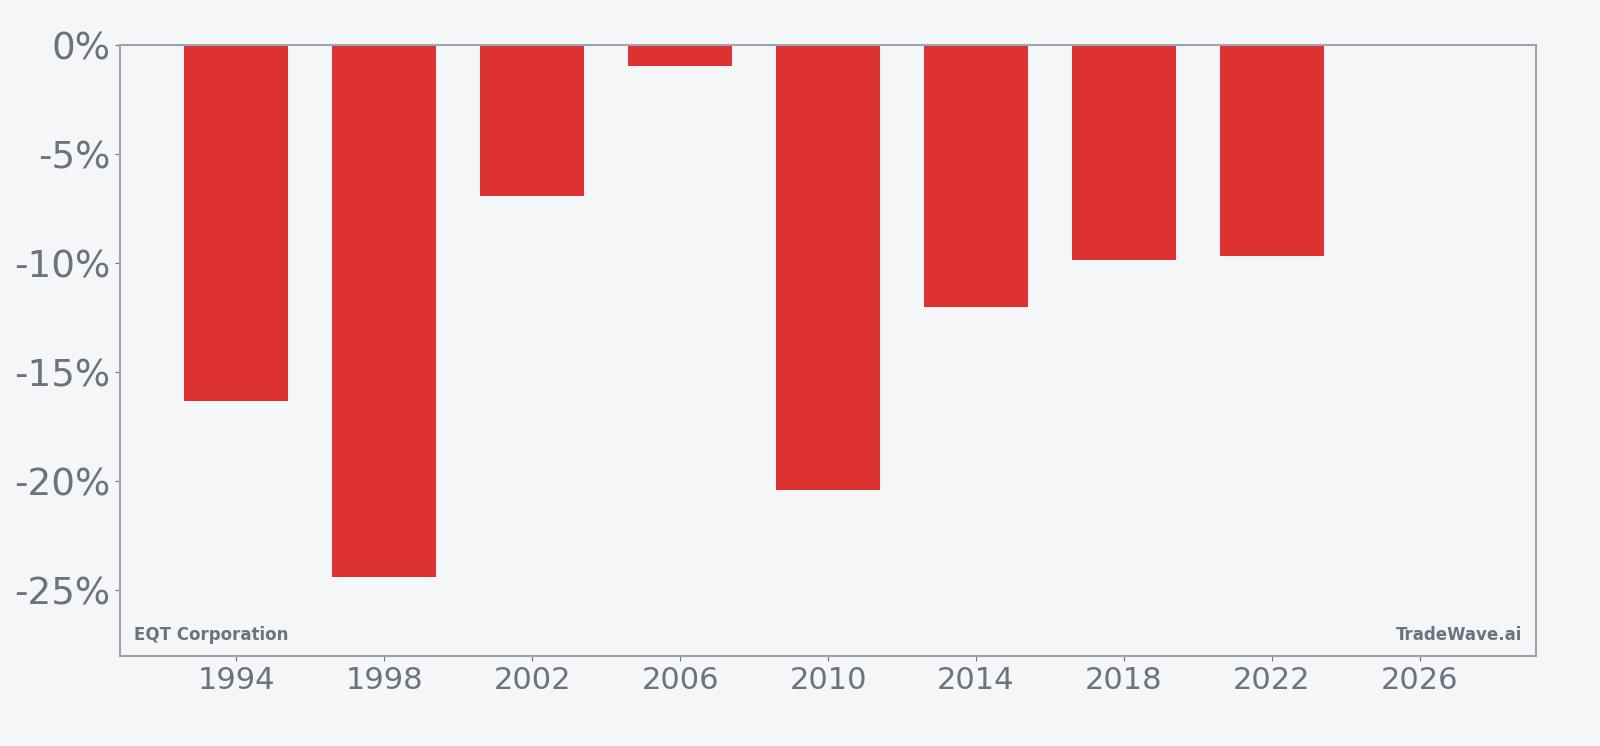
The per-year breakdown shows how that plays out in practice. The strongest year for the short pattern was 1998, when EQT dropped 24.4% over the window, while 2010 was close behind with a 20.42% decline. Even the softest iteration, 2006, still produced a 0.96% profit for shorts, as the stock drifted slightly lower despite a 5.94% maximum favorable move at one point in the window. On the other side of the spectrum, 1994 and 2014 delivered net declines of 16.33% and 12.02% respectively, reinforcing that this has not just been a marginal edge.
Intraperiod swings have been meaningful. Maximum favorable excursions, the best point-to-peak moves in the trade direction, have reached as high as 16.86% in 2018 and 15.02% in 2022, showing that when EQT starts to slide in this window, the move can extend. Maximum adverse excursions, the worst drawdowns from entry, have also been large in some years, with MAE readings of -37.97% in 1998 and -31.58% in 2022, a reminder that even ultimately profitable short windows can involve sharp squeezes along the way.
The historical seasonal trend chart smooths those individual years into an average path, and it shows a fairly steady downward bias rather than a single crash point. Returns tend to deteriorate in stages across the 164 days, with only modest countertrend rallies on average, which fits the idea of a grinding mid-cycle reset for an energy name rather than a one-off shock.
The yearly net, peak favorable and worst adverse moves together sketch the full volatility envelope for this EQT seasonal trend.
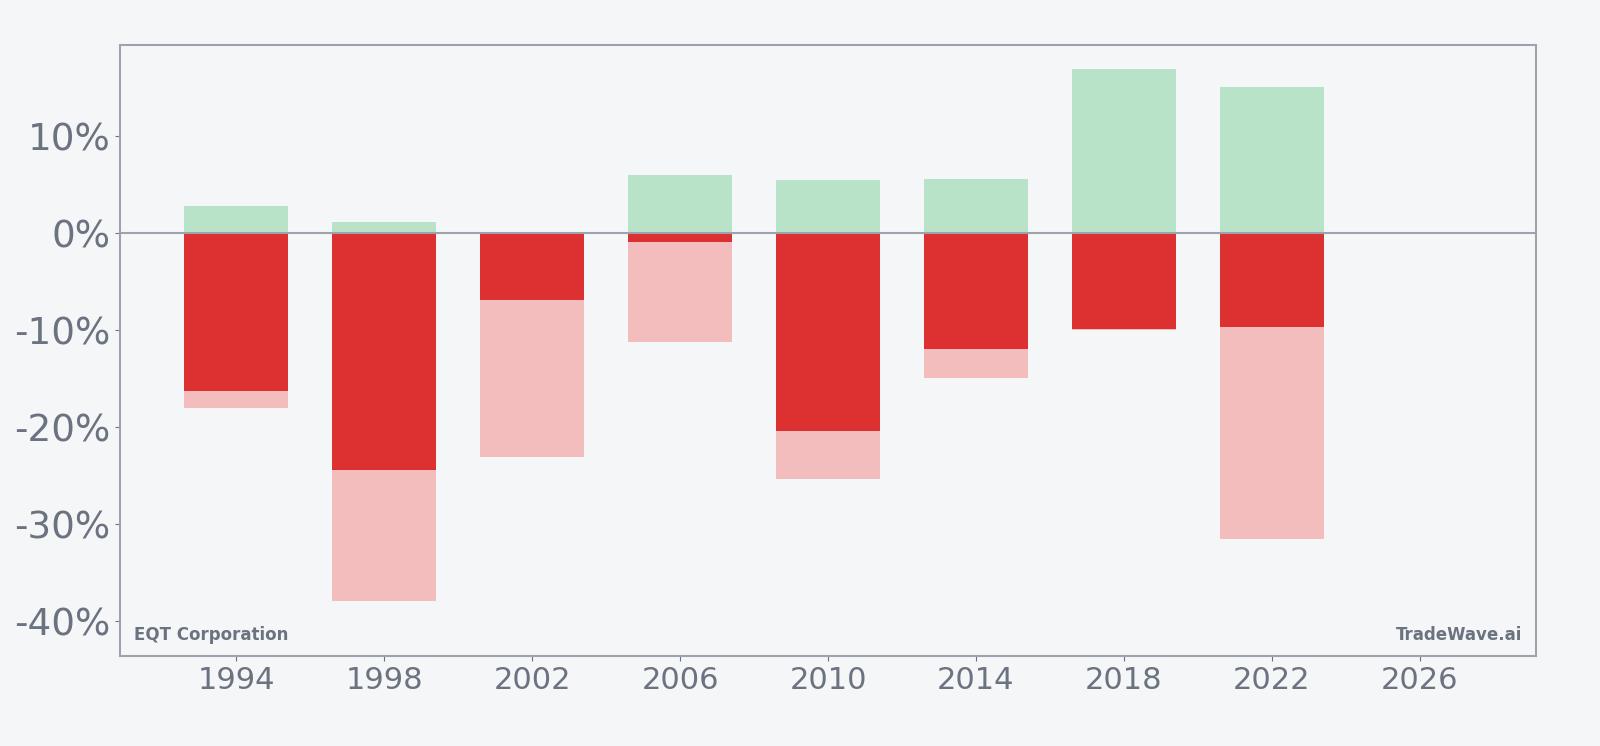
Viewed together, the net, maximum favorable and maximum adverse bars show a window that has historically rewarded patience on the short side but demanded a strong stomach. Large favorable moves have often come with sizable interim drawdowns, and in several years the worst squeeze arrived early before the downtrend reasserted itself. The key takeaway is simple: eight for eight, with meaningful swings in both directions along the way.
History does not guarantee future results; adverse excursions can be large even in winning windows, and past seasonal behavior may not repeat.
Why does EQT Corporation (EQT) follow this seasonal pattern?
This midterm-year pattern for EQT likely reflects a mix of election-cycle policy uncertainty and commodity seasonality. One likely driver is that midterm years often coincide with debates over regulation, drilling permits and infrastructure that can weigh on sentiment for natural gas producers. At the same time, shoulder-season demand shifts and hedging cycles in the energy complex may amplify volatility in this April-to-autumn stretch, creating a recurring backdrop where EQT has tended to trade lower.
What is driving EQT Corporation (EQT) today?
EQT closed at 58.68 on Apr 10, down 0.79 on the day, a 1.3% decline that leaves the stock about 14.0% below its 52-week high of 68.24 and roughly 33.2% above its 52-week low of 44.05. The pullback over the past month, with a one-month return of -9.22%, comes as trading volume has run below the 20-day average of 8.37 million shares, suggesting the recent drift lower has not yet attracted heavy conviction on either side.
The chart below situates the latest move in its recent multi-month context and overlays a short-term seasonal projection.
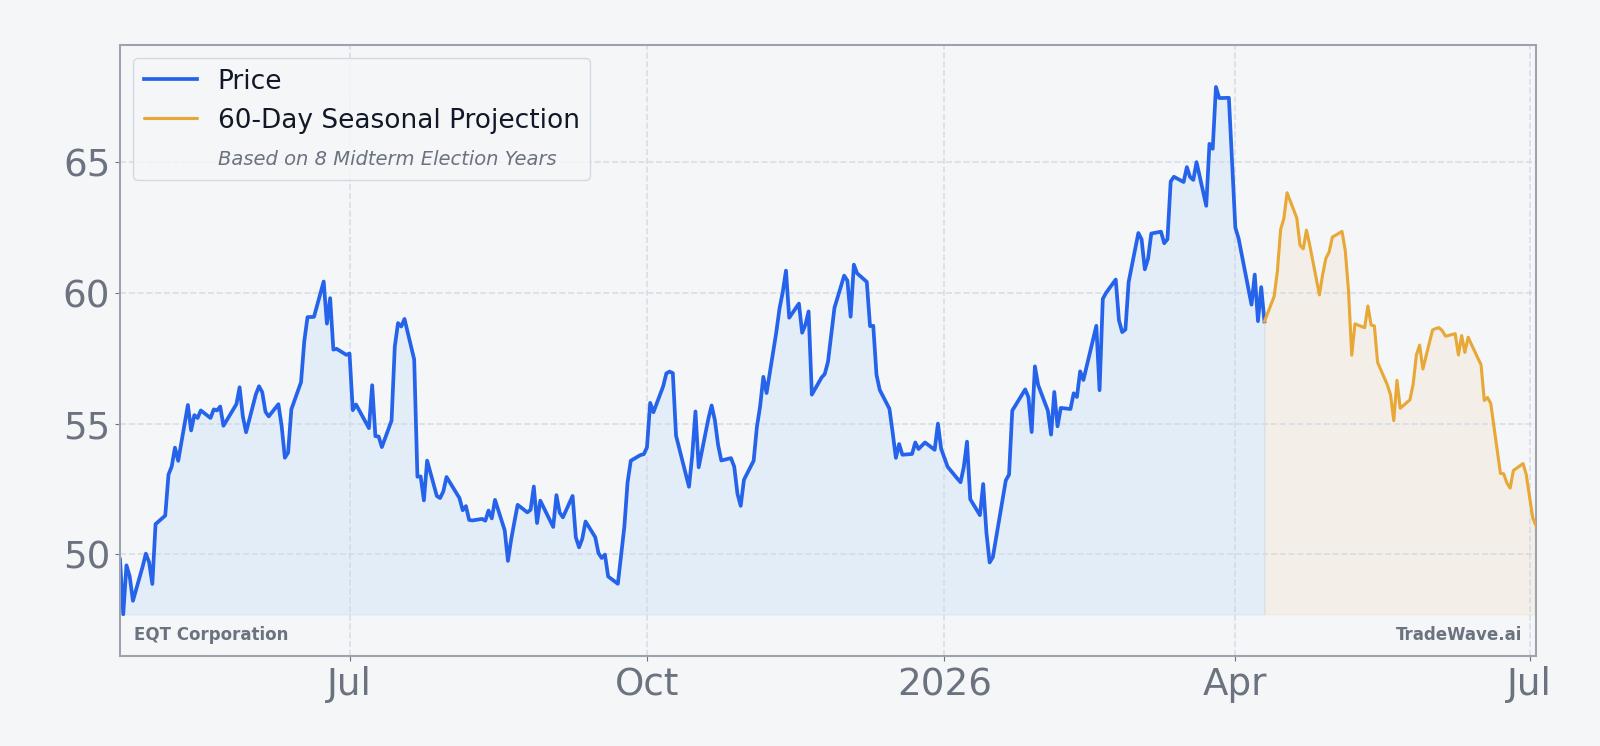
Technically, EQT is trading below its 50-day simple moving average of 60.78, a sign that momentum has cooled after a strong run earlier in the year. With no near-term earnings date or major company-specific catalyst on the calendar, the stock’s next phase may be shaped more by macro energy sentiment and the approaching midterm-year seasonal window than by fresh headlines. For traders who track historical seasonality, the combination of a soft tape, moderate distance from the highs and a consistently bearish midterm pattern is a setup to monitor rather than a signal in itself.
Sources
About this seasonal analysis
Seasonal pattern data is sourced from TradeWave.ai, which analyzes historical price behavior across annual calendar windows going back up to 30 years. Read the full data methodology or the book The 100-Year Pattern by Afshin Moshrefi (2026 edition). Past performance of seasonal patterns does not guarantee future results. This article is for informational purposes only and does not constitute investment advice.