UnitedHealth Group (UNH) Has Rallied 6 of 6 Midterm May Windows, Averaging 14.32% Gains
UnitedHealth Group is heading toward a historically strong midterm-year seasonal window even as shares trade far below their 52-week high and the policy backdrop stays volatile.

What is the seasonal pattern for UnitedHealth Group (UNH)?
UnitedHealth Group has risen in 6 of 6 midterm-election-year windows starting in early May, with an average gain of 14.32% in winning years.
- 6 for 6 in this window, with UnitedHealth Group averaging 14.32% gains across all winning years.
- The upcoming pattern runs 163 trading days from May 9, clustering in the last six midterm election years.
- Percent Profitable is 100%, with 6 winners and 0 losers in the historical sample.
- Average annualized return in the window is 14.22%, with a Sharpe ratio of 2.38 on end-of-window outcomes.
- The TradeWave Ratio of 4.33 signals that price has typically traveled meaningfully in the long direction within the window.
- Individual years have still seen sizable drawdowns inside the window, underscoring that the path can be bumpy even when the finish is positive.
According to historical data from TradeWave.ai, this midterm-election-year stretch for UnitedHealth Group has behaved very differently from an average calendar period, and the next iteration is about to open.
How has UnitedHealth Group (UNH) traded in this midterm-year seasonal window?
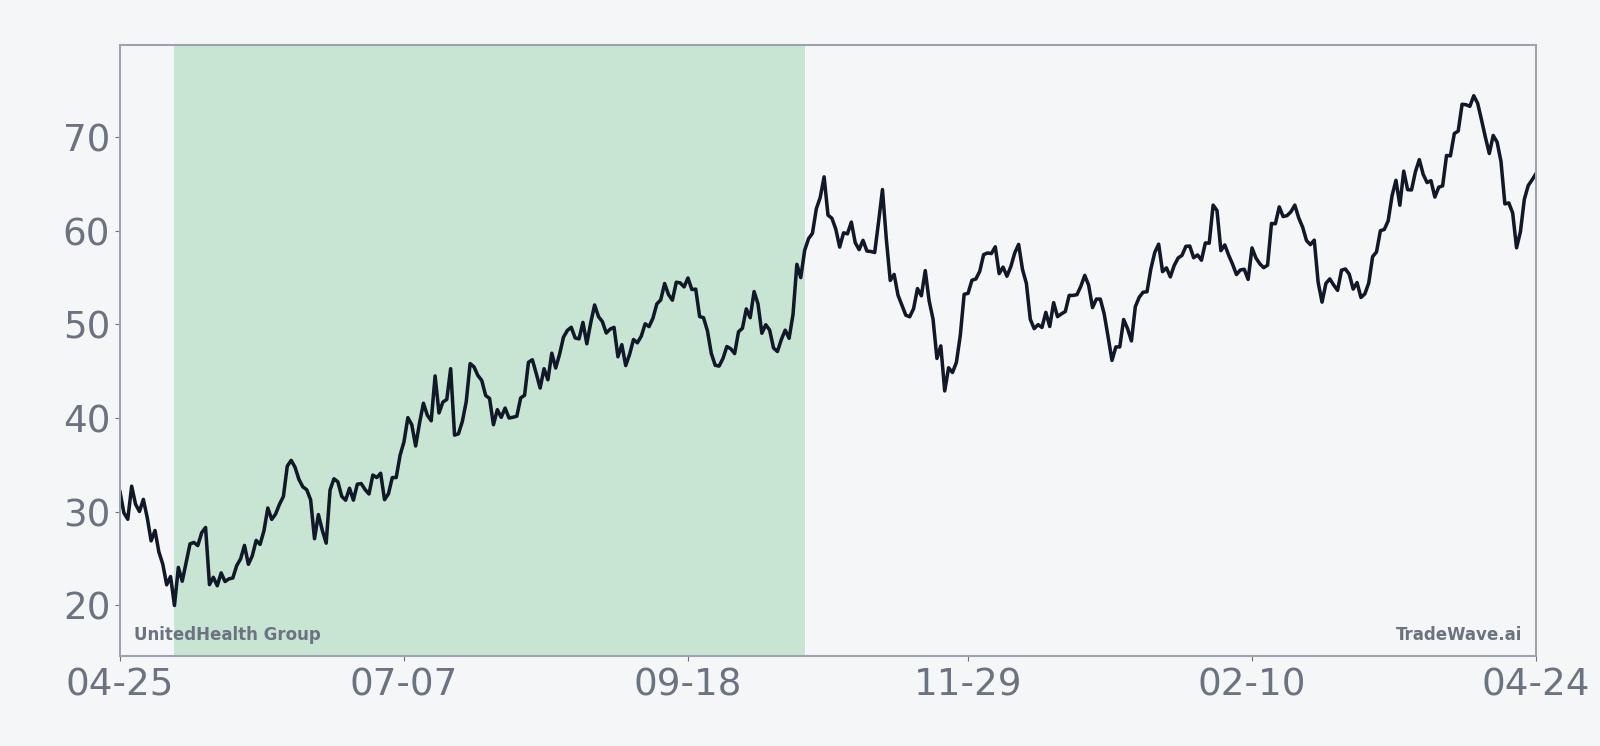
UnitedHealth Group has posted gains in all six midterm-election-year windows that began around May 9 and ran for roughly 163 trading days, averaging 14.32% advances for long positions. Shares finished Monday at $304.33, down 0.8% on the day and about 47.8% below the 52-week high near $582.51, leaving a lot of room between current levels and the prior peak.[7]
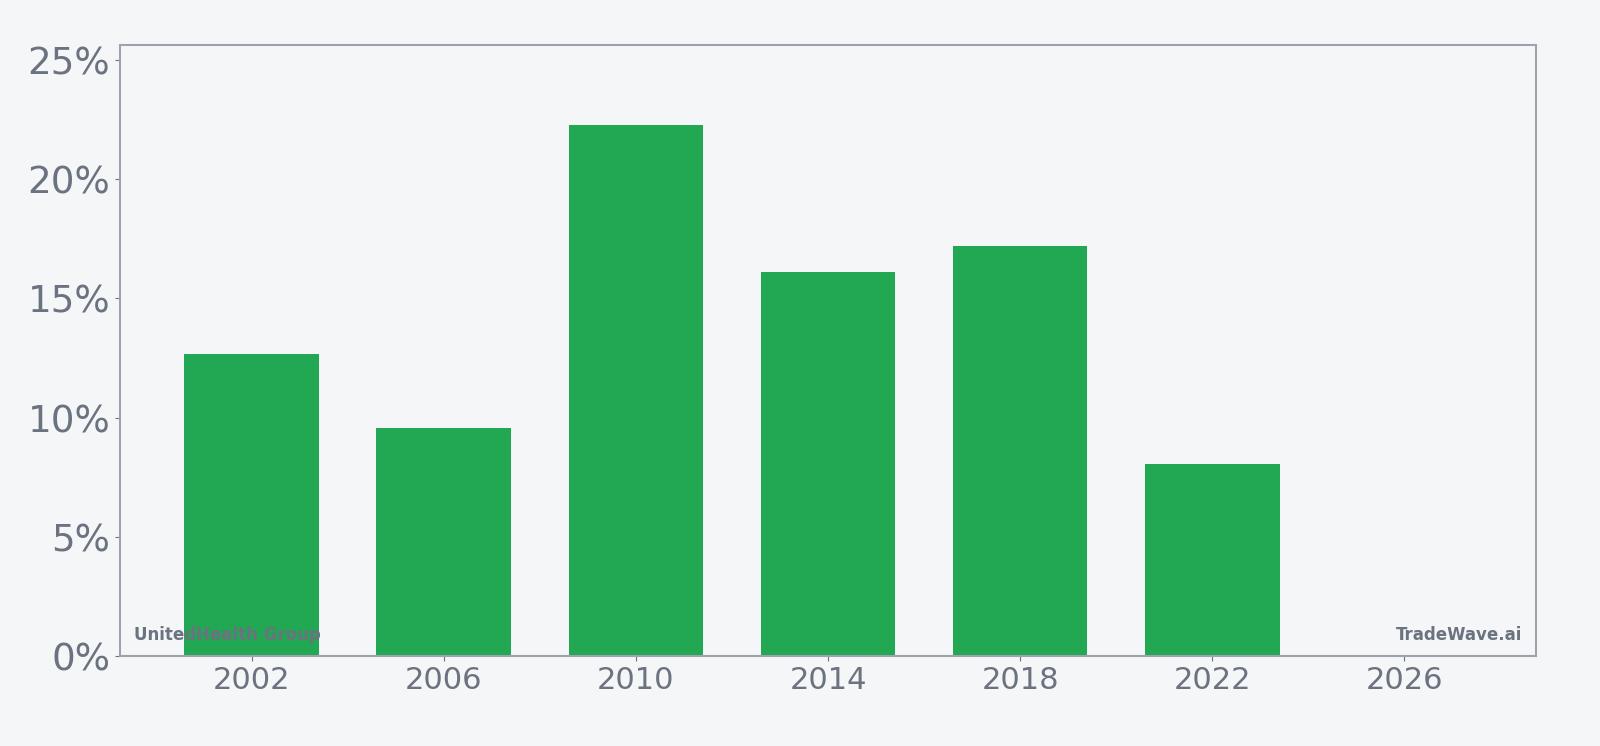
The pattern groups the last six midterm election years, a phase of the presidential cycle that often brings heavier policy noise for managed-care stocks as Washington debates spending and reimbursement. In those six midterm years, a long position in UnitedHealth Group held from early May for 163 trading days finished higher every time, with individual net returns ranging from 8.08% in 2022 to 22.28% in 2010.
Average winners gained 14.32%, while the median outcome was slightly higher at 14.39%, which points to a fairly tight cluster of positive results rather than one outlier year doing all the work. The cumulative return across the six cycles totals 122%, which means that simply repeating this same window in each midterm year would have more than doubled capital over the sample. Add it up: six midterm-election-year slices, six green finishes, and no losing years for this specific UnitedHealth Group trading window.
The historical seasonal average shows gains building steadily through the middle of the window, with strength tending to persist rather than spike and fade. That fits the election-cycle backdrop: midterm years often start choppy, then see risk appetite improve as policy headlines get digested and investors look ahead to the year before the presidential election, which has historically been friendlier for equities.
A closer look at yearly net returns and intraperiod swings shows how much room there has been for both rallies and drawdowns inside this bullish pattern.
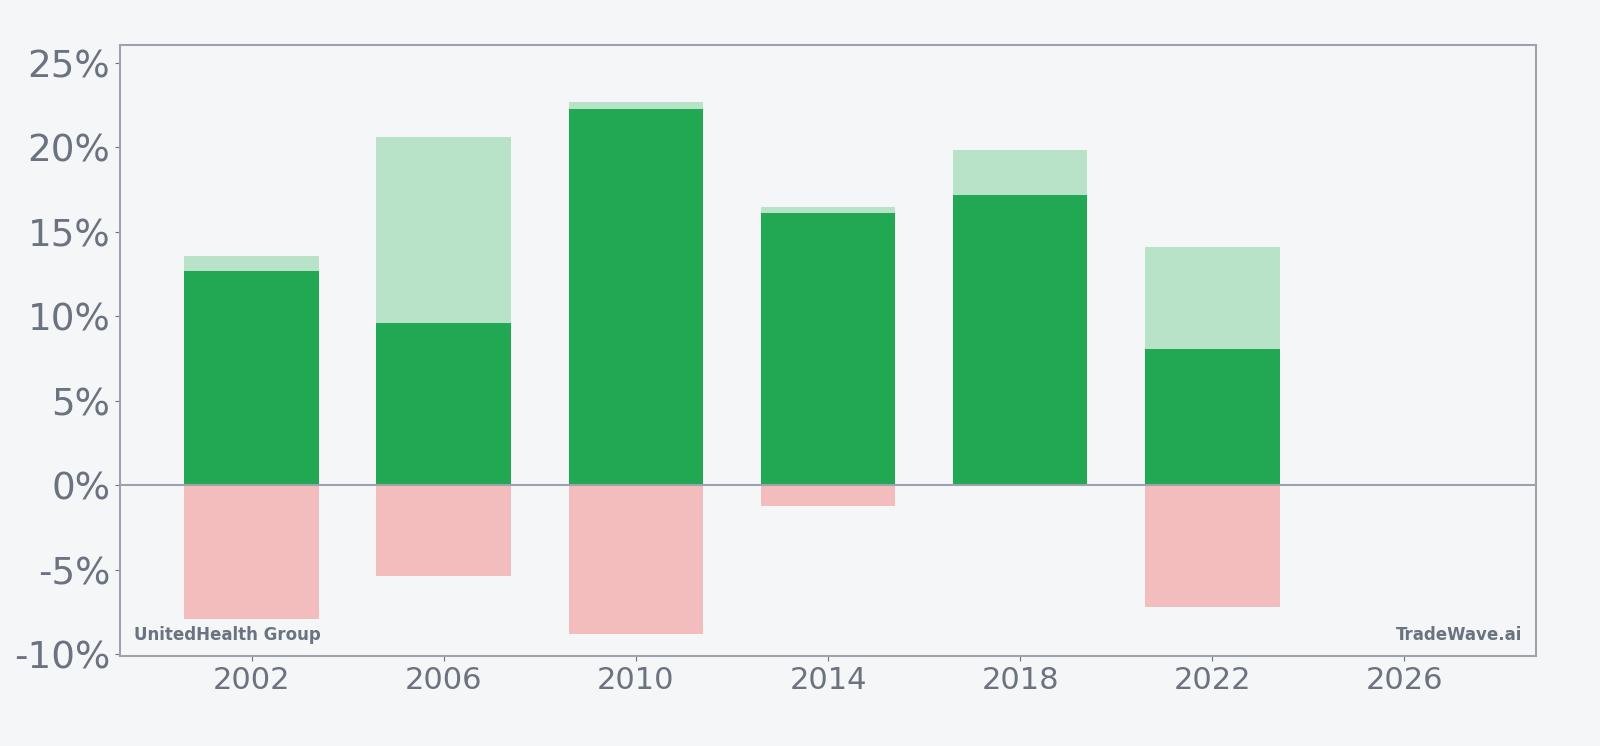
Per-year data shows that in strong years like 2010 and 2018, UnitedHealth Group not only finished up double digits but also saw maximum favorable moves of 22.68% and 19.85% from the entry point, respectively. At the same time, the worst intraperiod drawdowns ranged from a mild 0.07% in 2018 to deeper setbacks of around 7% to 9% in 2002, 2010, and 2022, illustrating that even winning windows have required sitting through meaningful volatility. In plain English, the stock has tended to reward patience in this midterm-year slice, but the ride has not been smooth.
History does not guarantee future results; adverse excursions can be large even in winning windows, and past seasonal strength does not ensure similar outcomes in 2026.
Why does UnitedHealth Group (UNH) follow this seasonal pattern?
One likely driver is the way health-policy debates and Medicare funding decisions cluster around the midterm-election calendar, which can front-load uncertainty early in the year and clear the way for relief rallies later. Analysts have also pointed to institutional portfolio repositioning around managed-care names as visibility on reimbursement and medical cost trends improves into the back half of midterm years.[1] This UnitedHealth Group seasonal trend may reflect that shift from policy anxiety to earnings clarity as investors look ahead to the typically stronger year before the presidential election.
What is driving UnitedHealth Group (UNH) today?
UnitedHealth Group closed at $304.33 on Monday, down 0.8% on the session, after a sharp slide over the past year that has left the stock about 47.8% below its 52-week high of roughly $582.51.[7] The pullback follows a period in 2025 when the company delivered double-digit revenue growth and raised full-year earnings guidance, yet still traded under pressure as investors focused on rising medical costs, Medicare funding dynamics, and regulatory uncertainty around drug pricing.[1][2][3]
In Oct 2025, UnitedHealth reported third-quarter revenues of $113.2 billion, up 12% year over year, and lifted its 2025 adjusted earnings outlook to at least $16.25 per share, underscoring the resilience of its core insurance and services franchises even as the stock struggled.[1][3] Earlier in 2025, commentary around a former President Trump executive order on drug pricing highlighted the policy risk that can weigh on sentiment for large managed-care names like UnitedHealth, especially when investors are already nervous about medical cost trends.[2] Sector watchers have also flagged how rising medical costs and potential Medicare funding cuts can pressure the company’s medical care ratio, a key profitability metric for health insurers.[1]
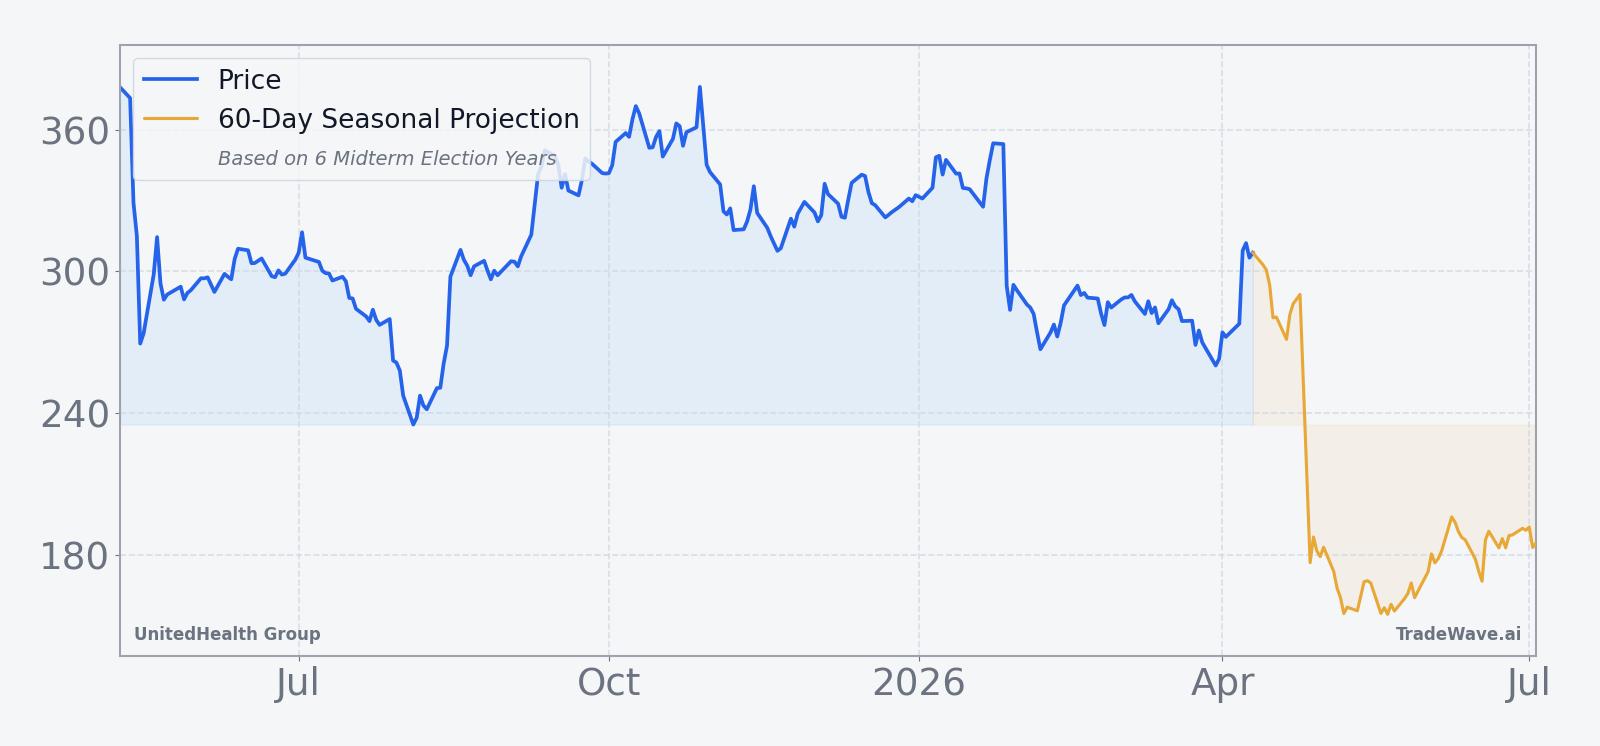
The chart below situates the latest move in its recent multi-month context, alongside a short-term seasonal projection.
How does the election cycle shape UnitedHealth Group’s seasonal outlook?
The current calendar year sits in the midterm election phase of the presidential cycle, which has historically been a noisy period for healthcare policy and reimbursement debates. For a systemically important managed-care stock like UnitedHealth Group, that means headlines around Medicare, Medicaid, and drug pricing can swing sentiment even when the underlying earnings trend is solid.[2] The seasonal pattern starting May 9 is built specifically from the last six midterm election years, so it captures how the stock has behaved once the early-year policy jitters give way to a clearer view of the fiscal and regulatory path.
In those prior midterm years, the 163-day window has tended to coincide with a transition from uncertainty to greater visibility on both Washington’s stance and the company’s earnings power. That may help explain why the historical seasonality for UNH in this slice is so consistently positive even though the broader year can be volatile. For traders, the key nuance is that this is not a generic May-to-October pattern; it is a midterm-year-specific regime that lines up with the policy calendar and the market’s shifting focus toward the year before the presidential election.
What should traders watch as this UnitedHealth Group seasonal window approaches?
With UnitedHealth Group trading well below its 52-week high and the next 163-day midterm-year window set to begin on May 9, the intersection of price, policy, and seasonality will matter more than any single headline.[7] The historical record says this has been a favorable stretch for long exposure in UNH, but the path has included drawdowns of 5% to 9% inside otherwise winning years, so traders will want to track whether any early weakness into the window resembles those past shakeouts or something more structural.
On the fundamental side, watch for updates on medical cost trends and Medicare funding, since both have been central to prior swings in the stock and directly affect the company’s medical care ratio.[1] Any fresh regulatory moves on drug pricing or reimbursement, similar in spirit to the executive order that unsettled the stock in May 2025, could also test the historical seasonal pattern if they arrive early in the window.[2] Finally, behavior inside the window will be telling: if UnitedHealth Group starts to build a series of higher highs and higher lows into late summer, that would rhyme with the prior six midterm-year cycles; a failure to stabilize or persistent breakdowns would mark a clear departure from the established UNH seasonal trend.
Sources
- Seeking Alpha: UnitedHealth stock rises on Q3 beats, raised guidance (Oct 28, 2025)
- Yahoo Finance: Donald Trump’s Executive Order Maintains the Pain on UnitedHealth Stock (May 16, 2025)
- UnitedHealth Group: UnitedHealth Group Reports Third Quarter 2025 Results (Oct 28, 2025)
- Seeking Alpha: UnitedHealth faces critical test as Q2 results loom (Jul 28, 2025)
- Seeking Alpha: UnitedHealth: Should You Buy This Falling Knife? (May 15, 2025)
About this seasonal analysis
Seasonal pattern data is sourced from TradeWave.ai, which analyzes historical price behavior across annual calendar windows going back up to 30 years. Read the full data methodology or the book The 100-Year Pattern by Afshin Moshrefi (2026 edition). Past performance of seasonal patterns does not guarantee future results. This article is for informational purposes only and does not constitute investment advice.