7-for-7 Losing Midterm Stretch Nears for Alcoa (AA) After 100% Run
Alcoa is trading well off its lows and less than 18% below its 52-week high just weeks before a midterm-election seasonal window that has never been kind to the stock.

Key takeaways
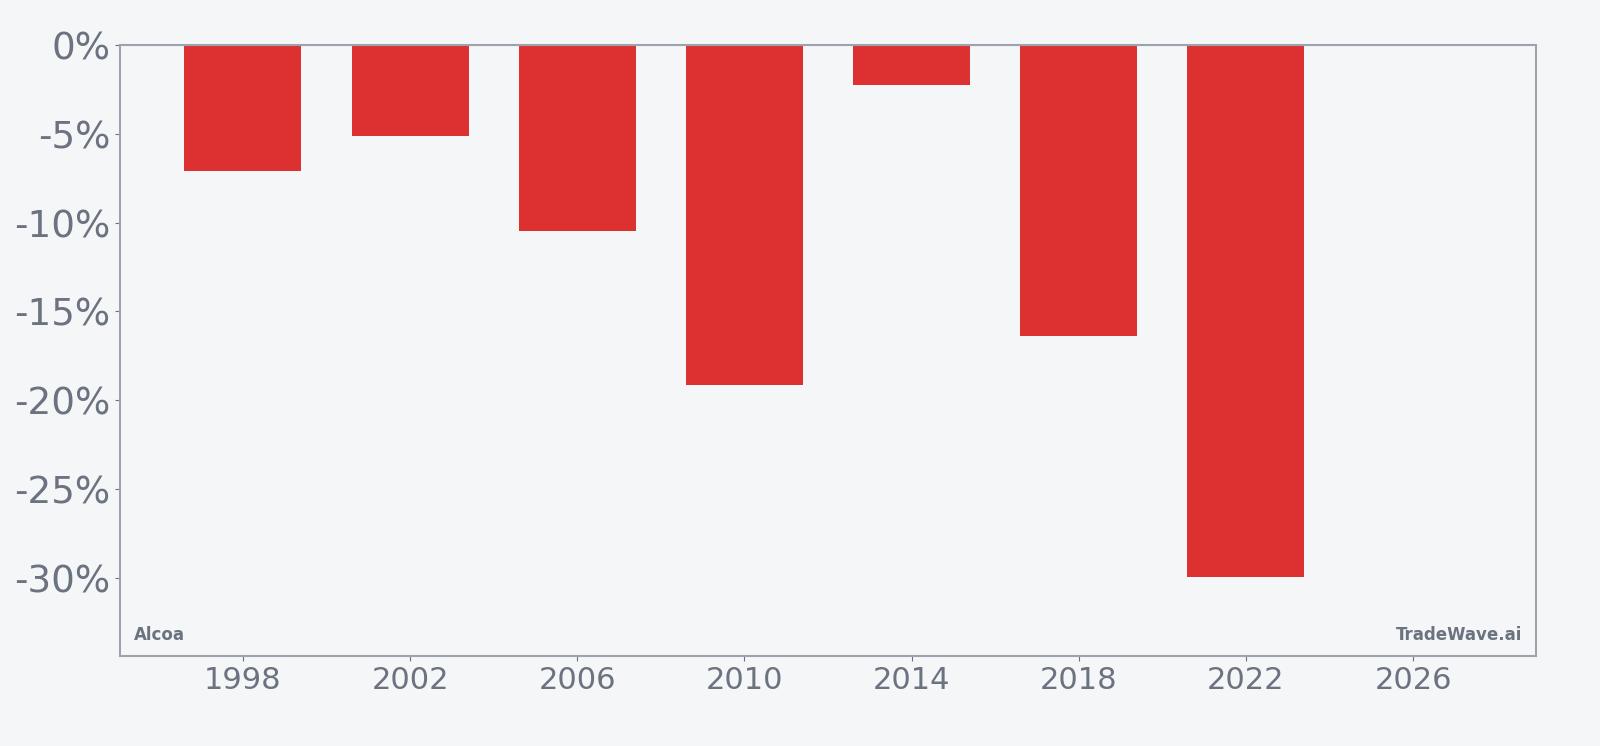
- Alcoa has posted losses in all seven midterm-election windows that match this 32-day stretch, a clean 7-for-7 record for the short side.
- The upcoming window runs from Apr 19 through late May, targeting the early part of the midterm election year when policy uncertainty often spikes.
- Across those seven years, the average move in the trade direction is 12.92%, with individual declines ranging from about 2% to nearly 30%.
- Intraperiod swings have been sharp, with some years showing double-digit peak drawdowns before the move plays out.
- Alcoa closed at $56.45 on Mar 20, about 17.5% below its 52-week high of $68.40, after a strong run tied to higher aluminum prices and better earnings.[1][6]
- The setup combines a historically weak midterm window for the stock with a backdrop of firm commodity pricing and solid recent profit growth.
According to historical data from TradeWave.ai, this specific slice of the midterm election year has behaved very differently from an average month on the calendar for Alcoa. The next section walks through what that pattern has looked like in prior cycles and how it frames the coming weeks.
Seasonal window
The presidential election cycle matters here because this pattern only looks at the last seven midterm election years, when policy noise and growth scares often collide for cyclicals like Alcoa. Alcoa has declined in all seven of those midterm-year windows during this 32-day stretch, with an average drop of 12.92% in the trade direction. The next iteration begins on Apr 19, 2026, and runs through late May.
Historically, this window has been a clean short pattern. Percent Profitable sits at 100%, with 7 winners and 0 losers for the short direction, and the Sharpe ratio of 1.31 points to a surprisingly consistent payoff profile for such a short stretch. Average winner profit of 12.92% means that in a typical midterm year, a short entered at the start of the window has captured a low double-digit decline by the end.
The per-year table shows how that has played out in practice. In 2022, Alcoa dropped 29.92% across the window, with a worst intraperiod drawdown of 38.39% from the entry price and only a modest 1.65% best bounce against the short. At the milder end, 2014 still delivered a 2.29% decline for the stock, with a 3.66% best move against the short and a 3.26% worst drawdown in the trade direction.
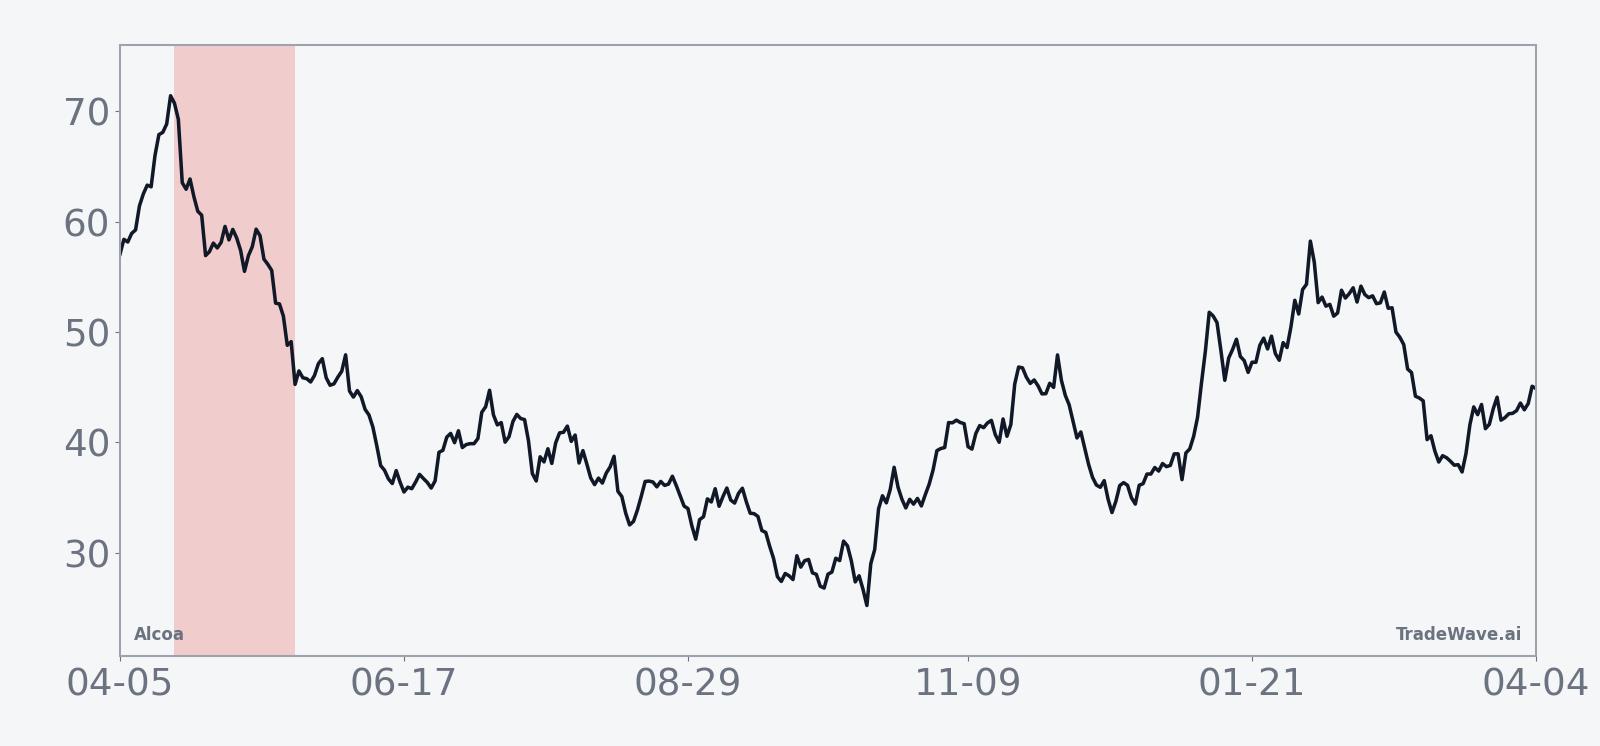
The historical seasonal trend line slopes steadily lower across the 32 days, with much of the damage clustering in the middle of the window rather than at the open. That profile suggests a tendency for the stock to wobble early, then accelerate lower as the window progresses, which fits the pattern of policy and macro headlines building into late spring of midterm years.
The yearly net, best-case and worst-case moves show how much room Alcoa has historically had to swing inside this window.
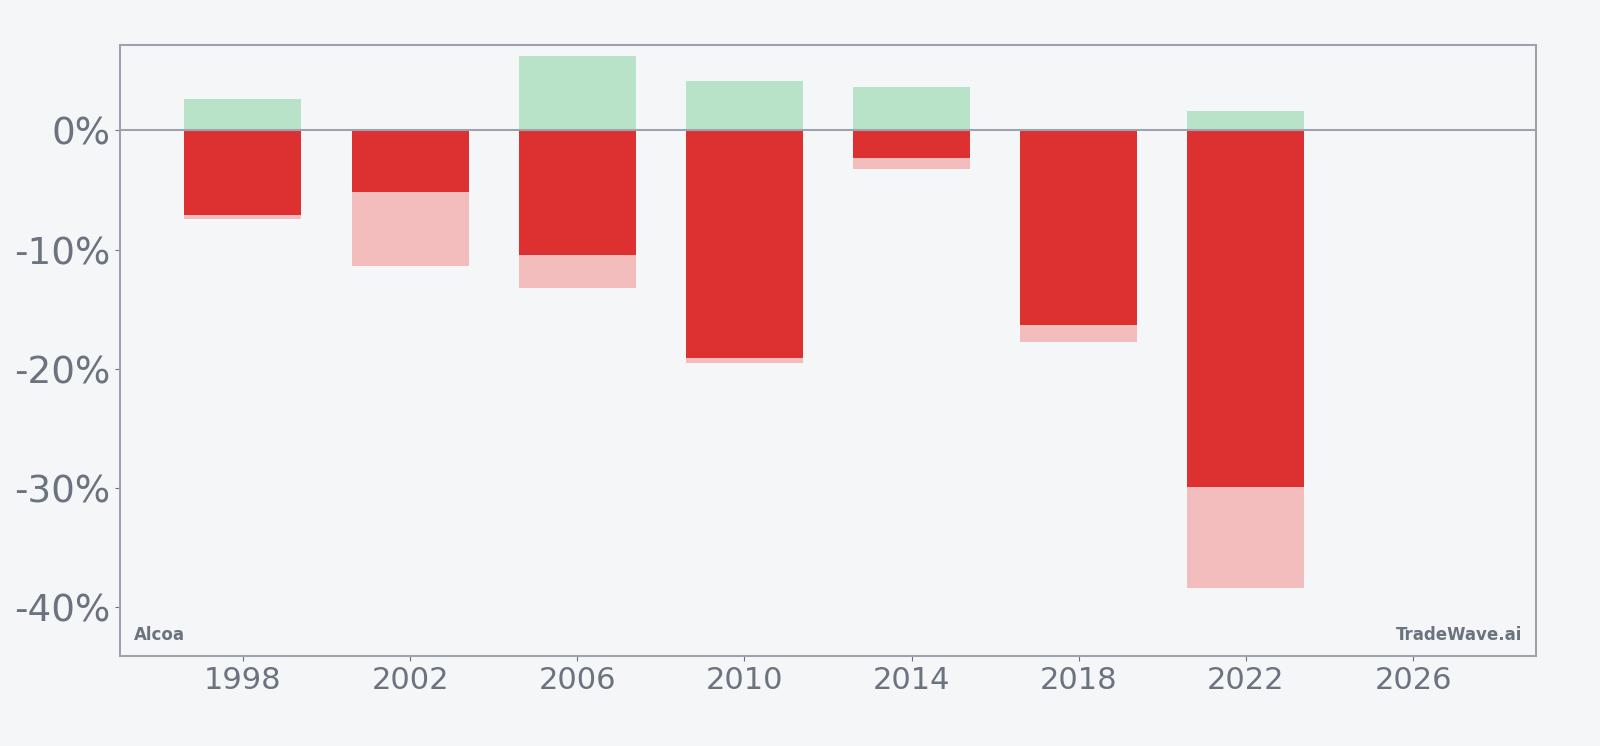
The combined net/MFE/MAE bars underline how volatile this stretch can be. In several years, such as 2010 and 2022, the maximum adverse move in the trade direction approached or exceeded 20%, showing that even winning shorts have had to sit through sharp countertrend rallies. At the same time, the maximum favorable excursions often ran well beyond the final net decline, which is what drives a TradeWave Ratio of 1.36 and signals that price tends to travel meaningfully in the short direction before the window closes.
History does not guarantee future results, and the worst intraperiod drawdowns in this window have been large even in years that ultimately finished as winners for the short side.
Price and near-term drivers
Alcoa closed at $56.45 on Mar 20, down 3.75% on the day, leaving the stock about 17.5% below its 52-week high of $68.40 and well above its 52-week low near $21.12. That pullback comes after a powerful run that saw the shares double over a broader stretch, helped by firmer aluminum prices and better execution.[1][6]
The chart below situates the latest move in its recent multi-month context, alongside a 60-day seasonal projection.
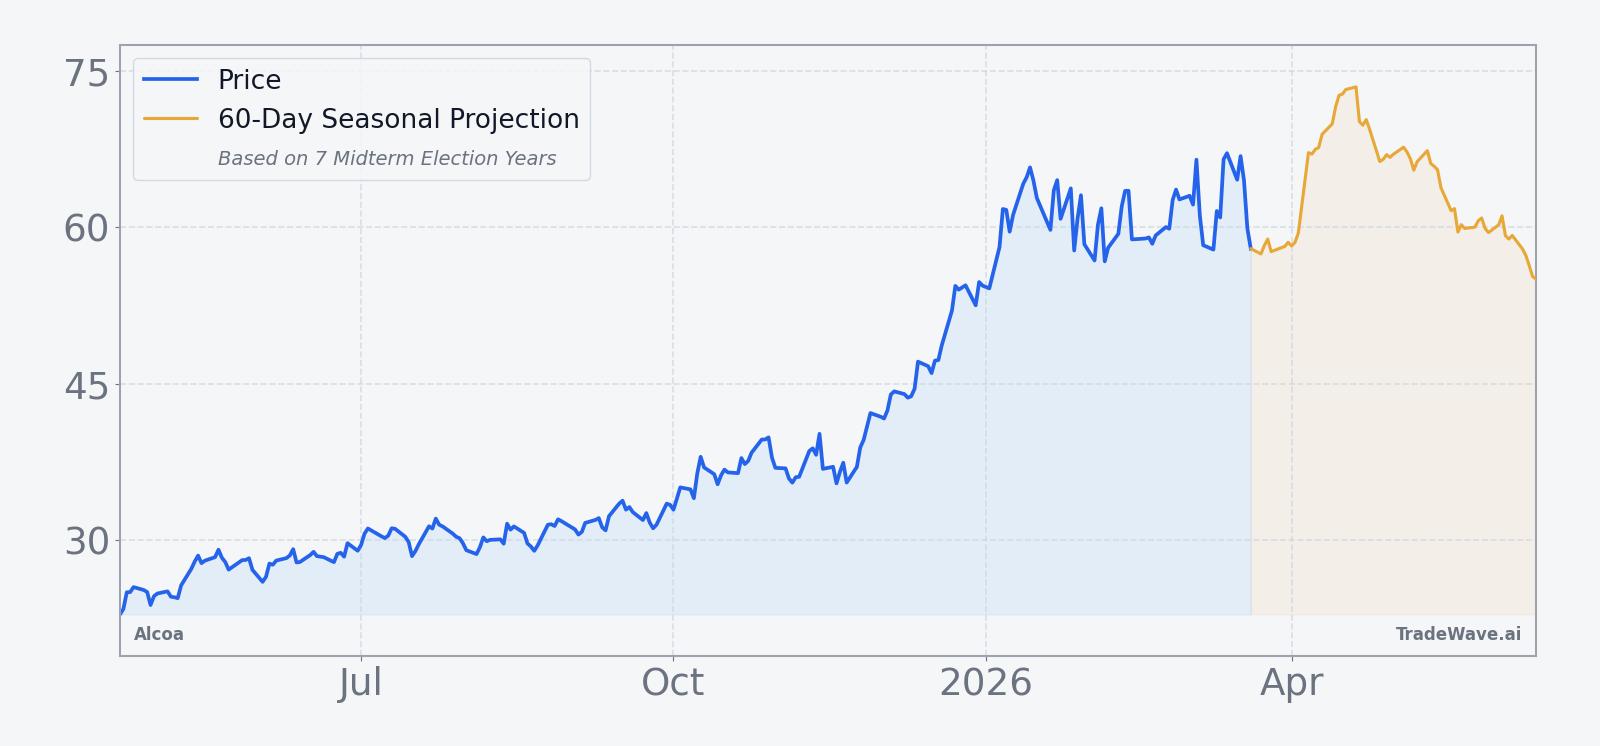
The fundamental backdrop has improved. On Jan 30, Alcoa reported quarterly revenues of $3.4 billion and adjusted earnings of $1.25 per share, topping expectations and underscoring how higher alumina and aluminum prices are feeding through to the bottom line.[1][6] Management has framed the outlook around two levers: keeping a lid on energy and input costs while riding stronger commodity pricing, with tariffs and power prices still the main swing factors for margins.[1]
Aluminum’s upswing has been central to the story. Rising prices have lifted revenue and profitability, while cost management and higher volumes have helped the company translate that into earnings growth.[1][3][4] In Jan 2026, Forbes described how the stock’s earlier 100% surge reflected that combination of better pricing and leaner operations, even as it flagged the risk that a reversal in the commodity cycle or a spike in energy costs could hit the shares hard in the next downturn.[5]
From a positioning angle, the stock has already seen periods of intense momentum. In Nov 2025, Alcoa was coming off a roughly 40% rise tied to stronger aluminum prices and strategic shifts, a move that left the shares vulnerable to any disappointment in subsequent quarters.[3] That kind of prior run-up matters when a historically weak seasonal window approaches, because it can leave fast-money holders quick to lock in gains if the tape starts to roll over.
The macro backdrop heading into the midterm year window is also important. Higher aluminum prices have been a tailwind, but they are tied to global growth expectations and industrial demand, both of which can wobble if central banks stay tight or fiscal policy turns more restrictive.[1][4] Midterm election years often bring added noise around infrastructure spending, trade policy and environmental rules, all of which feed directly into the outlook for a producer like Alcoa.
Put together, Alcoa is entering the early part of the midterm election year with a stronger balance of earnings and pricing power than in some past cycles, but with a stock that has already priced in a lot of good news. The historical pattern for this specific 32-day stretch has been unambiguously negative for the shares, which makes the coming window a notable test of whether the current fundamental story is strong enough to break a seven-cycle streak.
What to watch as the window opens
The next key date on the seasonal calendar is Apr 19, when the 32-day midterm-election window for Alcoa kicks off. Traders will be watching how the stock behaves as that date approaches, especially if aluminum prices stay firm and earnings revisions remain positive.
First, price levels matter. On the upside, the 52-week high at $68.40 is the obvious reference point; a decisive push toward or through that level during the window would run counter to the historical pattern and signal that this cycle is different. On the downside, how the stock trades if it breaks back through the low $50s will show whether prior momentum holders are quick to exit or willing to sit through volatility.
Second, macro and policy headlines will be crucial. Any shift in expectations around U.S. infrastructure spending, trade tariffs on metals, or energy policy during the early midterm year could either reinforce or blunt the usual seasonal weakness. For a producer like Alcoa, even small changes in power costs or tariff structures can swing margins meaningfully, which is why this phase of the election cycle tends to be so sensitive.
Third, watch the tape for signs that the prior momentum regime is fading or reasserting itself. Earlier periods when the stock surged 40% or more left it exposed to sharp air pockets once buyers stepped back.[3][5] If, during the upcoming window, rallies keep getting sold and intraday bounces fail quickly, that would line up with the historical short-friendly pattern. If instead dips are bought aggressively and volume builds on up days, it would suggest that the current demand for aluminum exposure is strong enough to overpower the midterm-year template.
Finally, volatility inside the window will be as important as the end result. Past cycles have seen large maximum adverse moves even in winning short years, which means intraperiod swings can be violent in both directions. How Alcoa trades through those swings, and whether it respects or rejects the seven-for-seven record of prior midterm windows, will tell investors a lot about how much of the recent fundamental improvement is already in the price.
Sources
- Forbes, "Inside Alcoa’s Latest Earnings," Jan 30, 2026.
- Forbes, "Analyzing Alcoa Stock Ahead of Its Earnings Report," Apr 14, 2025.
- Forbes, "What's Next After Alcoa's 40% Surge?," Nov 16, 2025.
- Forbes, "Where Is Alcoa Stock Headed?," Oct 1, 2025.
- Forbes, "Why Is Alcoa Stock Up 100%?," Jan 12, 2026.
- The Wall Street Journal, "Alcoa Posts Higher Profit On Alumina, Aluminum Sales Gains," Jan 22, 2026.