Morgan Stanley (MS) Has Dropped in 6 of 7 Midterm Windows, Averaging 6.85% Short-Side Wins
Morgan Stanley is trading near record levels just as a historically weak midterm-election seasonal window approaches, setting up a clash between bullish sentiment and a bearish stock pattern.

What is the seasonal pattern for Morgan Stanley (MS)?
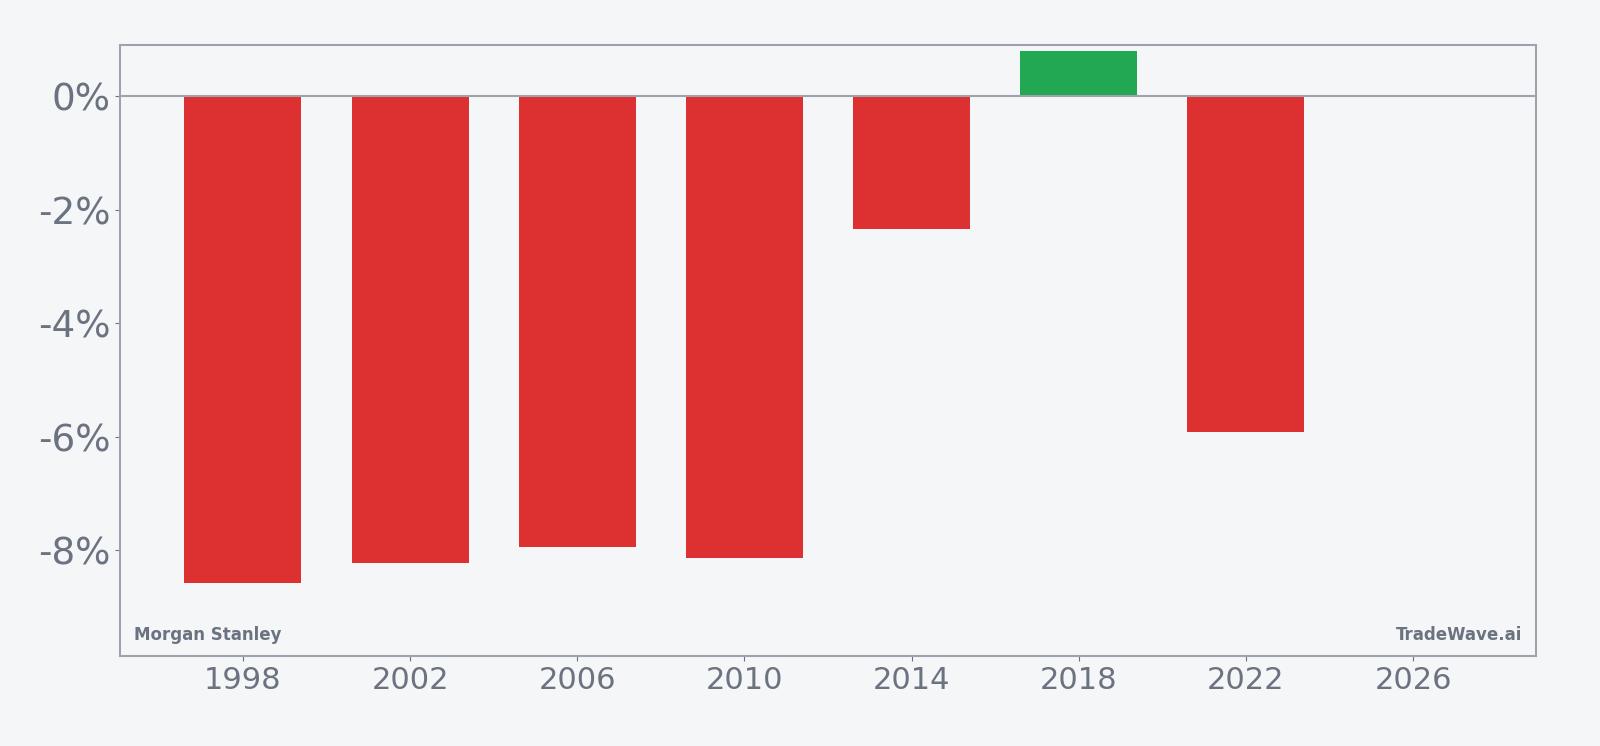
Morgan Stanley has fallen in 6 of 7 midterm-election-year windows starting around Apr 19, with an average 6.85% gain in winning years for the short side.
- 6 wins and 1 loss for the short side in this window, with winning years averaging 6.85% moves in the trade direction.
- The upcoming 29-day window begins on Apr 19, 2026 and is grouped across the last 7 midterm election years.
- Percent Profitable is 86%, with 6 winners and 1 loser for the historical short pattern.
- Including every year, Avg Profit - All is 6%, showing the window has still skewed negative for the stock overall.
- Maximum adverse excursions have reached double digits in several years, underscoring that intraperiod drawdowns can be sharp even when the short ultimately works.
- The TradeWave Ratio of 2.35 and a Sharpe ratio of 1.5 point to a historically efficient short window compared with typical noise.
According to historical data from TradeWave.ai, this specific midterm-election stretch has behaved very differently from an average spring for Morgan Stanley, and the next iteration is just days away.
How has Morgan Stanley (MS) traded in this midterm-year spring window?
Morgan Stanley has moved lower in 6 of the last 7 midterm-election-year windows that start around Apr 19, with the short side averaging a 6.85% gain in winning years. The stock closed Tuesday at 183.30, up 1.2% on the day and about 3.8% below its 52-week high of 190.57, after a strong 17.75% run over the past month.
Because this pattern is grouped by the presidential election cycle, it only looks at midterm election years, not every calendar year. That matters in 2026, which is the midterm election year in the current cycle, since policy debates around regulation, capital rules and fiscal priorities can reshape expectations for large banks in ways that repeat from one midterm to the next.
This seasonal window begins on Apr 19, 2026 and spans 29 trading days. Historically, during this period, Morgan Stanley has tended to drift lower, which is favorable for the short trade direction that the pattern tracks. Percent Profitable sits at 86%, with 6 winning short years and just 1 losing year across the last seven midterm-election samples.
In the winning years for the short side, the average move in the trade direction has been 6.85%, while including every year in the sample brings the Avg Profit - All to 6%. That gap shows the lone losing year did not fully offset the downside bias, even though it did trim the overall average. The median outcome of 7.93% in the trade direction reinforces that most iterations have delivered a meaningful move rather than a marginal drift.
The TradeWave Ratio of 2.35 indicates that, within this window, price has typically traveled a substantial distance in the short direction relative to normal noise. The Sharpe ratio of 1.5, based on end-of-window outcomes, points to a historically attractive risk-adjusted profile for traders who were positioned with the trend of this pattern rather than against it.
Looking at individual years, 2002 stands out as one of the strongest short setups, with a net return of -8.22% for the stock and a worst intraperiod drawdown of -20.16% from the entry price. In 2010, the stock finished the window down 8.13%, but at one point rallied 9.24% against the short before rolling over, a reminder that even “good” years for the pattern have included sharp squeezes.
The weakest year for the short side was 2018, when Morgan Stanley finished the window up 0.79%, turning it into the lone losing sample for this pattern. Even there, the stock saw a maximum adverse move of -8.35% from the entry, which would have been favorable for shorts at the lows before the rebound into the close of the window.
The historical seasonal trend line slopes steadily in favor of the short side, with much of the move typically accruing in the middle of the 29-day stretch rather than at the very start. That profile suggests prior cycles often saw an initial period of hesitation before the downside gathered momentum.
A closer look at yearly net returns alongside best and worst intraperiod swings shows how often this window has delivered both tradable downside and sharp countertrend rallies.
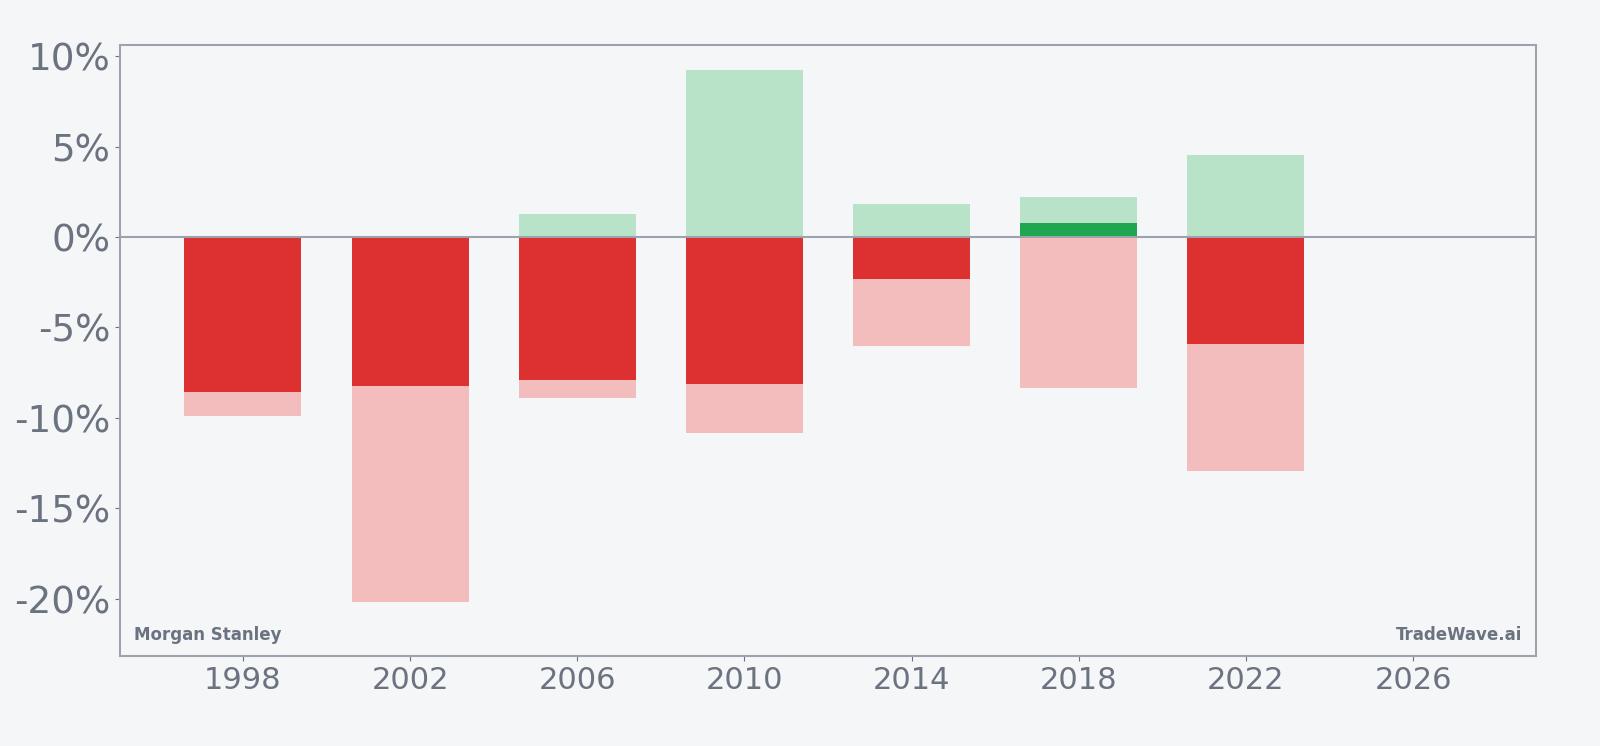
The combined net, MFE and MAE bars show a consistent pattern of sizable favorable moves for shorts, often paired with double-digit adverse swings inside the same window. Large maximum favorable excursions alongside deep maximum adverse excursions flag this as a high-variance period where direction has usually resolved lower by the end, but the path has rarely been smooth.
History does not guarantee future results; adverse excursions (MAE) can be large even in winning windows.
Why does Morgan Stanley (MS) follow this seasonal pattern?
One likely driver is the way midterm election years cluster regulatory headlines, capital-rule debates and Fed policy uncertainty into the spring, which can weigh on large bank stocks even when the broader economy is stable. Analysts have also pointed to institutional portfolio repositioning around first-half earnings and stress-test expectations, which can trigger de-risking in financials during this part of the cycle. For a name like Morgan Stanley that sits at the intersection of trading, investment banking and wealth management, those flows may be enough to turn a quiet calendar window into a repeatable seasonal pattern.
What is driving Morgan Stanley (MS) today?
Morgan Stanley shares rose 1.2% Tuesday to 183.30, extending a sharp rebound that has left the stock about 3.8% below its 52-week high and still roughly 6% lower year to date. The move follows an Apr 7 call from UBS, which argued the stock is undervalued and could benefit from deregulation tailwinds that are not fully priced in, putting fresh buy-rated attention on a name that has already rallied nearly 18% over the past month.[1]
The chart below situates the latest move in its recent multi-month context, alongside a 60-day seasonal projection.
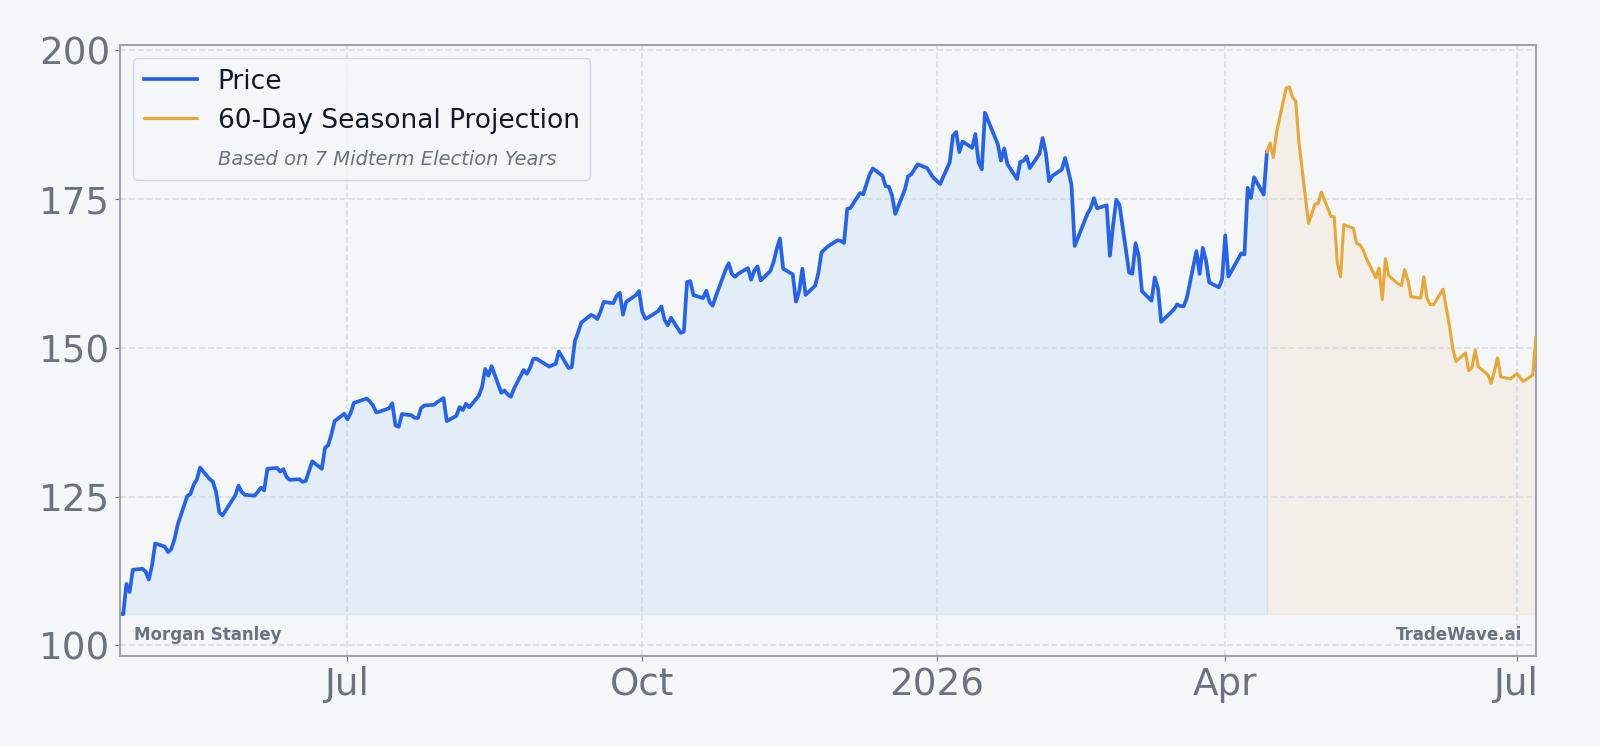
The current setup contrasts sharply with the historical midterm-year pattern. Morgan Stanley is coming into this window from a position of strength, supported by last year’s strong investment banking and trading results and a strategy that has leaned into wealth management and private markets, including the acquisition of EquityZen in Oct 2025 to deepen access to pre-IPO shares.[5][6] In Oct 2025, the bank reported a jump in third-quarter profit to $4.6 billion from $3.2 billion a year earlier, helped by a revival in dealmaking and equity underwriting, and executives signaled optimism about momentum into 2026 as rate cuts filter through markets.[3][5]
That backdrop means the upcoming seasonal window is not arriving in a vacuum. A bullish fundamental story, a supportive analyst call and a stock pressing toward its highs are all colliding with a midterm-year spring pattern that has historically favored shorts. For traders, the key question is not whether history repeats tick for tick, but how a strong tape behaves when it runs into a part of the calendar that has often produced sharp, if temporary, reversals.
What should traders watch in this upcoming window?
First, the calendar: the 29-day midterm-year window kicks off on Apr 19, so price action in the back half of April and into May will be the real test of whether the historical pattern still has teeth. A failure to hold recent gains near the 52-week high, especially if weakness clusters in that mid-window zone where prior years have tended to roll over, would line up with the established MS seasonal trend.
Second, levels: traders will be watching how Morgan Stanley behaves around the recent high near 190. If the stock pushes decisively through that area and holds, it would look more like the outlier 2018 pattern, when the short side lost money despite intraperiod downside. A rejection below that zone, particularly if accompanied by rising volume, would look more like the 1998, 2002 or 2010 playbook, where the stock ultimately finished the window down between roughly 6% and 9%.
Third, catalysts: while there is no imminent earnings date on the calendar, any updates on capital rules, deregulation efforts or dealmaking pipelines could interact with this window. In midterm election years, policy headlines have a habit of bunching up, and for a systemically important bank like Morgan Stanley, those shifts can quickly change how investors price risk across trading, investment banking and wealth management franchises.[3][5][6]
Finally, behavior inside the window will matter as much as the end result. If the stock sees a sharp early squeeze higher followed by a deeper pullback, it would echo prior years where maximum adverse moves against the short were large but the pattern still finished in the trade direction. If instead Morgan Stanley grinds sideways or trends higher throughout the 29 days, it would signal that the midterm-year seasonal bias is weakening in the face of a stronger fundamental and regulatory narrative.
Sources
- [1] CNBC, "Time to buy shares of Morgan Stanley, says UBS" (Apr 7, 2026).
- [3] CNBC, "Morgan Stanley slated to release third-quarter earnings" (Oct 15, 2025).
- [4] CNBC, "Five stocks with major upside following earnings, Morgan Stanley says" (May 10, 2025).
- [5] Reuters, "Morgan Stanley's third-quarter profit jumps on dealmaking boost" (Oct 15, 2025).
- [6] Reuters, "Morgan Stanley to buy private shares platform EquityZen" (Oct 29, 2025).
About this seasonal analysis
Seasonal pattern data is sourced from TradeWave.ai, which analyzes historical price behavior across annual calendar windows going back up to 30 years. Read the full data methodology or the book The 100-Year Pattern by Afshin Moshrefi (2026 edition). Past performance of seasonal patterns does not guarantee future results. This article is for informational purposes only and does not constitute investment advice.