Premarket Drop in Goldman Sachs (GS) Meets a Bearish Midterm-Year April Stretch
Goldman Sachs is up more than 50% this year, but a late-April midterm-year seasonal window that has usually favored the short side is about to open.

What is the seasonal pattern for Goldman Sachs (GS)?
Goldman Sachs has fallen in 5 of 6 midterm-year late-April windows during this 12-day stretch, with an average gain of 5.27% in winning short years.
- 5 wins and 1 loss for the short side in this window, with winning years averaging 5.27% moves in the trade direction.
- The upcoming 12-day Goldman Sachs trading window starts on Apr 21 and has been a historically bearish seasonal pattern for the stock.
- Percent Profitable is 83%, with 5 winning short years and just 1 losing year across the last 6 midterm election cycles.
- Avg Profit - All, which includes both winners and losers, is still a solid 4%, pointing to a consistent GS seasonal trend.
- Past windows have seen sizable intraperiod swings, with maximum favorable and adverse moves that highlight meaningful volatility for both shorts and longs.
- Add it up: a 28% cumulative return for the short side across these six midterm-year windows, paired with a Sharpe ratio of 1.54.
According to historical data from TradeWave.ai, this specific late-April stretch in midterm election years has behaved very differently from an average month for Goldman Sachs. The next section walks through how that pattern has played out and what it means as the 2026 window approaches.
How has Goldman Sachs (GS) traded in this midterm-year April window?
Goldman Sachs has delivered profitable short-side trades in 5 of the last 6 midterm-year windows that begin around Apr 21, with winning years averaging 5.27% moves in the trade direction over 12 trading days. Today the stock closed at $909.84, up 2.1% on the session and roughly 7.6% below its 52-week high of $984.70, after a powerful 51% year-to-date run that leaves it extended but still shy of recent peaks.[2]
This pattern is grouped by the presidential election cycle, focusing only on the last six midterm election years rather than consecutive calendar years. That matters because midterm years often bring a distinct policy and liquidity backdrop, with Washington noise, regulatory shifts and rate expectations combining into a different tape than in election or pre-election years.
The Trade Direction for this setup is short, which means the historical “wins” are years when GS finished the 12-day window lower than it started. Across those six midterm-year samples, the Percent Profitable reading is 83%, with 5 winners and 1 loser for the short side. Avg Profit of 5.27% reflects only the winning short years, while Avg Profit - All of 4% includes every year in the sample, including the one losing year.
On an annualized basis, the pattern translates into a 4.25% return for the short side, with a 28% cumulative gain across the six midterm-year windows. The Sharpe ratio of 1.54 signals that, historically, the risk-adjusted outcome of this GS seasonal trend has been relatively strong for such a short 12-day stretch.
Looking at individual years, 2022 stands out as the strongest short window, with Goldman Sachs dropping 7.14% from entry to exit and experiencing a worst intraperiod drawdown of 9.6% from the starting level. At the other end of the spectrum, 2014 was the lone losing year for shorts, with the stock edging 0.68% higher over the window despite a maximum favorable move of 2.73% at one point before reversing.
Those intraperiod swings are captured by the maximum favorable excursion and maximum adverse excursion metrics, which track the best run-up and worst drawdown from the entry price during the window. In several years, GS offered shorts a favorable move of 5% or more at some point, but the worst adverse moves also reached into the mid- to high-single digits, underscoring that this has been a volatile slice of the calendar rather than a slow drift lower.
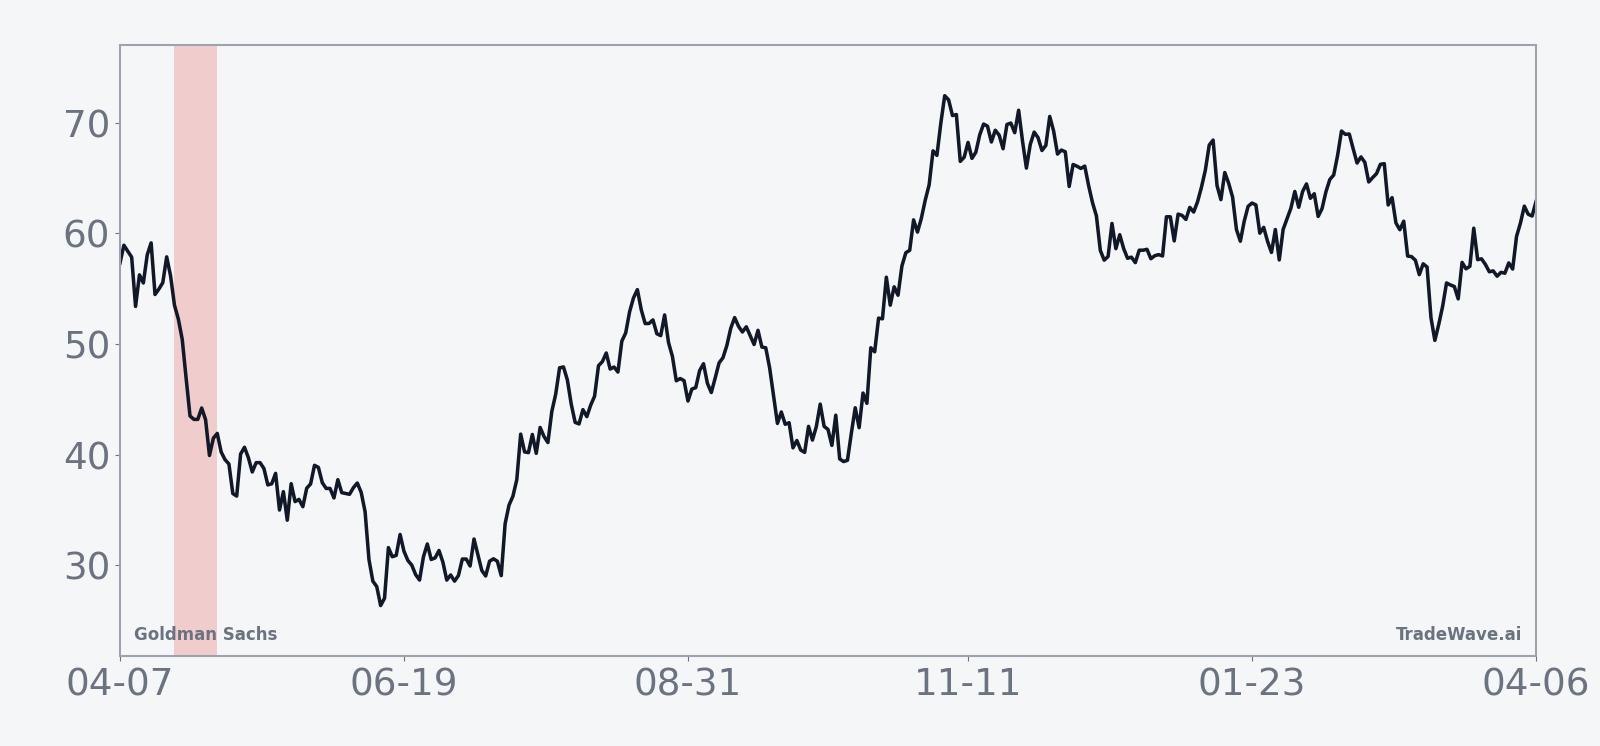
The historical seasonal average for this midterm-year window shows Goldman Sachs typically softening early in the 12-day stretch, with most of the short-side gains accruing in the first week before price action flattens out. That profile suggests that when the pattern has worked, it has tended to work quickly rather than grinding lower over the full period.
A second view combines yearly net results with the best and worst intraperiod swings to show how far GS has tended to travel in both directions.
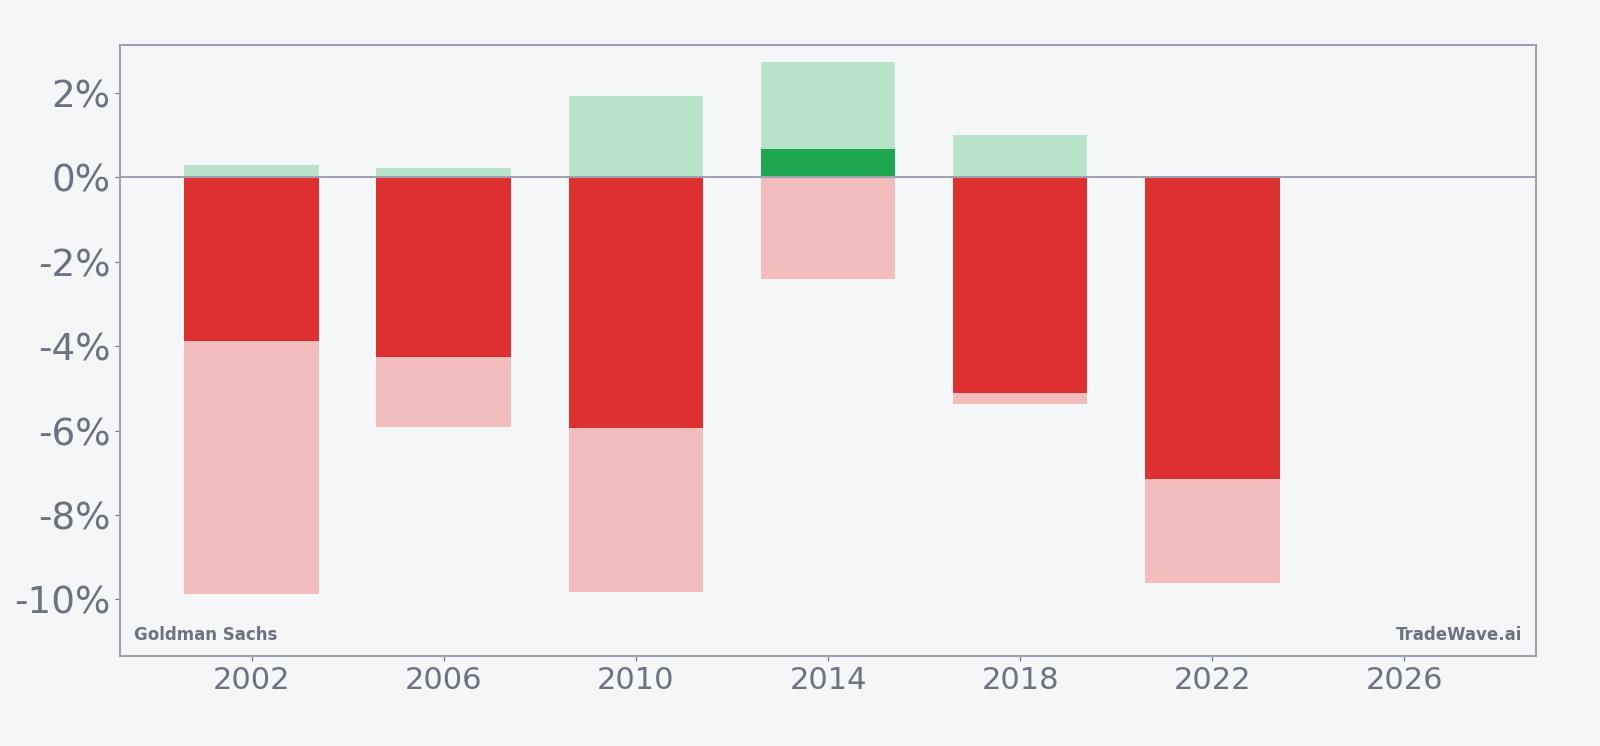
History does not guarantee future results, and even in winning short windows the worst intraperiod drawdowns (MAE) have sometimes been large.
Why does Goldman Sachs (GS) follow this seasonal pattern?
One likely driver is the way midterm election years cluster regulatory headlines, rate expectations and risk-taking appetite around the spring earnings season for big banks. Analysts have pointed to dealmaking pipelines, capital-markets calendars and institutional portfolio repositioning as forces that can briefly pressure investment-bank shares even in otherwise strong years.[2] For Goldman Sachs, that mix may translate into a short, sharp adjustment period in late April where traders rebalance exposure after digesting first-quarter results and updated guidance.
What is driving Goldman Sachs (GS) today?
Goldman Sachs closed Wednesday at $909.84, up 2.1% on the day, extending a powerful 51% year-to-date rally that has pushed the stock to within about 7.6% of its 52-week high even after a volatile earnings week.[2] On Apr 13, the bank reported first-quarter 2026 earnings per share of $17.55 versus a $16.39 consensus and revenue of $17.2 billion against expectations of $16.93 billion, but the stock initially traded lower premarket as investors focused on softer net interest income and higher provisions for credit losses.[2]
The latest numbers keep the focus squarely on Goldman’s investment-banking and trading engines, which have been benefiting from a rebound in dealmaking and capital markets activity. Analysts expect that a potential record M&A cycle in 2026 could push full-year earnings above $60 per share, reinforcing the narrative that Goldman is one of the cleanest ways to play a renewed corporate transaction boom.[3] At the same time, the bank’s own strategists have been leaning into themes like “AI-resilient” software baskets, underscoring how GS is trying to stay in front of secular shifts in client demand.[7]
That backdrop helps explain why the stock has outpaced many financial peers despite a 2025 downgrade from JPMorgan, which argued that cheaper rivals offered better value at the time.[5] Since then, Goldman’s profit trajectory has been supported by a surge in advisory and underwriting fees, with Q3 2025 investment banking revenue jumping 42% year-on-year as dealmakers cashed in on a wave of large transactions.[1][4] The question for traders heading into this midterm-year seasonal window is whether that fundamental strength will overpower a calendar stretch that has historically leaned against the stock.
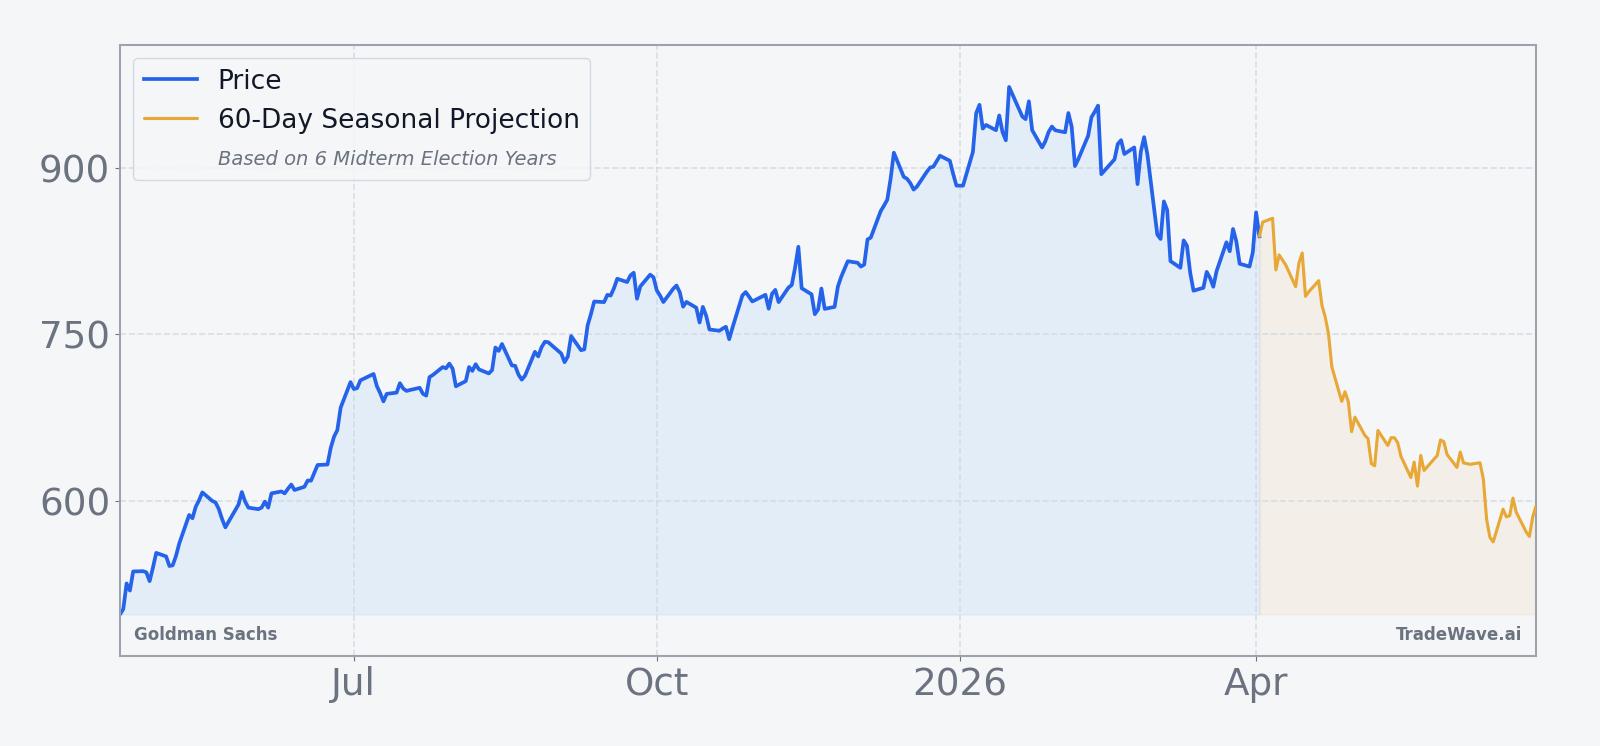
The chart below situates the latest move in its recent multi-month context and overlays a 60-day seasonal projection.
What should traders watch in this Goldman Sachs (GS) window?
The first marker is timing: the 12-day seasonal window begins on Apr 21, shortly after Goldman’s Q1 earnings and in the early part of the midterm election year. Historically, the short-side gains in this pattern have tended to show up early in the window, so traders will be watching how GS behaves in the first week relative to its recent uptrend.
Second, price levels matter. With the stock roughly 7.6% below its 52-week high and well above its 50-day moving average of $877.09, any pullback toward that moving average during the window would be consistent with prior midterm-year behavior, while a clean breakout toward or through the $984.70 high would look more like the lone losing year for the short side.[2] Volume relative to the 20-day average of about 2.03 million shares will also help gauge whether any move is driven by real positioning shifts or just noise.
Third, the macro and policy calendar will be in focus. A record M&A backdrop, shifting expectations for Federal Reserve policy and any new regulatory headlines around capital rules or trading activities could all interact with this GS seasonal trend.[3][4] If deal announcements and underwriting pipelines stay hot through late April, the stock may find support even in a historically soft stretch; if risk appetite cools, the pattern’s short-side bias could reassert itself.
Finally, traders will be tracking how Goldman’s leadership in investment banking and its thematic products, such as the AI-resilient software basket, influence sentiment around the name.[7] Strong follow-through in those franchises could blunt the typical midterm-year pullback, while any disappointment or guidance reset would line up with the historical tendency for a quick, sharp adjustment in this specific Goldman Sachs trading window.
Sources
- Seeking Alpha: Goldman Sachs stock dips after Q3 expenses, headcount climb; earnings and revenue beat (Oct 14, 2025)
- Seeking Alpha: Goldman Sachs Q1 earnings beat, but NII, credit loss provision disappoint (Apr 13, 2026)
- Reuters: Goldman's profit beats estimates as dealmaking rebound boosts investment banking (Oct 14, 2025)
- CNBC: JPMorgan downgrades Goldman Sachs, favors cheaper rivals (Oct 21, 2025)
- Seeking Alpha: Goldman unveils AI-resilient trade basket for software sector (Feb 14, 2026)
About this seasonal analysis
Seasonal pattern data is sourced from TradeWave.ai, which analyzes historical price behavior across annual calendar windows going back up to 30 years. Read the full data methodology or the book The 100-Year Pattern by Afshin Moshrefi (2026 edition). Past performance of seasonal patterns does not guarantee future results. This article is for informational purposes only and does not constitute investment advice.