Morgan Stanley (MS) Q1 Volatility Meets a Midterm Stretch That Has Favored Short-Side Declines
Morgan Stanley is trading near a record high just as a midterm-year seasonal window that has usually favored the short side gets underway, putting a spotlight on near-term downside risk and volatility.

What is the seasonal pattern for Morgan Stanley (MS)?
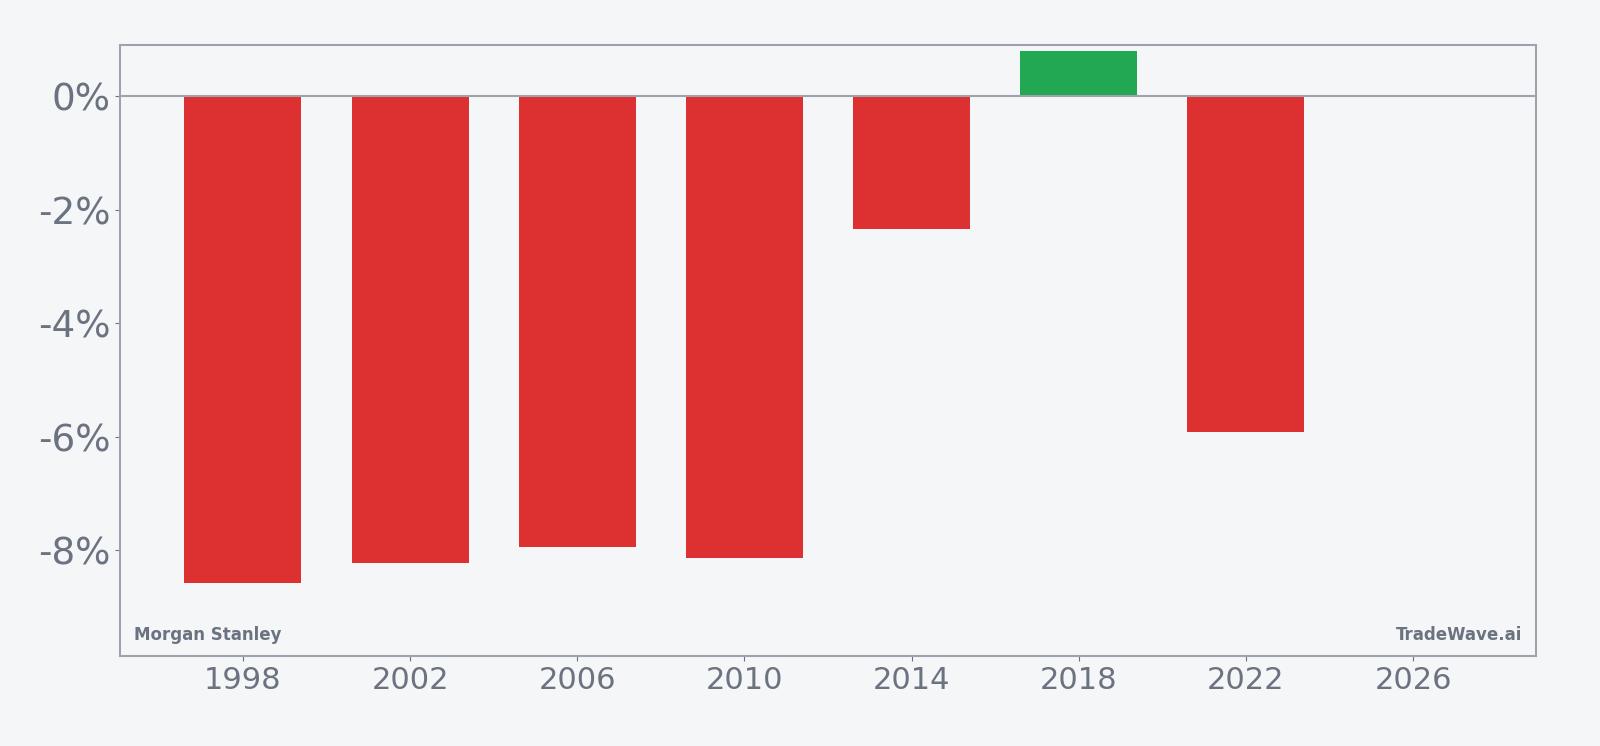
Morgan Stanley has fallen in 6 of 7 midterm-year spring windows during this 29-day stretch, with an average gain of 6.85% in winning years for the short side.
- 6-for-7 record in this window, with the short side winning in 6 years and losing in 1.
- The 29-day midterm-year window begins on Apr 19 and has historically leaned bearish for Morgan Stanley.
- Percent Profitable is 86%, with 6 winners and 1 loser for the short trade setup.
- Average profit in winning years is 6.85%, while Avg Profit - All, including the lone losing year, is 6%.
- The TradeWave Ratio of 2.35 signals that price has typically moved meaningfully in the trade direction within the window.
- Intraperiod swings have been sharp, with sizable best-case rallies for shorts and deep adverse moves in weaker years.
According to historical data from TradeWave.ai, this specific midterm-year spring stretch has behaved very differently from an average month for Morgan Stanley. The next section walks through what that pattern has looked like in past cycles and how it frames the current setup.
How has Morgan Stanley (MS) traded in this midterm-year spring window?
Morgan Stanley has delivered profitable short trades in 6 of the last 7 midterm election years during this 29-day window, with an average 6.85% gain in winning years and a 6% average across all years. The current iteration of that window began on Apr 19 and arrives with the stock at $190.70, essentially flat to its 52-week high of about $190.57, leaving almost no cushion if the historical pattern reasserts.
The presidential election cycle matters here because this pattern only looks at the last seven midterm election years, a phase that has often featured policy uncertainty, regulatory noise and choppy risk appetite for large financials. Grouping by the midterm year strips out cleaner bull-market stretches and focuses on how Morgan Stanley has behaved when Washington is in the middle of a term and markets are digesting earlier policy moves.
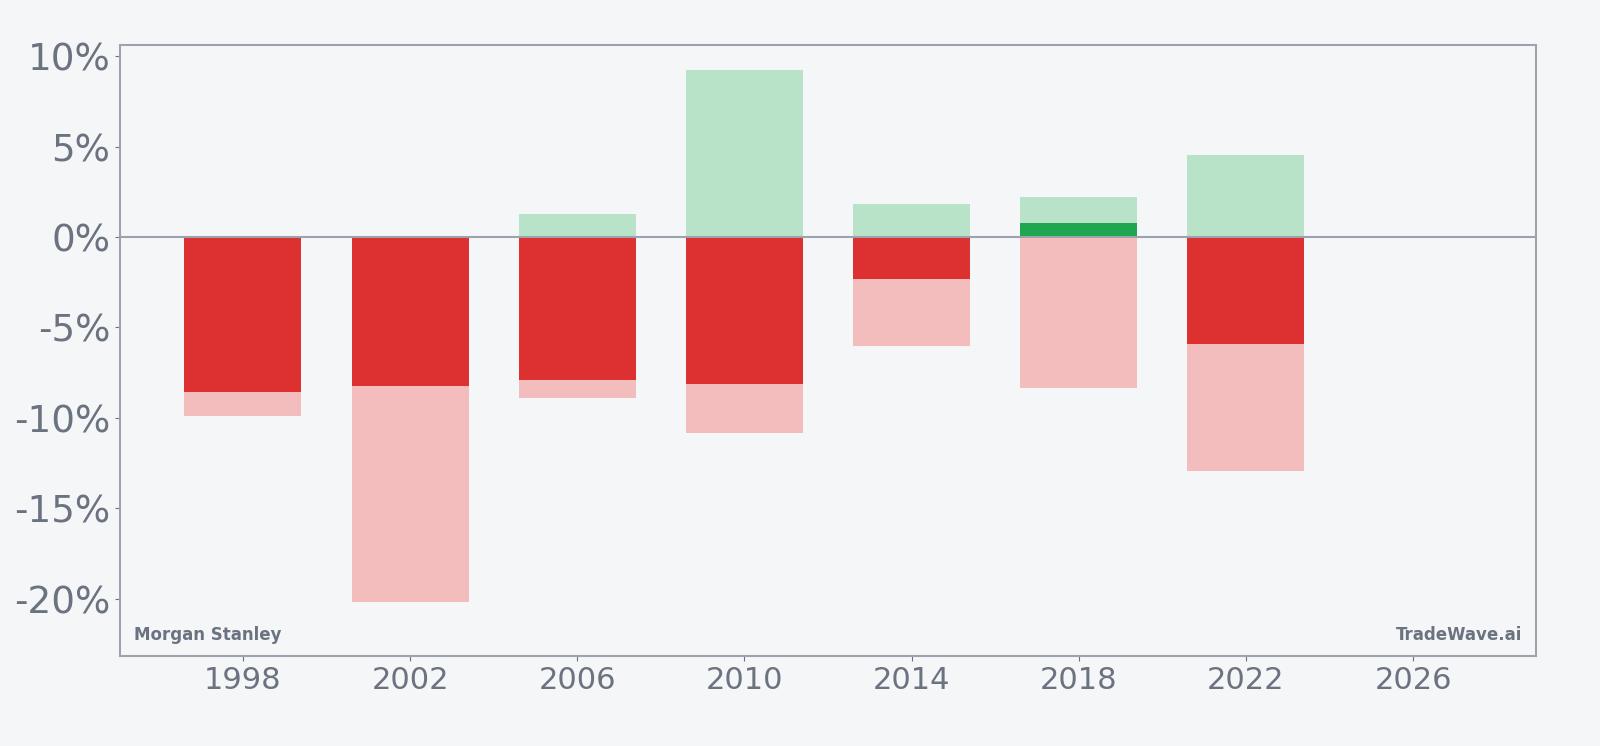
A second view layers in both the best and worst intraperiod swings for each year.
Historically, the short side has been favored in this window, with 86% of midterm-year samples ending lower over the 29 days. Average profit of 6.85% in winning years means that when the pattern has worked, it has not been a marginal drift but a meaningful slide, while the 6% Avg Profit - All shows that the lone losing year did not fully offset those gains.
The per-year table highlights 2002 as one of the strongest years for the pattern, with a net return of -8.22% for the stock and a worst intraperiod drawdown of -20.16% from the entry price, a reminder that adverse moves inside the window can be much larger than the final result. On the other side, 2018 stands out as the weakest year for shorts, with a small 0.79% net gain for the stock and a maximum adverse move of -8.35% against the short before it recovered.
The maximum favorable excursions, which capture the best point-to-peak move in the trade direction, have often been sizable even in years where the final net return was more modest. In 2010, for example, the stock finished the window down 8.13% but at one point had rallied 9.24% against the short before rolling over, illustrating how noisy the path can be even when the short ultimately wins.
The cumulative return chart for this pattern, which stacks each midterm-year outcome into a single running total, shows a steady downward bias rather than a one-off anomaly. Losses for the stock cluster across multiple cycles, and the cumulative line trends lower across the seven midterm years, consistent with the 47% cumulative return figure for the short side.
Put together, the message is straightforward: in the last seven midterm election years, this late-April to mid-May window has usually rewarded traders positioned for weakness in Morgan Stanley, but the ride has often involved sharp countertrend swings along the way.
History does not guarantee future results, and even in winning years the worst intraperiod drawdowns have been large enough to challenge risk limits.
Why does Morgan Stanley (MS) follow this seasonal pattern?
One likely driver is the way earnings and capital-markets calendars line up in midterm election years, with first-quarter results, guidance resets and deal pipelines all hitting as Washington debates policy and regulation. Analysts have pointed to institutional portfolio repositioning around these Q1 prints, especially in investment banks, as managers adjust exposure to advisory and trading revenue. The pattern may also reflect sector rotation as investors shift between financials and growth stocks depending on how the macro and policy backdrop looks heading into the summer of a midterm year.
What is driving Morgan Stanley (MS) today?
Morgan Stanley shares closed at $190.70 on Apr 21, up 1% on the day and sitting about 0.1% above their 52-week high of roughly $190.57, after a strong run that has lifted the stock 17.75% over the past month. The move comes on the heels of first-quarter earnings on Apr 15, where Wall Street expected $3 per share in earnings on $19.72 billion in revenue, with investors focused on whether a rebound in investment banking and trading could sustain the rally.[1]
In the run-up to that report, UBS reiterated a Buy rating and a $196 price target, arguing that Morgan Stanley’s wealth management franchise and improving deal activity left room for further upside even after the stock’s sharp climb.[3] That target sits only modestly above the current price, which means a lot of that optimism is already embedded in the tape.
Earlier results provide some context for why expectations have been high. In Oct 2025, Morgan Stanley reported third-quarter revenue of $18.2 billion and net income of $4.6 billion, helped by a revival in equity underwriting and a steadier backdrop for wealth management fees.[5] Two weeks later, the bank agreed to acquire private-shares platform EquityZen to deepen its reach into pre-IPO markets, a move aimed at keeping high-net-worth clients engaged with private growth stories even as public markets matured.[6]
The chart below situates the latest move in its recent multi-month context and overlays a 60-day seasonal projection.
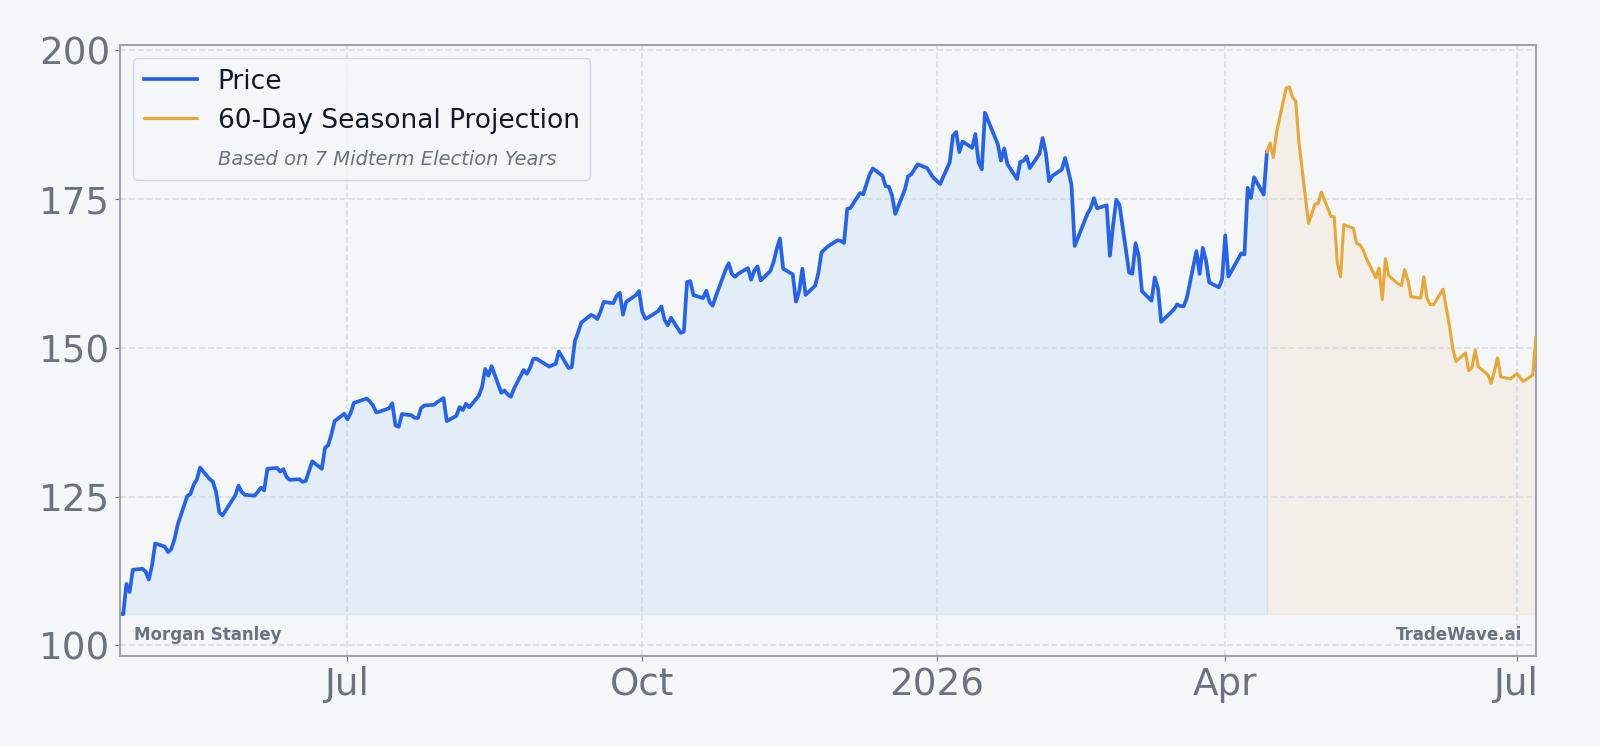
The combination of a near-record share price, upbeat analyst stance and a historically bearish midterm-year window creates a tension that traders will be watching closely. If the stock continues to grind higher despite the seasonal headwind, it would mark a clear break from the last seven midterm cycles. If instead volatility picks up and the stock starts to give back some of its recent gains, the pattern would once again be doing quiet work in the background.
What should traders watch in this Morgan Stanley (MS) window?
First, price levels matter. With Morgan Stanley effectively at its 52-week high, any failure to hold the $190 area during this 29-day window would be an early sign that the historical midterm-year pattern is reasserting. A quick slide back toward the 50-day moving average around $168.84 would fit prior years where the short side has worked.
Second, earnings follow-through will be key. The stock’s reaction to post-earnings commentary on investment banking pipelines, trading revenue and wealth management flows will help determine whether the recent rally has overshot fundamentals or simply front-ran a stronger profit trajectory.[1] Watch how the stock trades on high-volume days tied to macro data or policy headlines, which have often amplified moves for large banks in midterm years.
Third, monitor sector rotation. If investors start rotating out of financials and back into growth or defensives as the policy calendar heats up, Morgan Stanley could feel disproportionate pressure given its strong recent outperformance. Conversely, a continued bid for bank stocks would argue that this midterm-year window may be less hostile than history suggests.
Finally, behavior inside the window will tell you whether the pattern still has teeth. A choppy tape with sharp intraday reversals and failed breakouts near the highs would rhyme with prior midterm-year springs, where maximum adverse and favorable excursions were both large before the stock settled lower. A clean breakout and steady grind higher through mid-May would be a clear contradiction of the historical script and a sign that this cycle is writing its own story.
Sources
- [1] CNBC, "Morgan Stanley is set to report first-quarter earnings — here's what the Street expects" (Apr 15, 2026).
- [3] CNBC, "Time to buy shares of Morgan Stanley, says UBS" (Apr 7, 2026).
- [4] CNBC, "Morgan Stanley slated to release third-quarter earnings" (Oct 15, 2025).
- [5] Reuters, "Morgan Stanley's third-quarter profit jumps on dealmaking boost" (Oct 15, 2025).
- [6] Reuters, "Morgan Stanley to buy private shares platform EquityZen" (Oct 29, 2025).
- [7] Reuters, "Morgan Stanley shares fall despite earnings beat, as investment banking revenue shrinks" (Jul 16, 2025).
About this seasonal analysis
Seasonal pattern data is sourced from TradeWave.ai, which analyzes historical price behavior across annual calendar windows going back up to 30 years. Read the full data methodology or the book The 100-Year Pattern by Afshin Moshrefi (2026 edition). Past performance of seasonal patterns does not guarantee future results. This article is for informational purposes only and does not constitute investment advice.