ASML Holding (ASML) Slides After Q1 Beat as 5-Day Midterm Weak Window Approaches
ASML Holding is pulling back from record highs after a post-earnings slide, just as a historically bearish five-day midterm-election-year trading window approaches.

What is the seasonal pattern for ASML Holding (ASML)?
ASML Holding has fallen in 7 of 7 midterm-election-year windows during this late-April five-day stretch, with an average gain of 3.48% in winning short trades.
- 7 for 7 in this window for short trades, with average winning returns of 3.48% over five trading days.
- The upcoming window runs from Apr 24, 2026, for five sessions and has historically favored downside moves in ASML Holding.
- Percent Profitable is 100%, with 7 winners and 0 losers across the last seven midterm election years.
- The TradeWave Ratio of 1.91 indicates price has typically traveled meaningfully in the short direction within the window.
- A Sharpe ratio of 1.55 points to a strong risk-adjusted profile for this specific short-side seasonal pattern.
- Intraperiod swings have included sharp adverse moves in some years, so short setups have not been low-volatility rides.
According to historical data from TradeWave.ai, this late-April stretch in midterm election years has behaved very differently from an average week for ASML Holding, and the next iteration is just days away.
How has ASML Holding (ASML) traded in this late-April midterm window?
ASML Holding has fallen in all seven midterm-election-year windows that start around Apr 24, with short trades averaging 3.48% gains over five days. The next window begins on Apr 24, 2026, as the stock trades at 1,410.83, up about 25% year to date and roughly 8.8% below its 52-week high of 1,547.22.[2]
Grouping the data by the presidential election cycle matters here because this pattern only shows up in midterm election years, a phase that often brings policy uncertainty and choppier trading for high-multiple growth stocks. The current calendar year is the midterm election year, and this window aggregates the last seven times ASML traded through this same phase of the political and liquidity cycle.
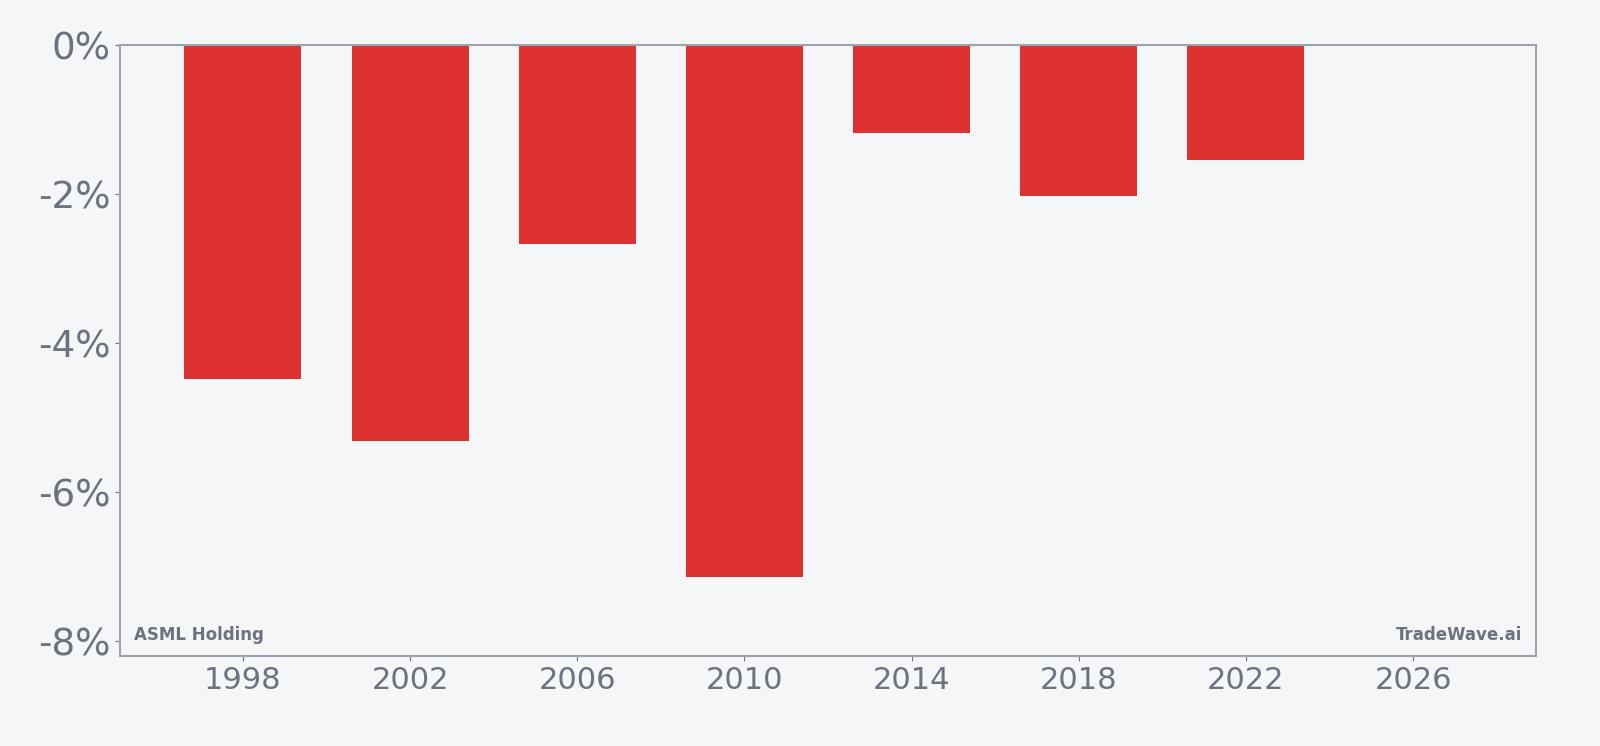
Trade direction for this setup is explicitly short, so negative returns in the per-year table represent profitable years for the pattern. Across the seven midterm-election-year samples, every instance shows ASML finishing the window lower than it started, with net returns ranging from a 1.19% drop in 2014 to a 7.14% slide in 2010. Add it up: cumulative return for the short strategy across these seven windows is 26%, with a median profit of 2.67% and annualized return of 3.46%.
The historical seasonal trend line slopes steadily lower across the five days, with most of the move typically occurring early in the window. That profile fits the strongest year in the sample, 2010, when the stock dropped 7.14% from entry to exit and saw its worst intraperiod drawdown of 8.04% from the starting price. Even in milder years like 2018, the pattern still delivered a 2.03% net decline for ASML over the stretch.
A stacked view of net returns alongside best and worst intraperiod swings shows how much room ASML has historically given both shorts and longs during this week.
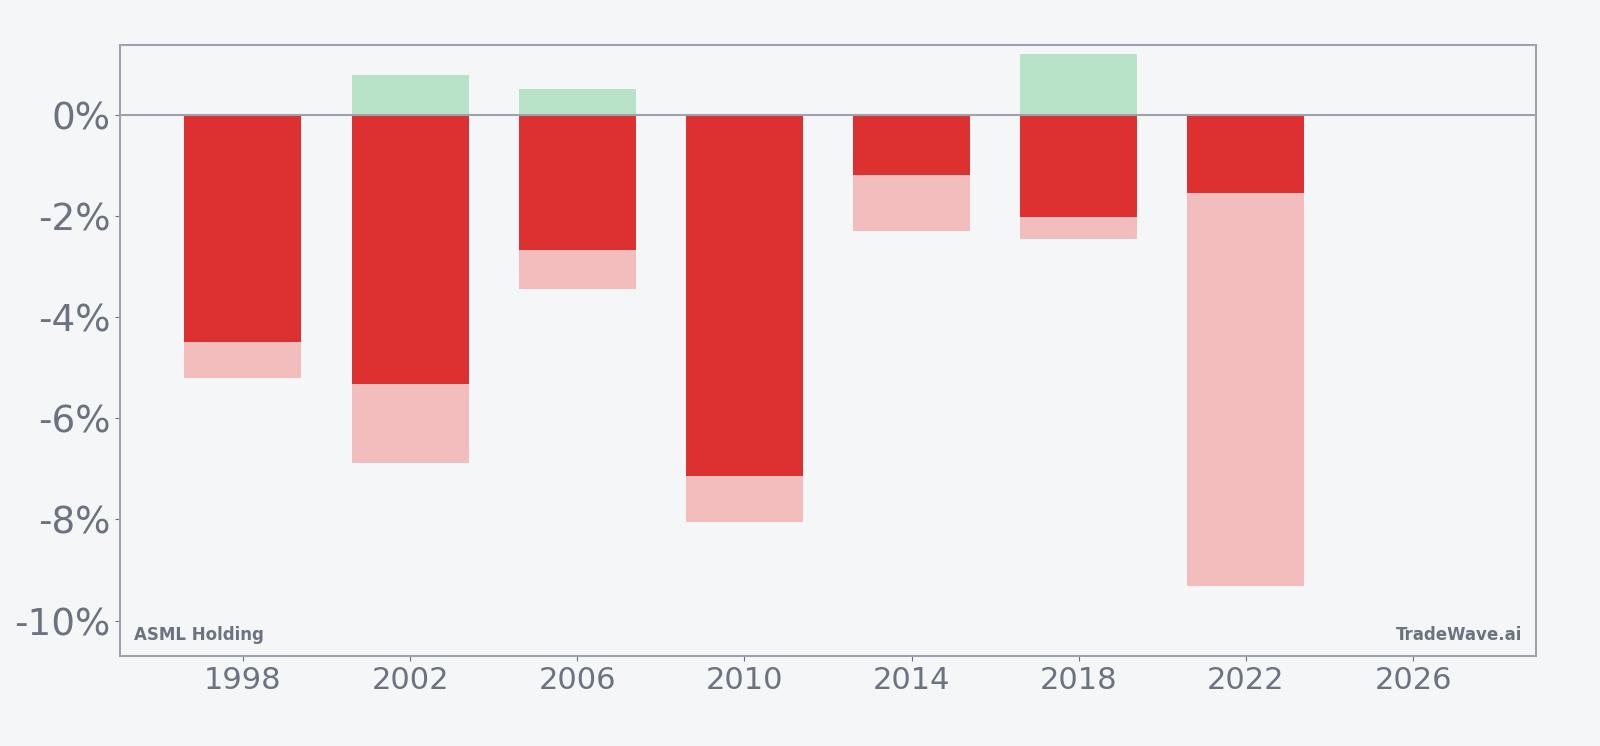
The maximum favorable move for shorts has often been sizable, with several years showing intraperiod declines beyond the final net result, while maximum adverse moves have occasionally been deep enough to squeeze weak hands. In 2022, for example, the short trade finished ahead with a 1.55% gain, but the worst intraperiod drawdown from entry was 9.31%, underscoring how punishing the path could be even in a winning year. The pattern is clear: this window has favored short exposure in 7 of 7 midterm-election-year samples, but it has not been a straight line.
History does not guarantee future results, and adverse excursions can be large even in windows that ultimately finish profitable for the historical pattern.
Why does ASML Holding (ASML) follow this seasonal pattern?
One likely driver is the way midterm-election-year uncertainty intersects with ASML’s earnings and capex news flow in late April, when chipmakers and foundries often update spending plans. Analysts have pointed to institutional portfolio repositioning around these updates, which can hit high-valuation semiconductor equipment names hardest when guidance or macro tone is even slightly cautious. This pattern may also reflect options expiration and hedging flows around early-quarter results, which can amplify short-term downside in a stock that has rallied into earnings.
What is driving ASML Holding (ASML) today?
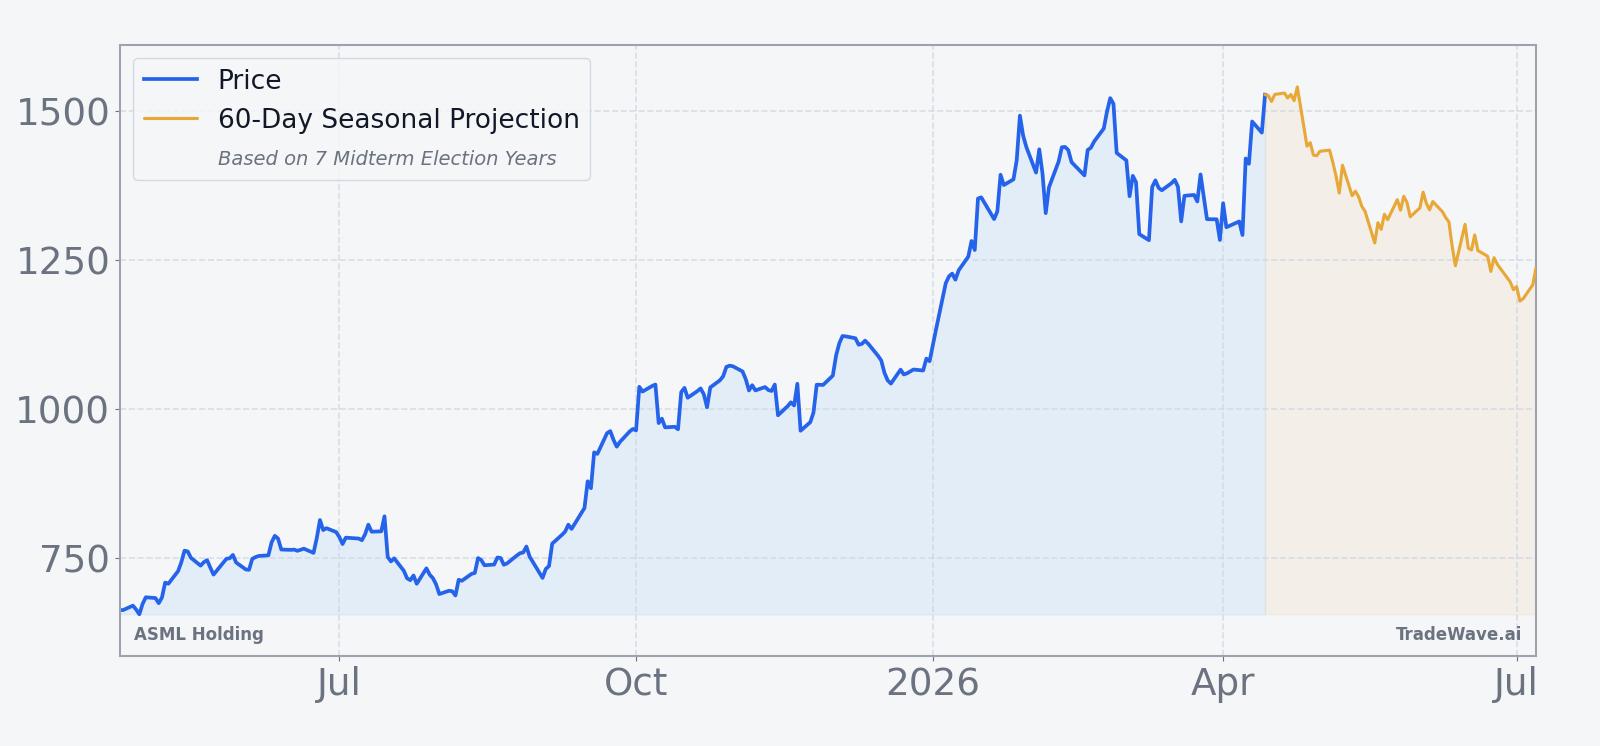
ASML Holding closed at 1,410.83 on Apr 17, down 4.8% on the day and roughly 8.8% below its 52-week high, though the stock remains up about 25% year to date.[2] The pullback follows Q1 2026 results on Apr 15, when ASML beat earnings estimates with 7.15 euros per share on 8.77 billion euros in sales, raised full-year guidance, and still saw the stock sell off as investors questioned how much AI-driven demand was already priced in.[2] Earlier in the year, ASML reported record orders and a stronger outlook for 2026, reinforcing its central role in the AI chip buildout even as near-term volatility has picked up around each data point.[5][6][7]
The chart below shows ASML’s sharp run into record territory, the recent reversal, and a 60-day seasonal projection overlaying the next leg of the election-cycle pattern.
Strategically, ASML sits at the center of the semiconductor equipment sector, with AI-related capex from foundries and memory makers driving record bookings and a series of analyst upgrades through late 2025 and early 2026.[3][4][8][9] That backdrop has pushed the stock into the upper end of its historical valuation range, which can magnify reactions when macro headlines or trade tensions flare, as seen in prior episodes where ASML sold off on export-control worries and tariff chatter.[1][10] The tension heading into this year’s late-April midterm window is straightforward: the fundamental story remains strong, but the stock is rich, expectations are high, and the historical seasonality for this specific week has leaned consistently bearish for the underlying shares.
What should traders watch in this upcoming window?
First, the calendar: the five-day midterm-election-year window starts on Apr 24 and runs through the end of that week, so price action in the sessions immediately before entry will shape how stretched or oversold ASML looks going in. Second, levels: traders will be watching whether the stock holds above its 50-day moving average around 1,395 or retests the recent intraday low near 1,406.50, since breaks below those zones have often coincided with the sharper historical declines inside this pattern.[2] Third, behavior: if ASML starts the window with early-session weakness and closes near the lows, that would line up with the historical tendency for downside to cluster in the first few days; a firm bid and quick reclaim of post-earnings losses would contradict the pattern and signal that AI demand and institutional support are overwhelming the usual midterm chop. Finally, watch the broader semiconductor tape and macro headlines around AI capex and trade policy, because in prior cycles, sector-wide risk-off days have often been the catalyst that turned this statistically bearish week into a meaningful short-term air pocket for ASML.
Sources
- CNBC, "ASML hits record high on AI boost" (Jan 16, 2026).
- The Motley Fool, "Why ASML Stock Is Sinking Today" (Apr 15, 2026).
- CNBC, "UBS upgrades ASML" (Sep 5, 2025).
- CNBC, "Morgan Stanley upgrades ASML" (Sep 22, 2025).
- MarketWatch, "ASML bookings blow past estimates" (Jan 28, 2026).
- The Wall Street Journal, "ASML Ends 2025 With Record Orders" (Jan 28, 2026).
- Reuters, "ASML lifts outlook on record AI chip orders" (Jan 28, 2026).
- Yahoo Finance, "ASML Jumps on Analyst Double Upgrade" (Jan 2, 2026).
- CNBC, "ASML poised for breakout in AI chip boom" (Oct 28, 2025).
- Barron's, "ASML Stock Drops Due to Trade War Worries" (Jan 19, 2026).
About this seasonal analysis
Seasonal pattern data is sourced from TradeWave.ai, which analyzes historical price behavior across annual calendar windows going back up to 30 years. Read the full data methodology or the book The 100-Year Pattern by Afshin Moshrefi (2026 edition). Past performance of seasonal patterns does not guarantee future results. This article is for informational purposes only and does not constitute investment advice.