MicroStrategy (MSTR) Has Rallied in 6 of 6 Midterm Windows From May 14, Averaging 34.53% Gains
MicroStrategy is heading toward a 311-day midterm-election-year seasonal window that has never been negative in this sample, even as the stock trades well below its 52-week high and remains tightly hitched to Bitcoin.

What is the seasonal pattern for MicroStrategy (MSTR)?
MicroStrategy has risen in 6 of 6 midterm-election-year windows starting around May 14, with an average gain of 34.53% in winning years.
- 6 for 6 in this window, with MicroStrategy averaging 34.53% gains across all winning years.
- The upcoming midterm-election-year window begins May 14, 2026 and runs for 311 trading days, covering most of the midterm and pre-election stretch.
- Percent Profitable is 100%, with 6 winners and 0 losers in the historical sample.
- Average winner gains cluster around a 36.52% median profit, with a cumulative return of 475% across the six cycles.
- Intraperiod swings have been large, including a worst-case drawdown of about 76% in 2002 before the trade finished higher.
- The TradeWave Ratio of 1.96 and Sharpe ratio of 2.11 point to strong upside travel in the trade direction relative to volatility in this MicroStrategy trading window.
According to historical data from TradeWave.ai, this is one of the more distinctive election-cycle windows in MicroStrategy’s history, and the next iteration is less than a month away.
How has MicroStrategy (MSTR) traded in this midterm-year seasonal window?
Grouping by the presidential election cycle shows that MicroStrategy’s strongest seasonal stretch in midterm years has often lined up with policy uncertainty giving way to clearer fiscal and regulatory paths. This specific seasonal window begins on May 14 and spans 311 trading days, and historically MicroStrategy has risen in all 6 of the last midterm-election-year cycles during this period, averaging 34.53% gains with a 36.52% median profit. The trade direction for this pattern is long, so the historical bias has favored upside exposure rather than hedging or shorting.
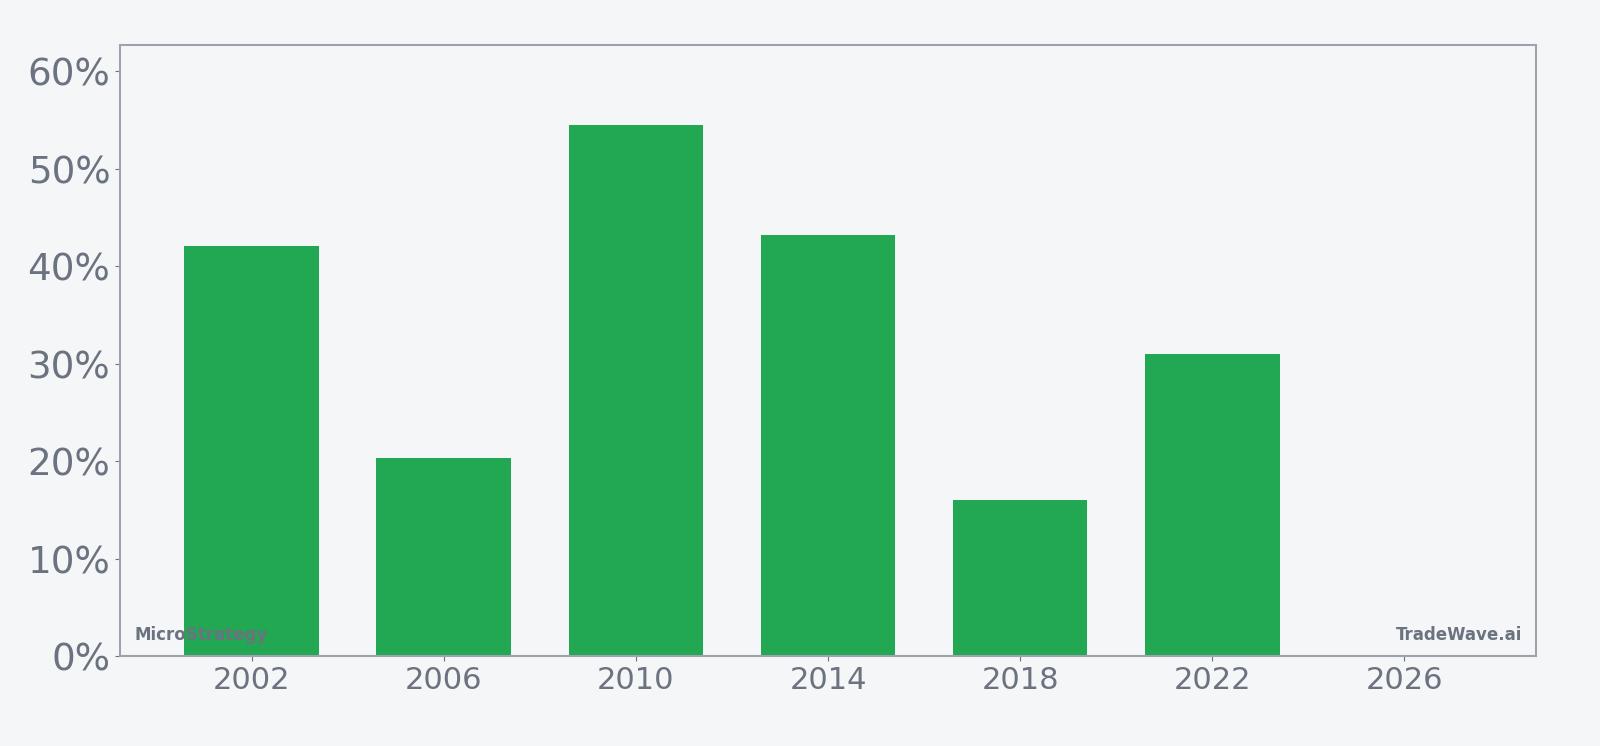
Year-by-year bars with maximum favorable and adverse moves show how often rallies have come with deep drawdowns along the way.
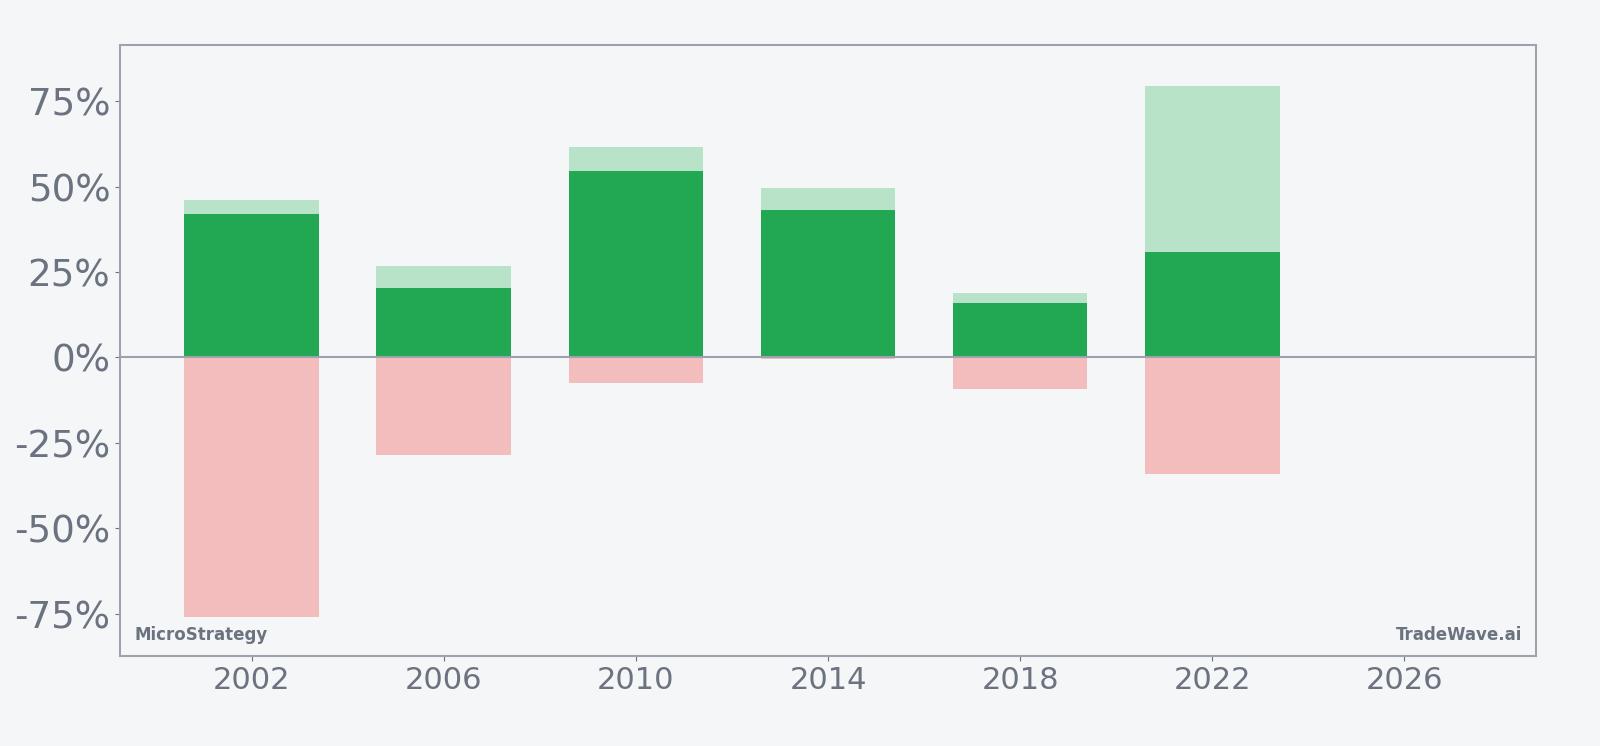
The per-year breakdown shows how uneven the ride has been even in winning seasons. In 2002, for example, MicroStrategy finished the window up 42.05%, yet at one point had rallied as much as 46.19% from entry while also suffering a worst drawdown of about 76.14% before recovering. In 2022, the stock posted a 30.99% net gain, but the best intraperiod run-up reached 79.63% and the worst drawdown hit roughly 34.22%, underscoring how volatile this crypto-linked name can be inside an otherwise bullish seasonal pattern.
Across the six-sample history, the typical path in this MicroStrategy seasonal trend has been a strong upward bias with pockets of sharp downside. The cumulative return profile, with a 475% total gain across all cycles, suggests that gains have tended to accrue over the full 311-day stretch rather than clustering in a single month. The TradeWave Ratio of 1.96 indicates that price has usually traveled meaningfully in the long direction during the window, while the Sharpe ratio of 2.11 points to favorable risk-adjusted outcomes based on end-of-window results.
History does not guarantee future results; adverse excursions can be large even in winning windows, and MicroStrategy’s intraperiod drawdowns have at times been severe.
Why does MicroStrategy (MSTR) follow this seasonal pattern?
One likely driver is the way Bitcoin’s boom-and-bust cycles have tended to line up with the midterm-to-pre-election phase of the presidential cycle, when risk appetite often improves and liquidity conditions stabilize. Analysts have also pointed to institutional portfolio repositioning around midterm-year volatility, which can funnel flows into high-beta vehicles like MicroStrategy as policy uncertainty clears.[2] The company’s role as a leveraged Bitcoin treasury vehicle means that crypto’s own seasonal tendencies and regulatory headlines may be amplifying this midterm-year stock pattern rather than creating it from scratch.[4]
What is driving MicroStrategy (MSTR) today?
MicroStrategy shares closed at 166.52 on Apr 20, up 11.8% on the day, leaving the stock about 63.6% below its 52-week high of 457.22 and roughly 59.8% above its 52-week low of 104.17. Trading volume over the past 20 days has averaged about 19.1 million shares, so today’s surge came against an already active backdrop. The move fits a broader pattern in which swings in Bitcoin, where prices have recently oscillated around levels that pressure MicroStrategy’s average purchase price, continue to dictate sentiment on the stock.[4]
In late 2025, MicroStrategy reinforced its identity as a crypto treasury proxy by acquiring roughly $980.3 million of additional Bitcoin, a step that further tied its equity performance to digital-asset volatility rather than core software fundamentals.[2] Around the same time, analysts remained constructive on the strategy, with one Wall Street framework pointing to upside scenarios that assumed Bitcoin strength and multiple expansion for MicroStrategy’s holdings.[1] The stock has also seen episodes of intense pressure, including a plunge to 153.26 on Dec 31, 2025 that raised the prospect of a short squeeze as bearish positioning met still-bullish long-term narratives.[3]
Options traders have been active around Bitcoin breakout levels, with one January 2026 setup highlighting bull call spread strategies on MicroStrategy tied to a potential move in Bitcoin above 94,000.[1] That kind of unusual options activity matters because it can create feedback loops between derivatives hedging and the underlying stock, especially in a name where crypto sentiment and leverage already magnify day-to-day swings. At the same time, Bitcoin’s drop below MicroStrategy’s average purchase price in early February 2026 narrowed margins on the company’s leveraged bet, reminding investors that the same structure that fuels upside in strong seasonal windows can also amplify downside when crypto weakens.[4]
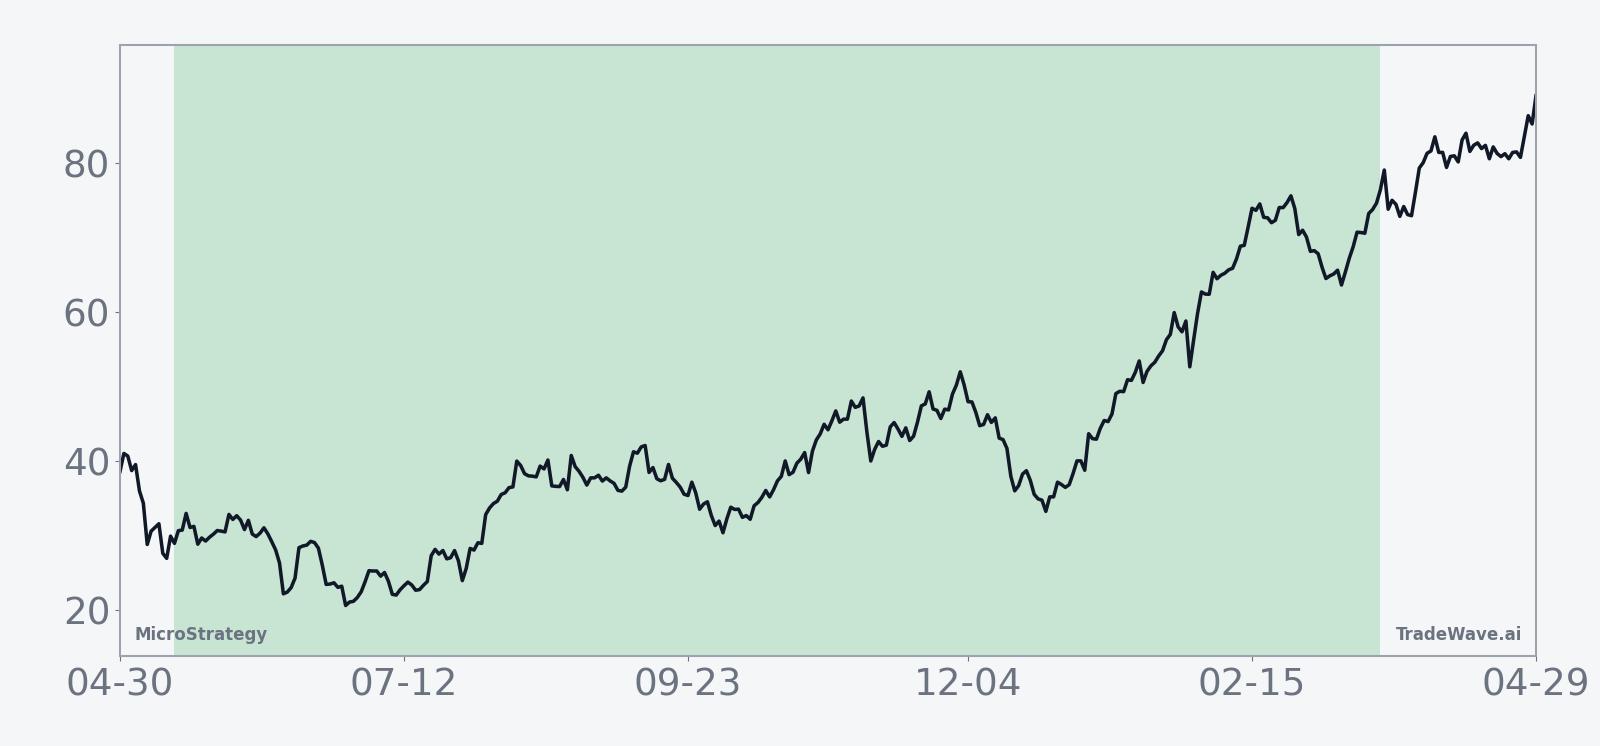
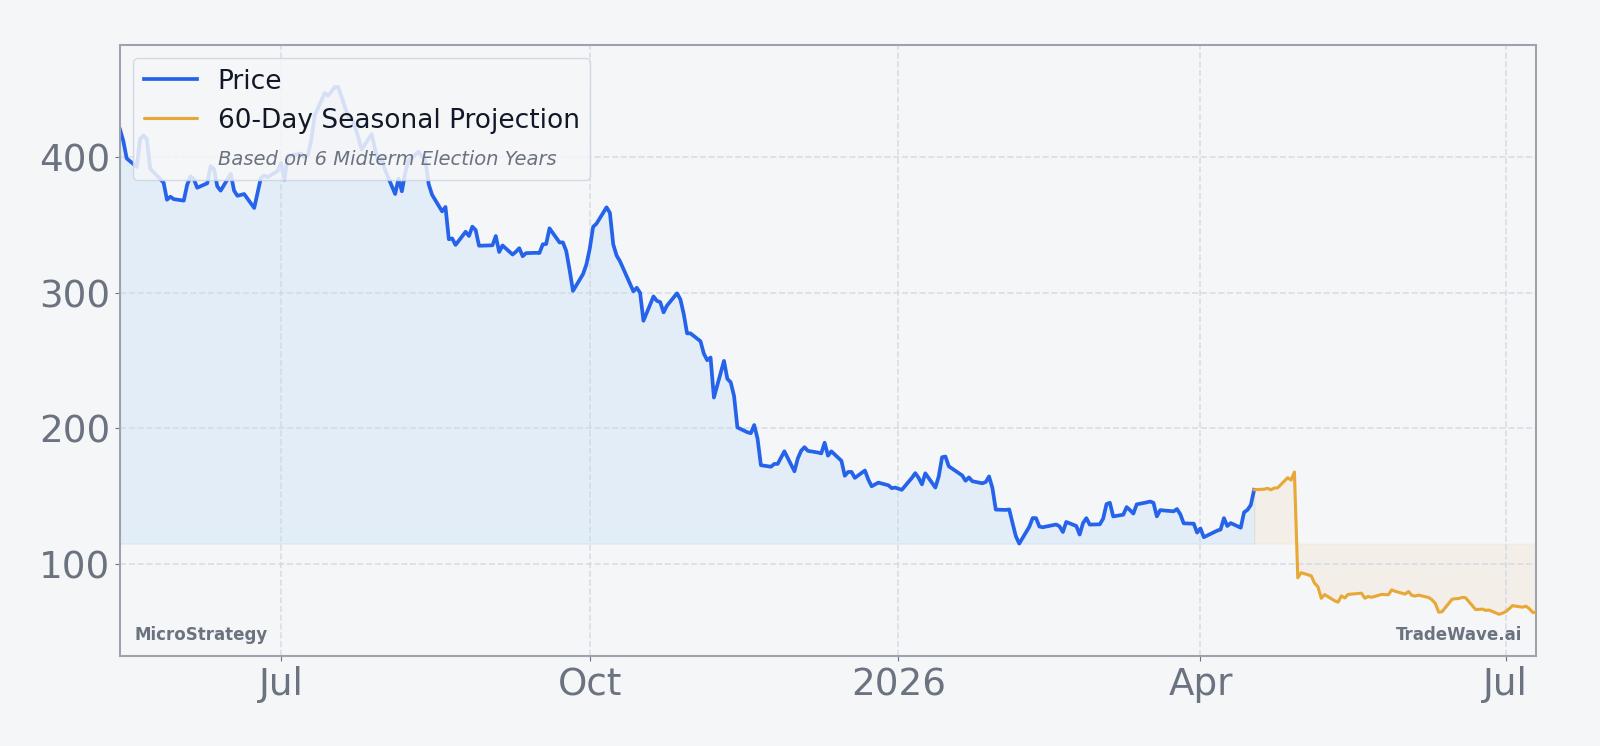
The chart below situates the latest move in its recent multi-month context and overlays a short-term seasonal projection.
What should traders watch as this MicroStrategy seasonal window approaches?
The next iteration of this 311-day window opens on May 14, so the near-term focus is how MicroStrategy behaves as it transitions from a volatile early-year stretch into the historically stronger midterm-to-pre-election regime. Traders will be watching whether Bitcoin can reclaim and hold levels above MicroStrategy’s average purchase price, since prior winning windows have generally coincided with constructive crypto backdrops rather than prolonged drawdowns.[4] Price action around the 150 to 175 zone, where the stock has recently been oscillating, will help determine whether this year’s setup starts from a position of strength or from a still-fragile base.
Options flow is another key tell. If bullish call structures tied to Bitcoin breakouts continue to build into May, that would echo the January 2026 playbook and could reinforce the historical pattern of strong upside travel within the window.[1] A fade in speculative options interest, by contrast, would suggest that this cycle might lean more on spot Bitcoin and macro liquidity than on leverage and positioning. Finally, intraperiod drawdowns have been large even in winning years, so traders will want to monitor how quickly any early pullbacks develop once the window opens and whether those dips resemble the deep but ultimately recoverable setbacks seen in 2002 and 2022.
Sources
- Forbes: "MicroStrategy: How MSTR Stock Rises 3x To $450?" (Jan 7, 2026)
- Yahoo Finance: "Strategy Inc. (MSTR) Bolsters Bitcoin Holdings as Analysts Stay Positive" (Dec 29, 2025)
- Yahoo Finance: "Michael Saylor’s MicroStrategy plunges on New Year’s Eve" (Dec 31, 2025)
- Seeking Alpha: "Bitcoin drop puts world's largest crypto treasury firm under pressure (MSTR:NASDAQ)" (Feb 2, 2026)
About this seasonal analysis
Seasonal pattern data is sourced from TradeWave.ai, which analyzes historical price behavior across annual calendar windows going back up to 30 years. Read the full data methodology or the book The 100-Year Pattern by Afshin Moshrefi (2026 edition). Past performance of seasonal patterns does not guarantee future results. This article is for informational purposes only and does not constitute investment advice.