Record Profit at Charles Schwab Corporation (SCHW) Meets Historically Weak May 14 Stretch
Charles Schwab Corporation is heading toward a historically weak 29-day midterm-election seasonal window even as shares sit well below last year’s high after record profits and a crypto push.
What is the seasonal pattern for Charles Schwab Corporation (SCHW)?
Charles Schwab Corporation has fallen in 9 of 9 midterm-year windows starting May 14, with an average loss of 4.11% in winning years for the short setup.
- 9 for 9 in this window for shorts, with average gains of 4.11% on profitable short trades across the last nine midterm election years.
- The upcoming 29-day trading window begins May 14 and has historically been a weak stretch for Charles Schwab Corporation in midterm election years.
- Percent Profitable is 100%, with 9 winners and 0 losers for the short direction across the lookback sample.
- Average winner profit of 4.11% on shorts compares with a cumulative return of 43% for the strategy across all nine midterm-year windows.
- The TradeWave Ratio of 2.87 suggests price has typically traveled meaningfully in the short direction within the window, even beyond the final net move.
- Intraperiod swings have included double-digit adverse moves in some years, underscoring that drawdowns can be sharp even in a historically consistent pattern.
According to historical data from TradeWave.ai, this midterm-year stretch for Charles Schwab Corporation has behaved very differently from an average month on the calendar. The next section walks through how that election-cycle pattern has played out in prior years and what it means for the approaching May 14 window.
How has Charles Schwab Corporation (SCHW) traded in the May 14 midterm-year window?
Charles Schwab Corporation has fallen in every single 29-day window starting May 14 across the last nine midterm election years, with shorts averaging a 4.11% gain. Shares finished Friday at 92.28, leaving the stock about 14.1% below its 52-week high of 107.49 and roughly 27.3% above the 52-week low. That mix of a strong historical seasonal trend and a stock trading in the upper half of its one-year range gives this upcoming window unusual weight for traders watching the SCHW seasonal trend.
Grouping the data by the presidential election cycle matters here because this pattern only looks at the last nine midterm election years, not every calendar year. Midterm years often feature shifting expectations around regulation, interest rates and fiscal policy, which can change how brokerage and wealth-management stocks trade compared with the year after the presidential election or the pre-election year.
Historically, this 29-day Charles Schwab Corporation trading window has favored the short side. Percent Profitable is 100%, with 9 winners and 0 losers for shorts, and the cumulative return for the strategy across those nine midterm-year windows is 43%. Average profit of 4.11% reflects the typical gain on winning short trades, while the median profit of 3.26% shows that results have been reasonably clustered rather than driven by a single outlier year.
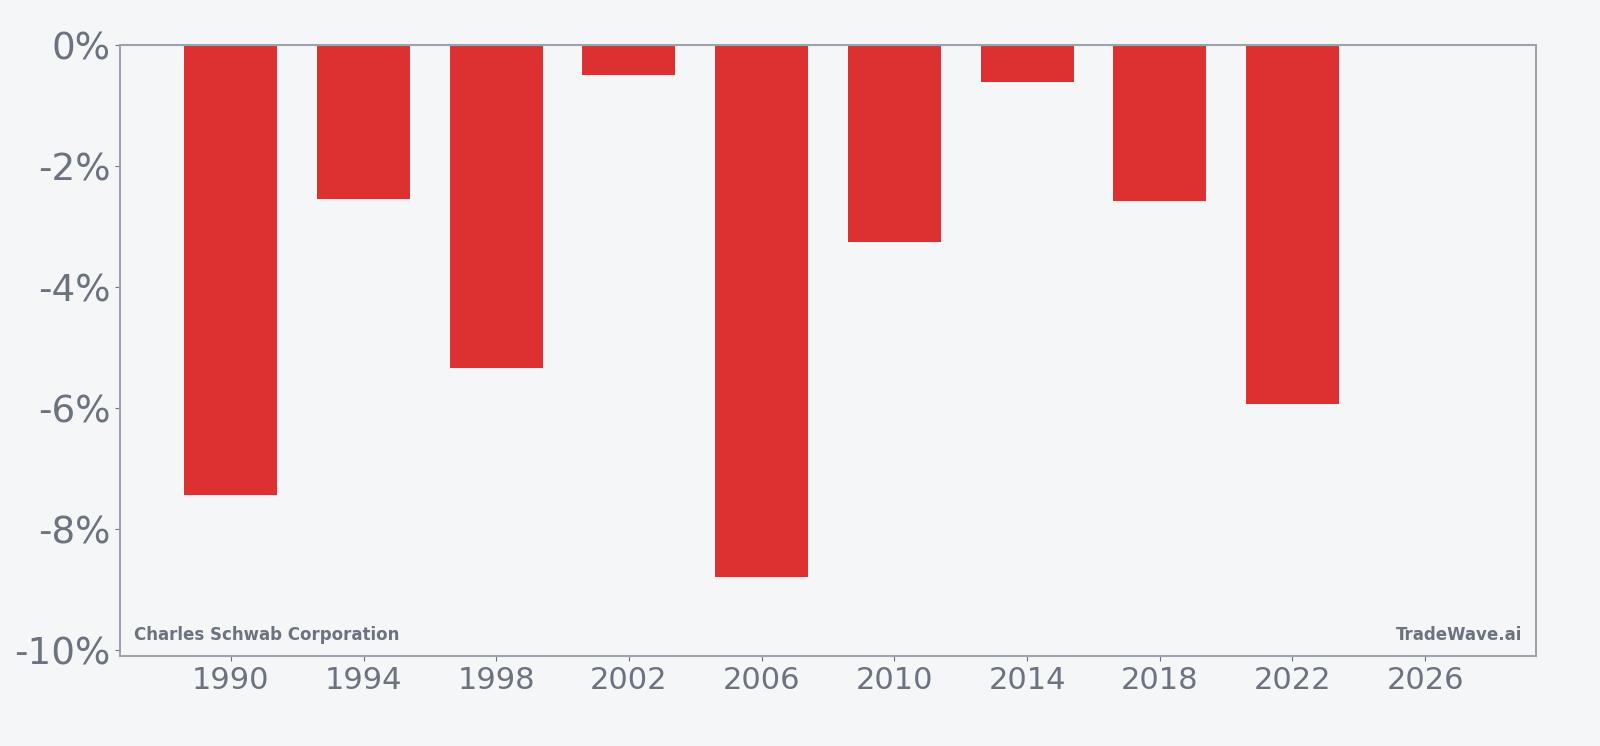
The per-year table shows that the strongest short year was 2006, when SCHW dropped 8.79% from entry to exit during this window, while the softest outcome for shorts came in 2002 with a modest 0.50% gain. Even in the milder years such as 2014, the stock still finished the window lower by 0.61%, keeping the win streak intact for the short setup. Add it up: nine for nine midterm years, all closing in the direction of the seasonal short bias.
The historical seasonal average trend line slopes steadily lower across the 29 days, with most of the downside accruing in the middle of the window rather than in a single sharp break. That suggests a pattern of grinding weakness for SCHW in this slice of the calendar during midterm years, rather than a one-day shock that dominates the statistics.
A closer look at yearly net returns alongside best and worst intraperiod swings shows how much room the stock has historically had to move inside the window.
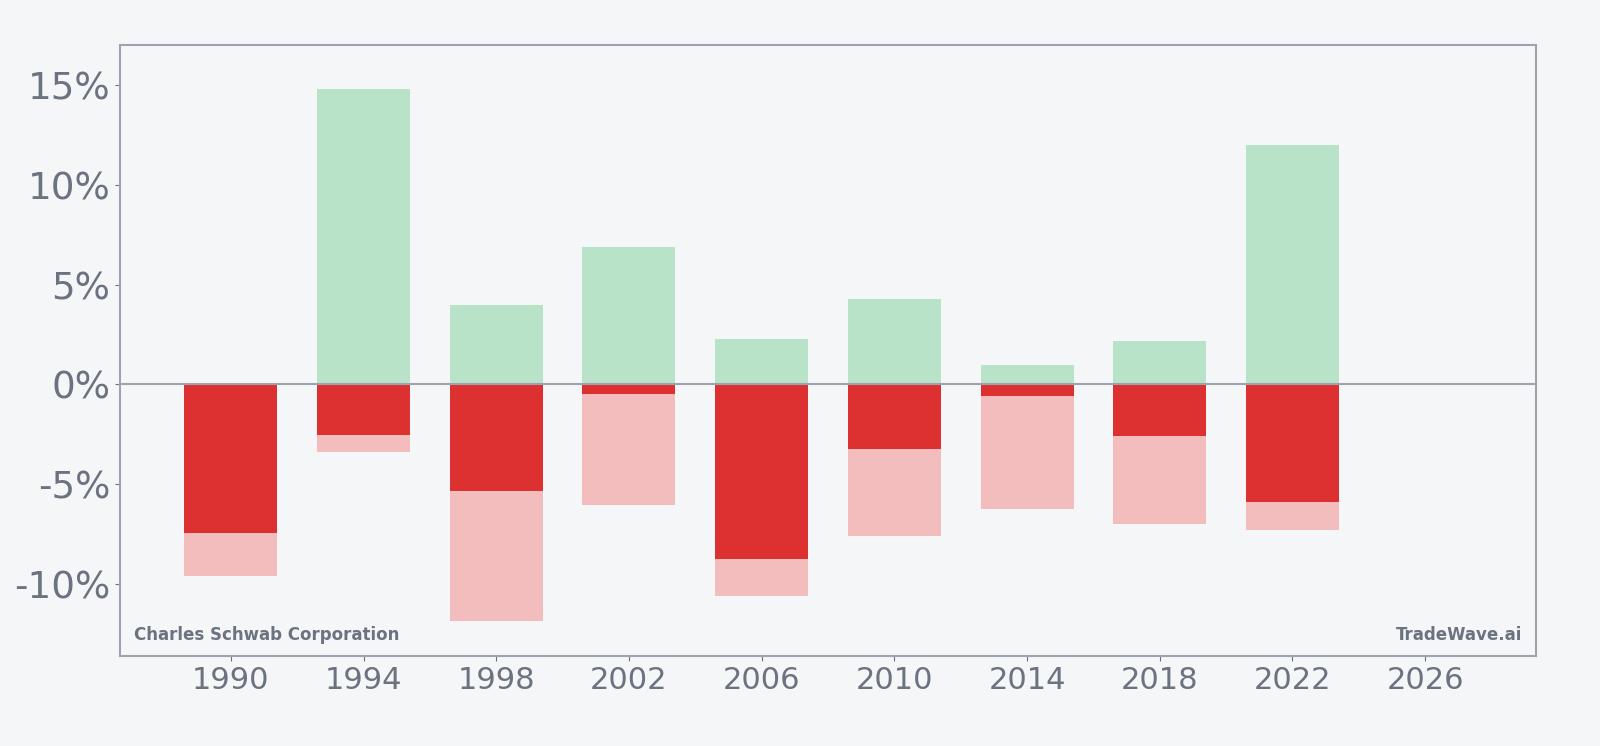
The combined net, maximum favorable move and maximum adverse move bars show that while shorts have finished ahead in every year, the path has not always been smooth. In 1998, for example, the stock’s worst intraperiod drawdown from the short entry was 11.88%, meaning SCHW rallied sharply against the short before ultimately closing 5.34% lower by the end of the window. In 1994 and 2022, maximum favorable excursions of 14.82% and 12.01% respectively show that when the pattern works, it can deliver sizable moves in the short direction inside a single month-long stretch.
The cumulative return chart for this pattern, which stacks each midterm-year outcome, climbs steadily as more cycles are added, reflecting the absence of losing years for the short strategy. There is no long flat period where gains are given back, which is unusual for a single-stock seasonal pattern and underscores how consistently this particular midterm-year slice has leaned against SCHW.
History does not guarantee future results; adverse excursions can be large even in winning windows, and traders using this pattern still face the risk of sharp rallies against the short before any seasonal weakness appears.
Why does Charles Schwab Corporation (SCHW) follow this seasonal pattern?
This midterm-year pattern may reflect a mix of earnings timing, rate expectations and institutional portfolio repositioning. One likely driver is that midterm springs often arrive after the first wave of the year’s earnings and guidance, when investors reassess financials exposure as policy debates around regulation and interest rates heat up. For a brokerage and wealth-management name like Charles Schwab Corporation, that can translate into short-term pressure if markets start to price in slower trading activity or a plateau in net interest margins during this part of the cycle.
What is driving Charles Schwab Corporation (SCHW) today?
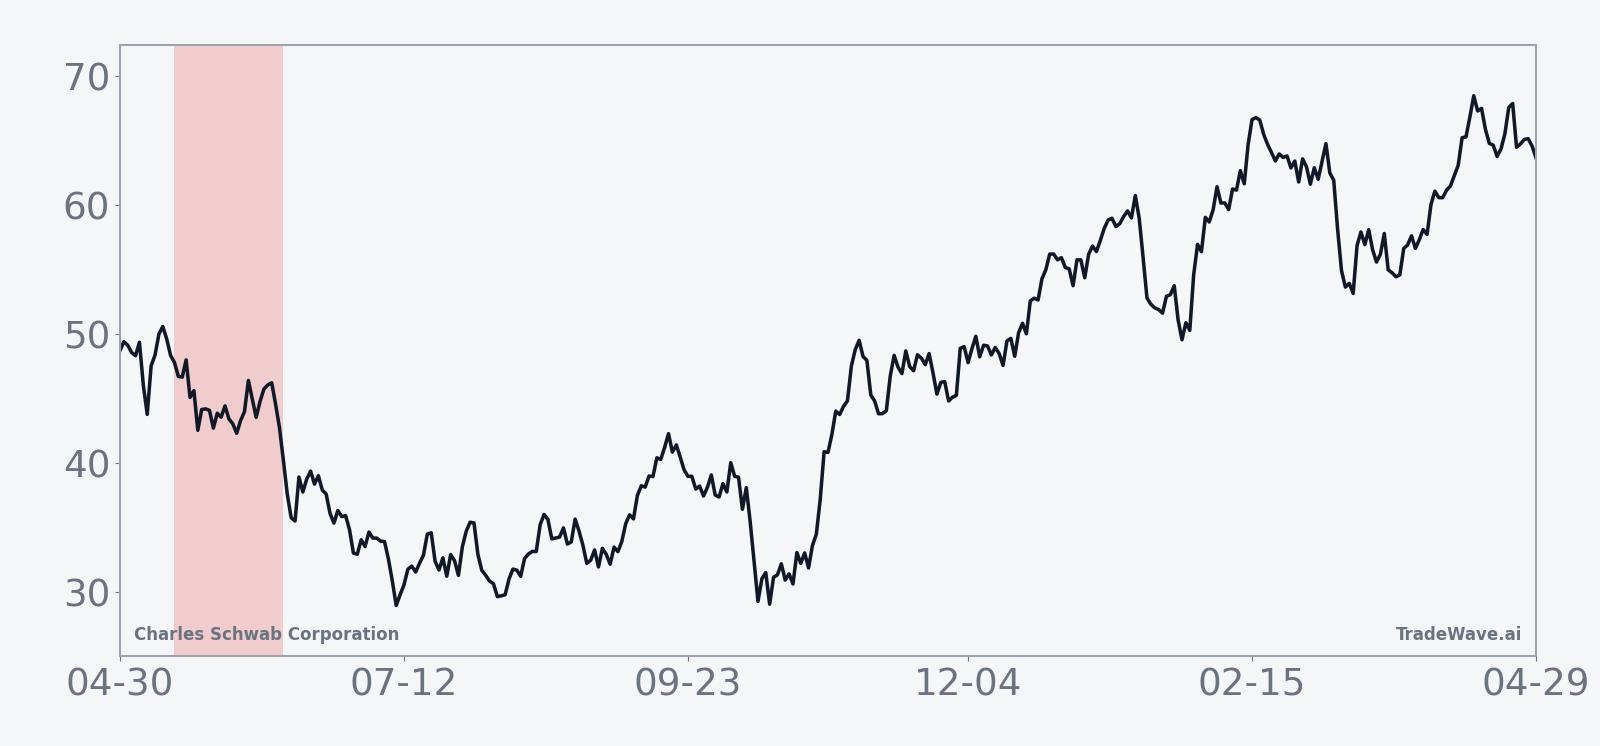
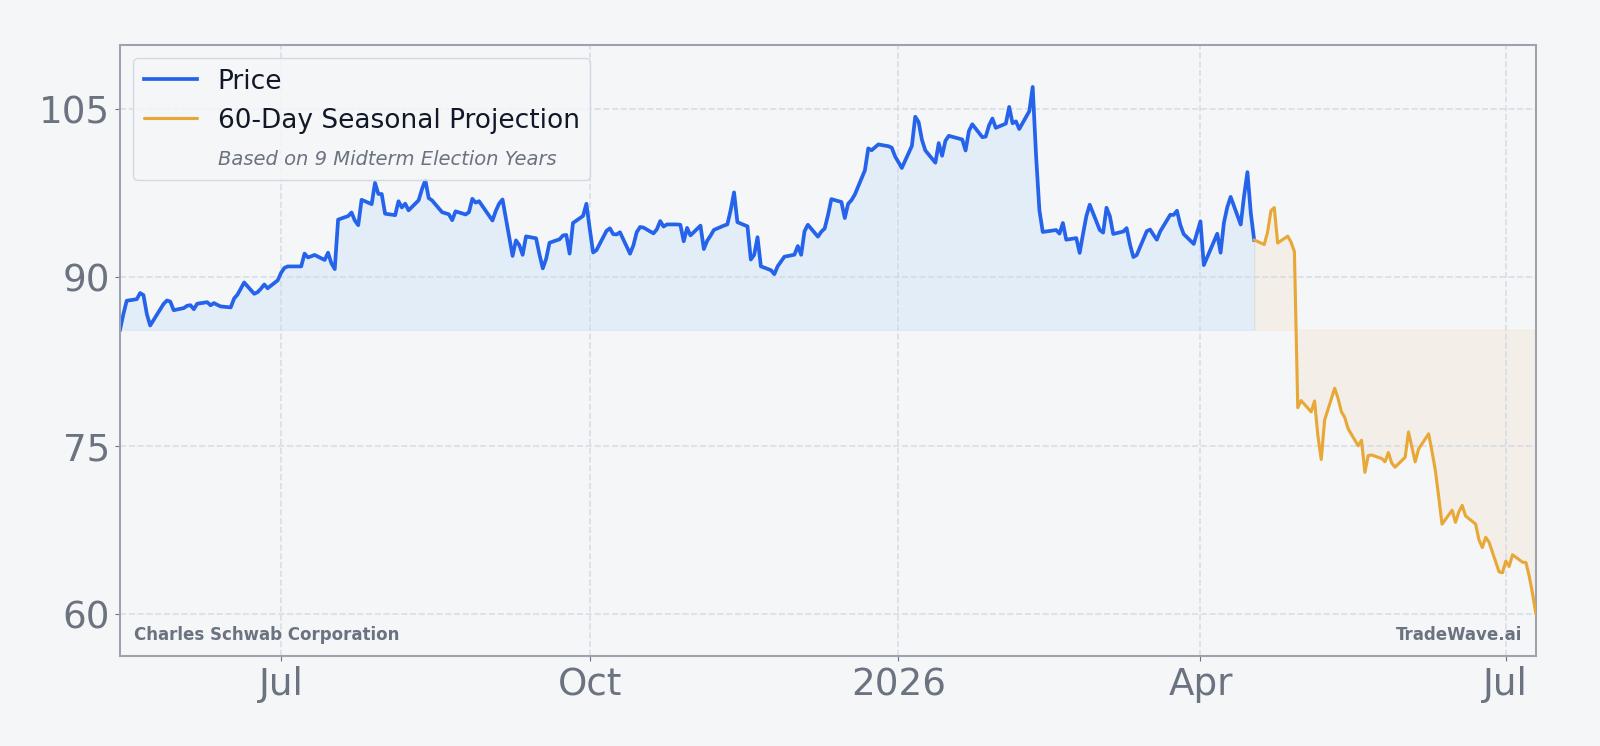
Charles Schwab Corporation closed Friday at 92.28, down 0.37% on the day, with roughly 19.3 million shares changing hands against a 20-day average volume of about 9.5 million. That leaves SCHW about 14.1% below its 52-week high of 107.49 and roughly 27.3% above the 52-week low, while the stock trades modestly below its 50-day moving average of 95.22, signaling a pause after a strong run. On Apr 16, Schwab reported record first-quarter profit on robust client growth and trading activity and confirmed a phased rollout of spot crypto trading, including bitcoin and ether, which has helped keep the stock in focus among financials and retail traders alike.[4][6]
In January 2026, Schwab also reported that fourth-quarter net income rose to $2.46 billion, or $1.33 per share, with revenue up 19% to $6.34 billion as trading revenue jumped 25% and net interest revenue increased more than 25%.[1][2] In October 2025, the company had already logged record profit on client assets and trading strength, while in July 2025 the board authorized a $20 billion stock buyback and declared dividends, reinforcing a shareholder-return story that has supported the stock over the past year.[3][5] Across these quarters, Schwab’s financial services backdrop has been defined by higher interest income and elevated trading volumes amid market volatility and AI-driven rallies, a combination that has boosted profitability but also tied the stock more tightly to swings in market sentiment.[2]
The chart below situates the latest move in its recent multi-month context alongside a 60-day seasonal projection.
What should traders watch as the May 14 window approaches?
First, the calendar: the 29-day midterm-year window starting May 14 has been a clean 9-for-9 stretch for shorts, so how SCHW behaves as that date nears will show whether the historical seasonality still has bite. A firm push back above the 50-day moving average near 95 and toward the 52-week high zone would mark a clear break from the typical pattern, while a drift lower into the window would be more in line with prior midterm years. Second, policy and macro headlines around interest rates and regulation will matter, since Schwab’s earnings power is tightly linked to net interest revenue and trading activity that respond quickly to shifts in rate expectations and volatility.[2][4][6]
Third, traders should monitor volume and client-engagement metrics in upcoming disclosures, given that daily average trading volume recently jumped 34% to a record 9.9 million, reflecting robust client activity.[6] If that engagement remains elevated while the stock starts to weaken into or during the May 14 window, it would echo prior midterm-year episodes where active trading coincided with downside pressure in SCHW. Finally, behavior inside the window itself will be the real test: another year where the stock finishes the 29-day stretch lower would extend a rare 10-for-10 record for the short seasonal pattern, while a decisive upside break would mark the first time in this dataset that Charles Schwab Corporation has escaped the midterm-year May 14 drag.
Sources
- The Wall Street Journal, "Schwab’s Profit Jumps on Surge in Brokerage Activity," Jan 21, 2026.
- Reuters, "Charles Schwab's profit rises on higher interest income, trading revenues," Jan 21, 2026.
- Reuters, "US broker Schwab clinches record profit on client assets, trading strength," Oct 16, 2025.
- The Wall Street Journal, "Schwab Says Earnings Jump 30%, Plans to Launch Crypto Trading," Apr 16, 2026.
- Reuters, "Charles Schwab authorizes $20 billion stock buyback, declares dividends," Jul 24, 2025.
- Reuters, "Charles Schwab posts record quarterly profit, set to launch spot crypto trading," Apr 16, 2026.
About this seasonal analysis
Seasonal pattern data is sourced from TradeWave.ai, which analyzes historical price behavior across annual calendar windows going back up to 30 years. Read the full data methodology or the book The 100-Year Pattern by Afshin Moshrefi (2026 edition). Past performance of seasonal patterns does not guarantee future results. This article is for informational purposes only and does not constitute investment advice.