Abbott Laboratories (ABT) Has Rallied in 9 of 10 Midterm May Windows, Averaging 29.6% Gains
Abbott Laboratories is heading toward a historically powerful midterm-year seasonal window just as the stock trades well below its 52-week high and investors digest a trimmed 2026 profit outlook.

What is the seasonal pattern for Abbott Laboratories (ABT)?
Abbott Laboratories has risen in 9 of 10 midterm-election-year windows starting around May 16, with an average gain of 29.59% in winning years.
- 9 wins and 1 loss in this window, with winning years averaging 29.59% gains and a 26% average when all years are included.
- Seasonal window begins May 16 and runs 364 trading days across the last 10 midterm election years, aligning with a long trade direction.
- Percent Profitable stands at 90%, with 9 winners and 1 loser in the historical sample.
- The single losing year, 2002, saw only a 3.42% decline but included a deep intraperiod drawdown of 34.41% from entry.
- Annualized return across the pattern is 25.2%, with a Sharpe ratio of 1.31 and a TradeWave Ratio of 1.55, pointing to strong upside travel in the trade direction.
- Maximum favorable moves have often exceeded 40% in strong years, but adverse excursions have at times reached double digits, underscoring meaningful volatility inside the window.
According to historical data from TradeWave.ai, this midterm-election-year stretch for Abbott Laboratories has behaved very differently from an average calendar year, and the next iteration is about to open.
How has Abbott Laboratories (ABT) traded in this midterm-year seasonal window?
Abbott Laboratories has rallied in 9 of the last 10 midterm-election-year windows that start around May 16 and run for 364 trading days, with average winning gains near 30%. The stock finished Monday at $96.81, up 1.4% on the day, leaving it about 28.4% below its 52-week high of $135.23 and only modestly above its 52-week low of $93.92. That combination of a strong historical seasonal trend and a stock trading in the lower third of its one-year range is what has traders paying attention to this upcoming Abbott Laboratories trading window.
Because this pattern is grouped by the presidential election cycle, it only looks at Abbott’s behavior in the midterm election year, a phase that often brings policy uncertainty, tariff debates and shifting healthcare regulation. The current calendar year is the midterm election year, so the upcoming window sits squarely in that phase and then carries through into the year before the presidential election, when risk appetite has historically improved for many large-cap stocks.
Across the last 10 midterm-election-year samples, the long trade direction has been clearly favored. Percent Profitable is 90%, with 9 winners and just 1 loser, and the all-years average gain of 26% shows that the single down year did not erase the broader pattern. The median profit of 29.34% is close to the average winner, which suggests the upside has not been driven by just one outlier year.
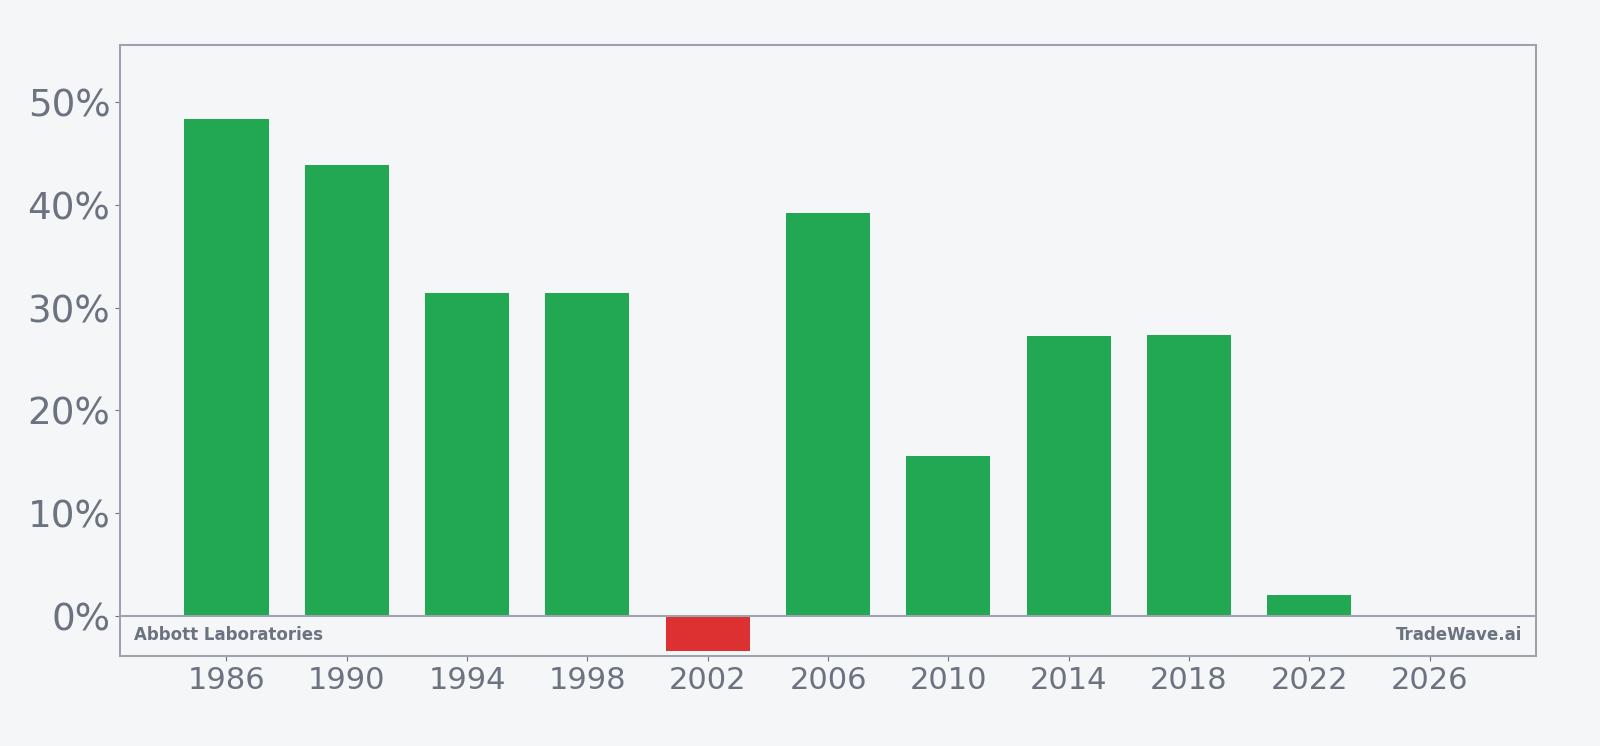
Looking at individual years, 1986, 1990 and 2006 stand out with net returns between about 39% and 48%, while 2014 and 2018 also delivered gains in the high 20% range. The weakest outcome was 2002, which finished the window down 3.42% despite a brief 5.03% rally from entry before a sharp slide. More recently, 2022 still ended positive, but only by 2.0%, after a choppy path that included a 14.22% intraperiod drawdown.
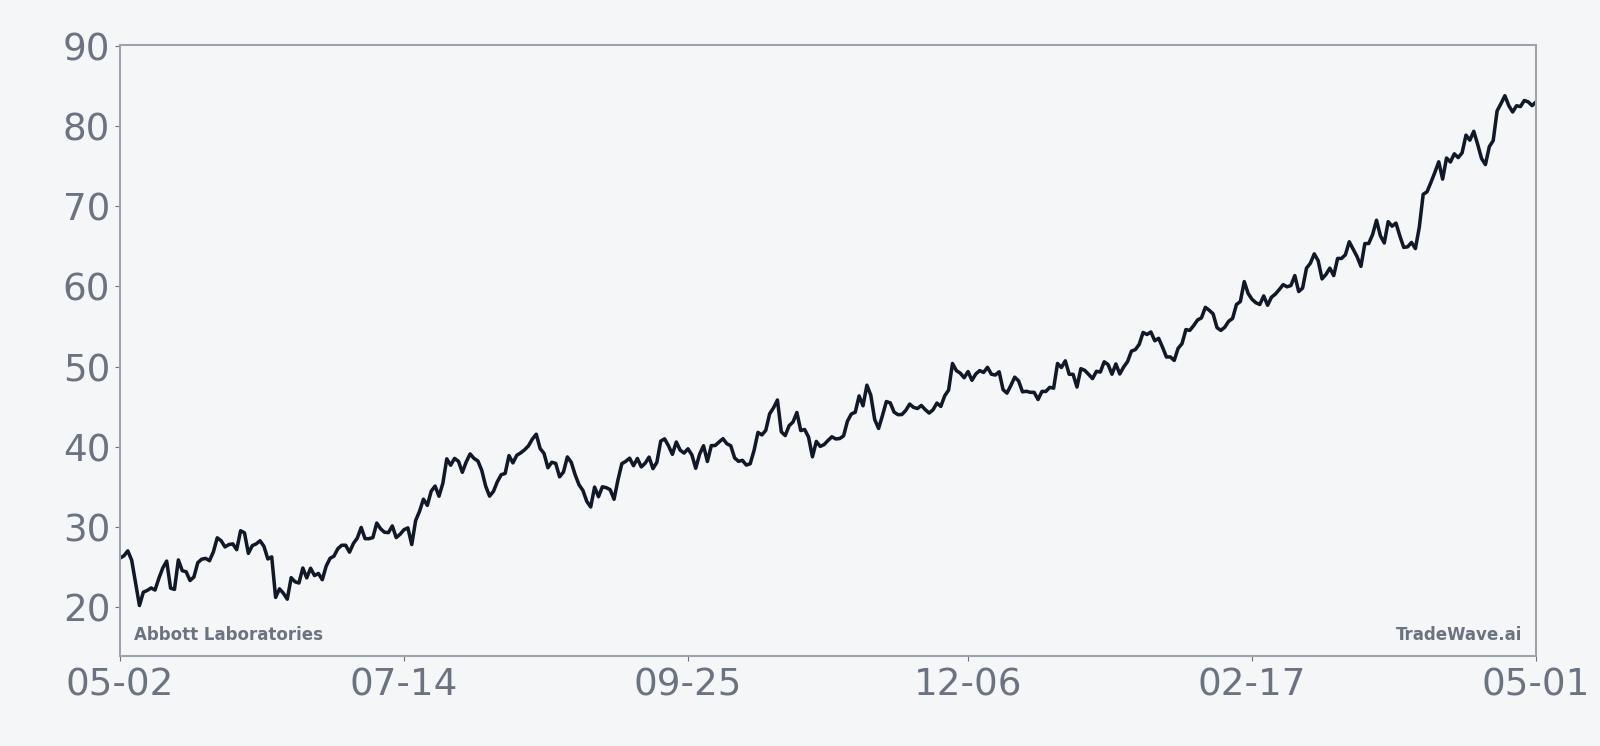
The historical seasonal average trend line slopes higher across most of the 364-day window, with gains tending to build steadily rather than in a single burst. In several cycles, the strongest part of the move has come after the first few months, which lines up with the typical pattern of midterm-year volatility giving way to a stronger pre-election-year backdrop.
Year-by-year bars that include both best and worst intraperiod moves show how much room Abbott has historically had to run in both directions inside this window.
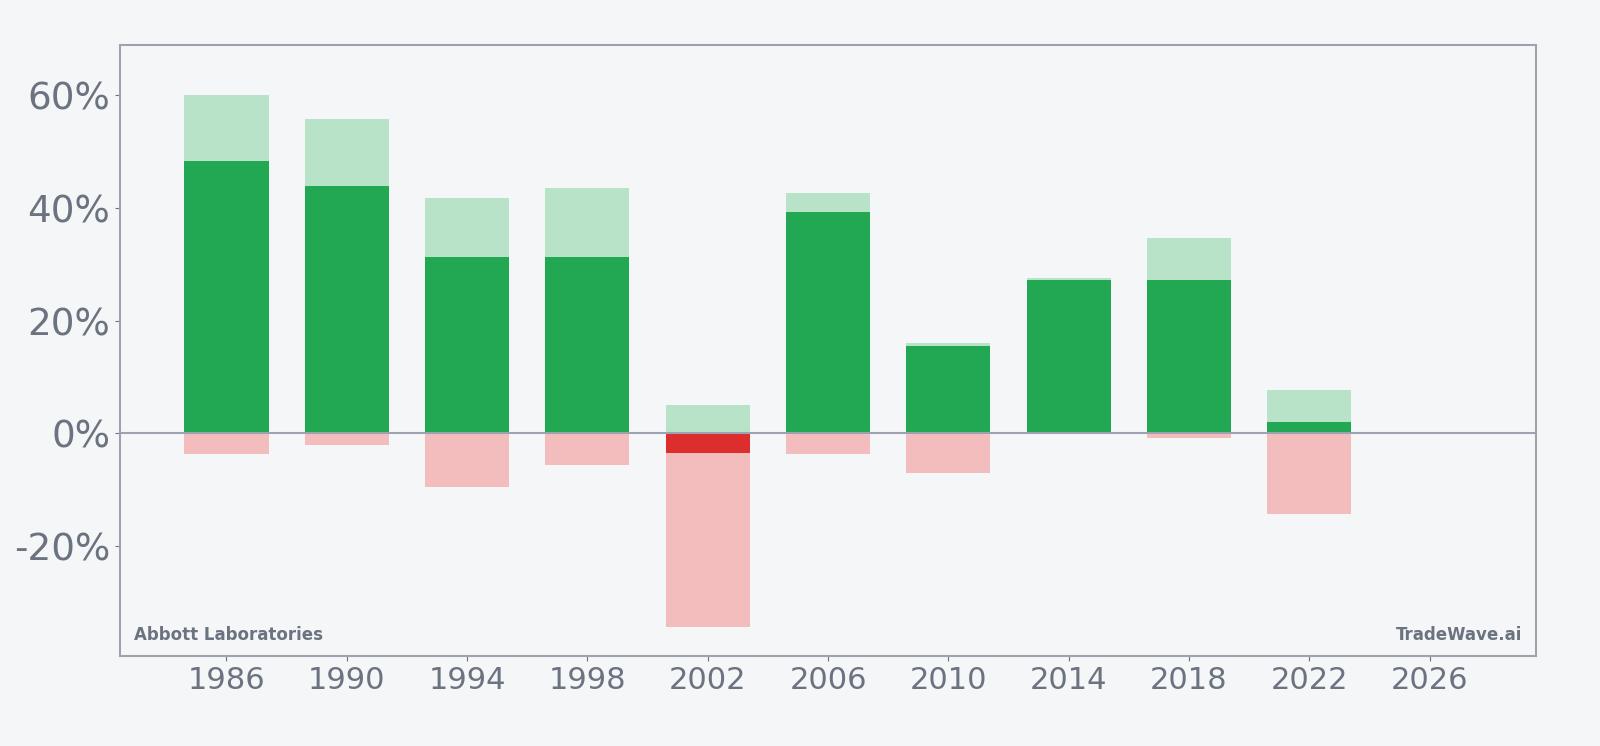
The maximum favorable excursions in strong years have often pushed into the 40% to 60% range, while maximum adverse excursions have usually stayed in single digits but occasionally spiked, as in 2002 and 2022. That mix points to a window where upside has historically dominated, yet intraperiod drawdowns can still be uncomfortable even in years that finish higher. Add it up: 9 for 10 with double-digit typical gains, but with enough downside noise that position sizing and risk controls matter.
History does not guarantee future results; adverse excursions can be large even in winning windows.
Why does Abbott Laboratories (ABT) follow this seasonal pattern?
One likely driver is the way Abbott’s earnings calendar clusters with the midterm and pre-election policy cycle, as healthcare spending, reimbursement decisions and tariff debates often intensify in these years. Analysts have also pointed to institutional portfolio repositioning into defensive growth names like medical devices and diagnostics as election uncertainty peaks, which can favor Abbott in the back half of the window. The pattern may also reflect sector rotation as investors move from early-cycle cyclicals into steadier healthcare names ahead of the presidential election year.
What is driving Abbott Laboratories (ABT) today?
Abbott shares closed Monday at $96.81, up 1.4% on the session, in a range that saw the stock trade between $94.87 and $97.14 on volume of about 17.5 million shares, above its 20-day average of roughly 13.2 million. That leaves the stock about 28.4% below its 52-week high of $135.23 and only around 3.1% above its 52-week low of $93.92, a compressed setup heading into the new seasonal regime.
The latest fundamental catalyst came on Apr 16, 2026, when Abbott trimmed its full-year 2026 profit forecast, citing a hit from the Exact Sciences acquisition, a move that pressured the stock as investors reassessed earnings power.[13] In 2025, the company had already been navigating a mixed backdrop: strong demand for medical devices such as continuous glucose monitors helped it beat second-quarter profit estimates, but guidance for the following quarter came in light and tariff costs were flagged as a headwind starting in the back half of the year.[1] Later that year, Abbott missed third-quarter revenue expectations as weakness in diagnostics and nutrition offset the medical devices lift, reinforcing the sense that the growth engine was uneven across business lines.[5]
Those earlier earnings and guidance updates from 2025 are now background rather than active catalysts, but they frame how investors view the current setup: a high-quality medical devices franchise facing tariff pressure and integration costs, yet still carrying a “Buy” consensus rating from analysts tracked by BTIG via CNBC.[2][3][4][6] With the stock trading well below its prior highs and the next major earnings date not yet set, the focus in the near term is on how quickly Abbott can demonstrate that the Exact Sciences deal and tariff drag are manageable within its broader healthcare portfolio.[13]
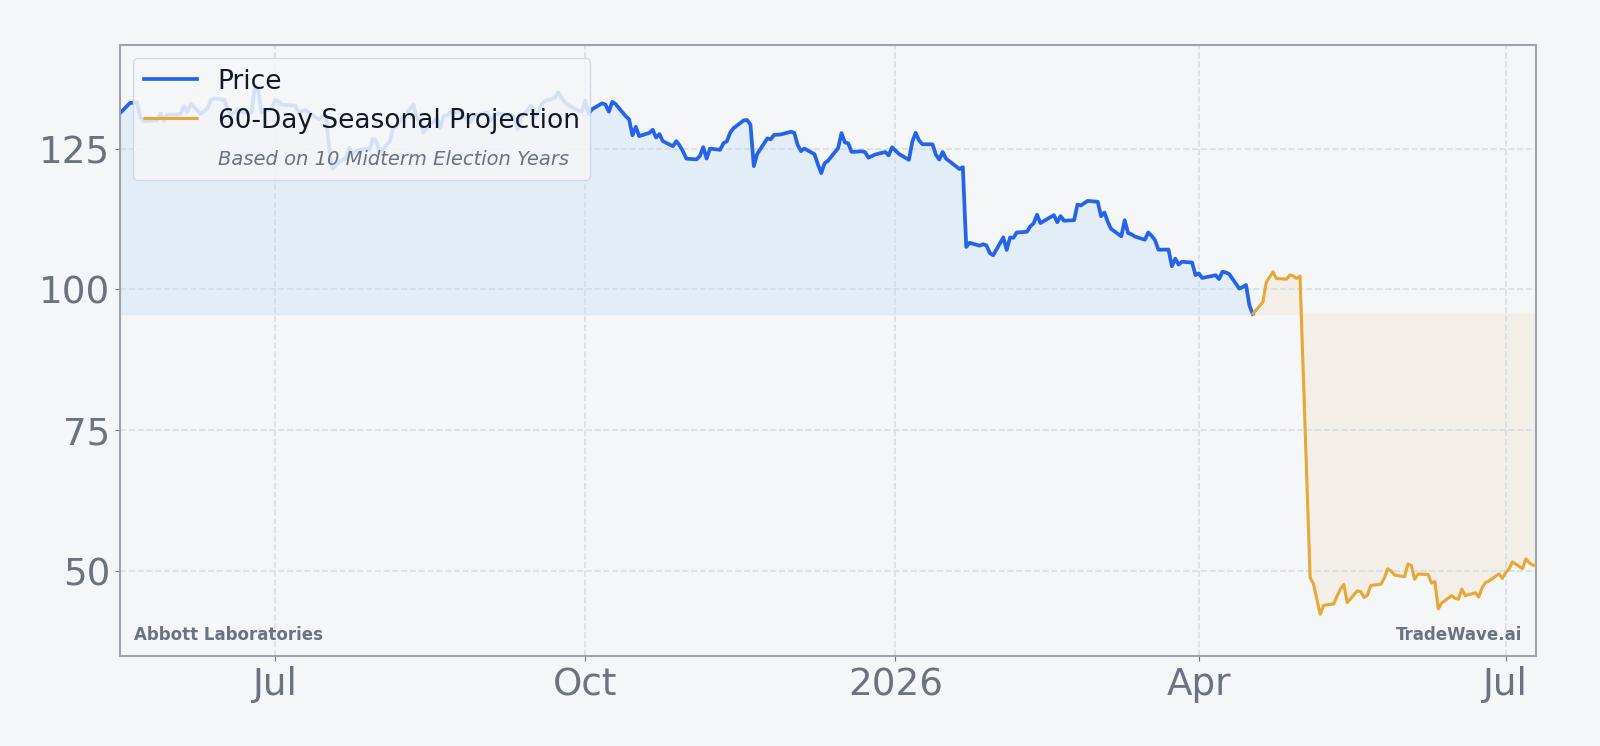
The chart below situates the latest move against Abbott’s past year of trading and a 60-day seasonal projection.
What should traders watch as this Abbott Laboratories seasonal window opens?
First, the calendar: the new midterm-year seasonal window begins on May 16 and runs for 364 trading days, so price action in the weeks around that date will show whether Abbott starts to behave like prior strong cycles or more like the choppier 2022 pattern. Second, levels matter: with the stock sitting closer to its 52-week low than its high, traders will be watching whether Abbott can reclaim the $100 area and then build a base toward the mid-$110s, which would echo the historical tendency for gains to compound later in the window.
Third, catalysts: any updates on the Exact Sciences integration, tariff exposure or the performance of key medical device lines such as continuous glucose monitors could either reinforce or undercut the bullish historical seasonality.[1][5][13] Finally, behavior inside the window will be the real tell. A pattern of higher lows and contained drawdowns relative to past MAE readings would line up with the long-biased seasonal trend, while a quick break back toward the low $90s with expanding downside volatility would look more like the rare losing year in 2002. For traders who track historical seasonality, how Abbott trades through this midterm-year stretch will signal whether this 9-for-10 record can extend to a tenth win or whether the pattern is starting to fray.
Sources
- Reuters: Abbott beats estimates on medical devices demand as forecast hits shares (Jul 17, 2025)
- Reuters: Abbott beats profit estimates on medical devices demand, shares fall on forecast (Jul 17, 2025)
- Reuters: Abbott beats quarterly profit estimates on medical devices demand (Jul 17, 2025)
- CNBC: Analysts defend Abbott Labs' stock after Thursday's 'too punitive' sell-off (Jul 18, 2025)
- Reuters: Abbott revenue misses as diagnostics, nutrition weakness clouds medical devices lift (Oct 15, 2025)
- Reuters: Abbott profit forecast falls short, ramps up US investing amid tariff pressure (Jul 17, 2025)
- Reuters: Abbott trims 2026 profit forecast on Exact deal hit, shares fall (Apr 16, 2026)
About this seasonal analysis
Seasonal pattern data is sourced from TradeWave.ai, which analyzes historical price behavior across annual calendar windows going back up to 30 years. Read the full data methodology or the book The 100-Year Pattern by Afshin Moshrefi (2026 edition). Past performance of seasonal patterns does not guarantee future results. This article is for informational purposes only and does not constitute investment advice.