Kroger (KR) Tariff Tailwind Meets a 9-of-10 Late-April Decline Window for Shorts
Kroger is heading toward a historically bearish late-April trading window just as shares hover near recent highs and investors digest a softer sales outlook under its new CEO.
What is the seasonal pattern for Kroger (KR)?
Kroger has fallen in 9 of 10 years during this late-April 33-day window, with an average 4.4% gain in winning short years.
- 9 for 10 in this window, with winning short years averaging 4.4% gains and a 44% cumulative return over the decade.
- The upcoming pattern runs from Apr 23 for 33 trading days and has historically favored short exposure in Kroger.
- Percent Profitable is 90%, with 9 winning short years and just 1 losing year across the 10-year lookback.
- Average profit across all years, including the lone loser, is still a solid 4%, underscoring the bearish seasonal bias.
- The TradeWave Ratio of 1.56 signals that price has typically traveled meaningfully in the short direction within the window.
- Intraperiod swings have included sharp adverse moves in some years, so short setups have carried real drawdown risk even when they finished profitable.
According to historical data from TradeWave.ai, this specific late-April stretch has behaved very differently from an average month for Kroger. The next section walks through how that pattern has played out and what it could mean for traders watching the stock this spring.
How has Kroger (KR) traded in the late-April seasonal window?
Kroger has delivered profitable short trades in 9 of the past 10 years during the 33-day window that begins on Apr 23, with winning years averaging a 4.4% move in the short direction. Shares finished Friday at $70.35, down 0.9% on the day and about 8.1% below their 52-week high of $76.58.[5] That combination of a strong historical short pattern and a stock still trading closer to the top of its one-year range gives this upcoming window unusual weight for both bulls and bears.
Across the decade-long lookback, the pattern has a clear bearish tilt for the stock. Percent Profitable sits at 90%, with 9 winning short years and only 1 losing year, and the all-years average outcome is a 4% gain for shorts despite that loser in the mix. For traders who focus on stock pattern analysis, that is an unusually consistent KR seasonal trend for such a short, 33-day window.
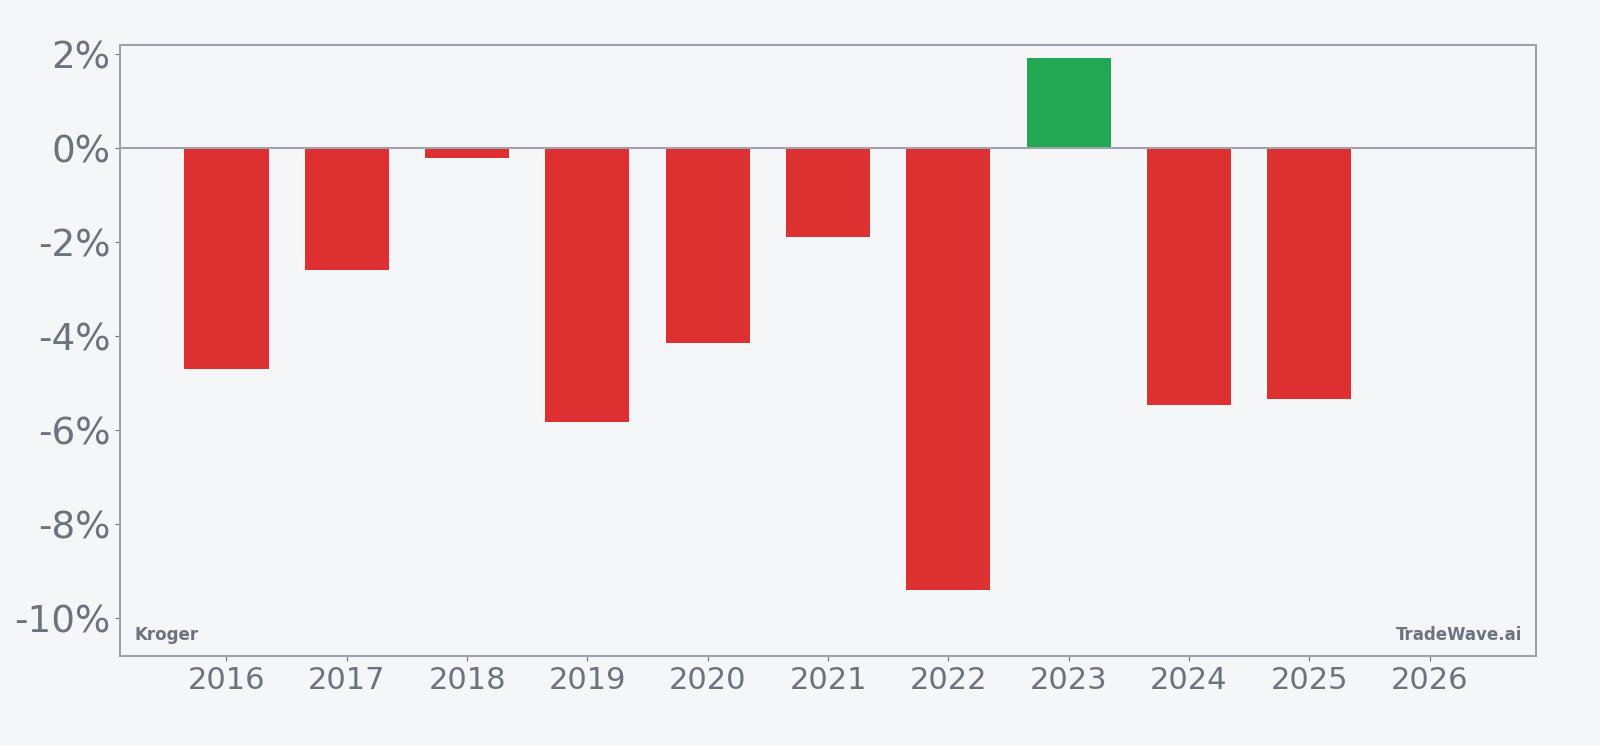
The per-year table shows that the strongest short year was 2022, when Kroger fell 9.4% from entry to exit during this window, with a worst intraperiod drawdown of 17.14% from the entry price before the trade finished.[5] The weakest year for the pattern was 2023, when the stock actually rose 1.91% over the window and shorts would have been squeezed as price rallied as much as 4.95% above the entry level before settling higher. That split illustrates how even a high win-rate seasonal window can still deliver painful countertrend moves.
The 10-year seasonal trend chart suggests that, on average, most of the downside for Kroger in this window has tended to accrue in the middle portion of the 33 days rather than right at the start. Early days often show modest noise before the average line slopes lower, then flattens into the close of the window. That shape fits a pattern where short setups have historically benefited from patience rather than an immediate payoff.
The stacked bar view of net returns alongside peak rallies and drawdowns helps clarify how much Kroger has typically moved inside this window.
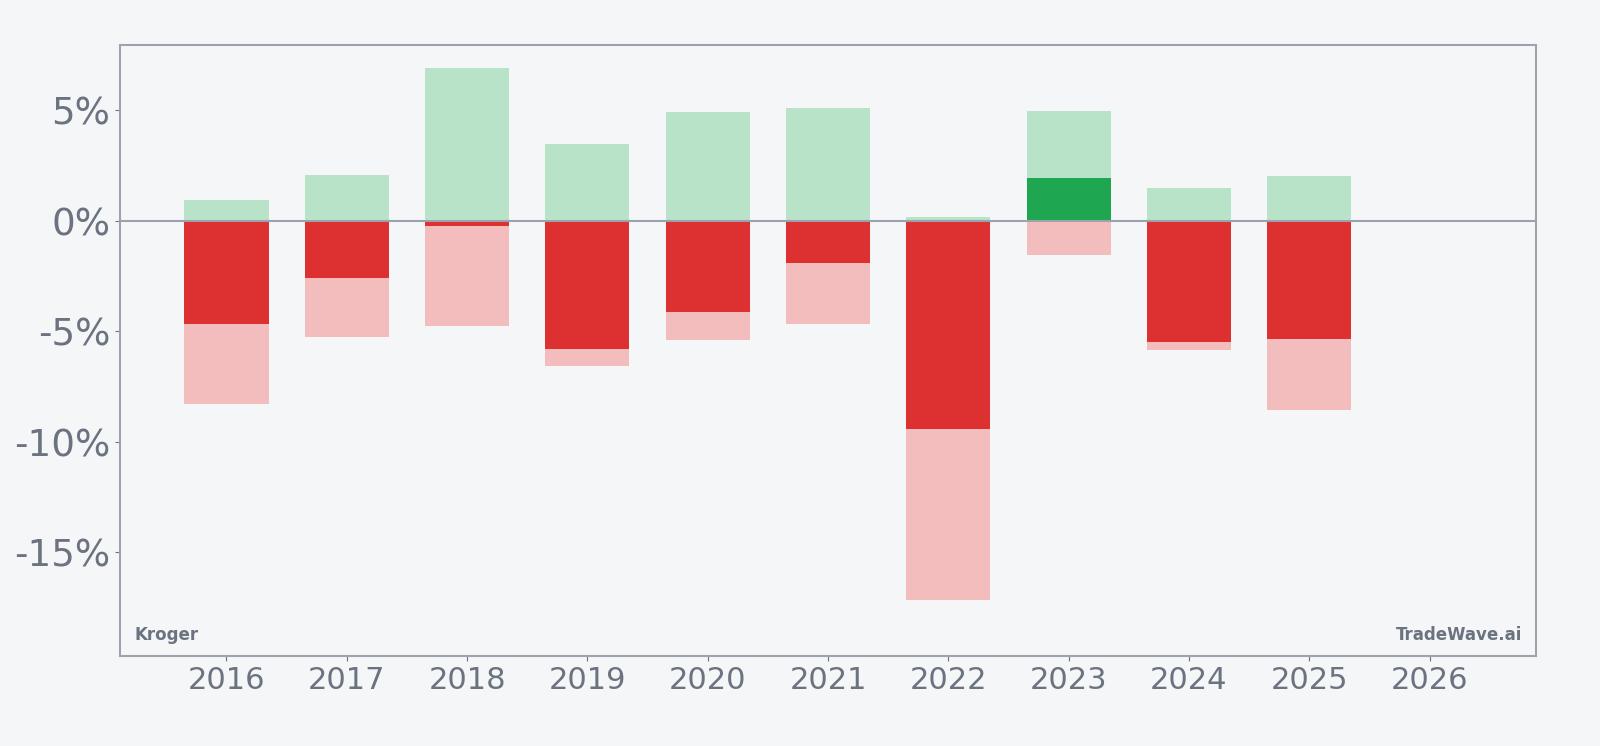
The stacked net, maximum favorable excursion and maximum adverse excursion bars show that in many years Kroger has moved significantly in the short direction while still posting sizable countertrend rallies inside the window. In 2016 and 2022, for example, shorts ultimately finished well ahead, but the worst intraperiod drawdowns from entry were more than 8% and 17% respectively before the trades worked. That mix of strong average gains and chunky MAE underscores that this has been a high-conviction but not low-risk bearish seasonal window.
History does not guarantee future results; adverse excursions (MAE) can be large even in winning windows.
Why does Kroger (KR) follow this seasonal pattern?
This late-April to early-June stretch may reflect how investors position around Kroger’s fiscal first-half earnings cadence and broader consumer-spending data. One likely driver is portfolio managers trimming exposure to defensive grocers after the first quarter as they rotate toward more cyclical retail and discretionary names. The pattern may also capture a period when food inflation headlines, tariff chatter and promotional intensity reset expectations for supermarket margins before the summer shopping season.
What is driving Kroger (KR) today?
Kroger slipped 0.9% to $70.35 on Friday, leaving the stock about 8.1% below its 52-week high of $76.58 and down roughly 2.6% over the past month as it consolidates after a strong run.[5] In March 2026, Reuters reported that the company kept its forecasts relatively soft as its new CEO emphasized growth through sharp pricing and value, signaling a willingness to sacrifice some margin to defend share in a cautious consumer environment.[5] That message fits with the broader grocery backdrop, where resilient at-home food demand has been offset by intense price competition and shoppers trading down to private labels.
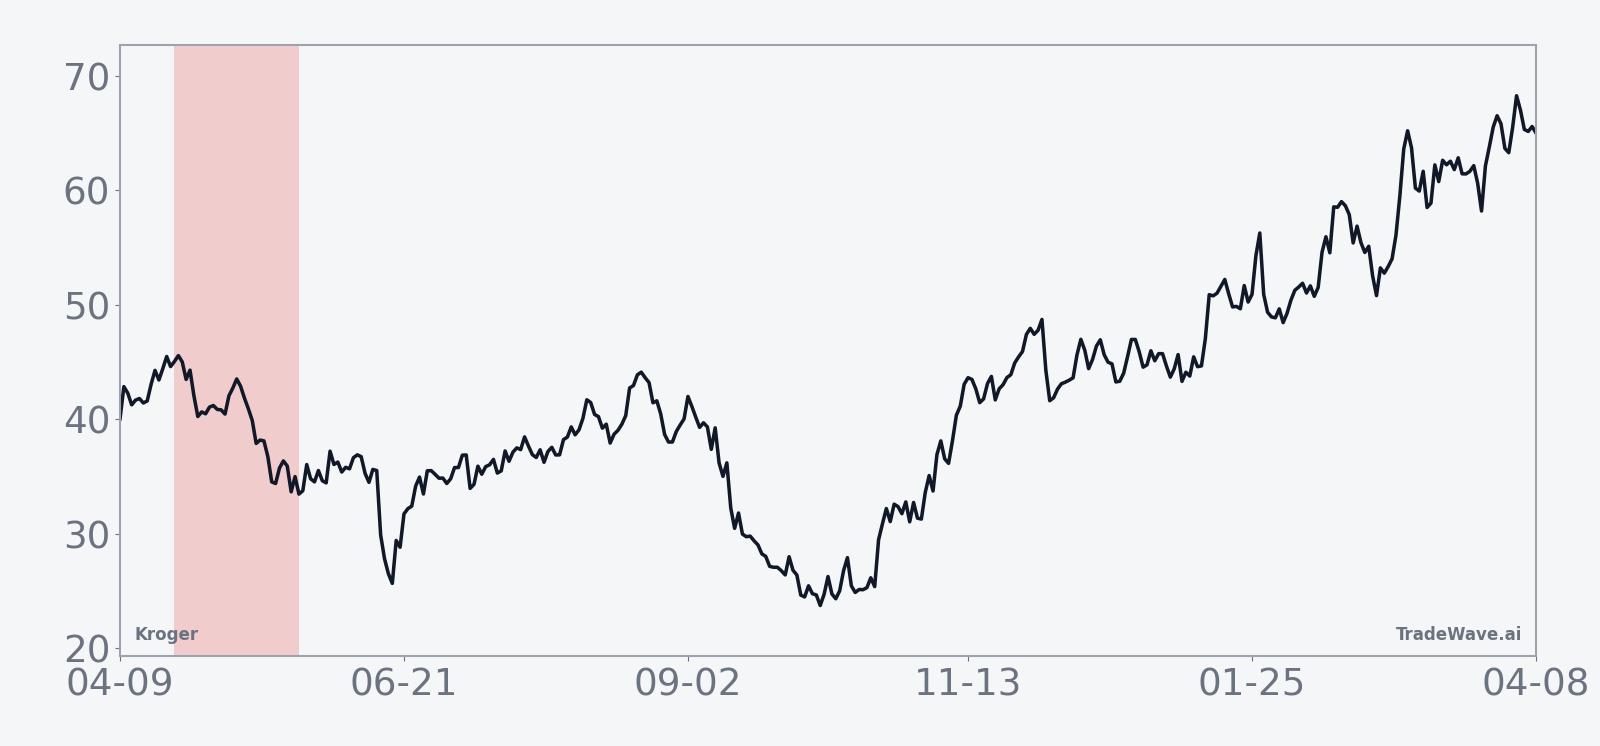
The chart below situates the latest move in its recent multi-month context and overlays a 60-day seasonal projection.
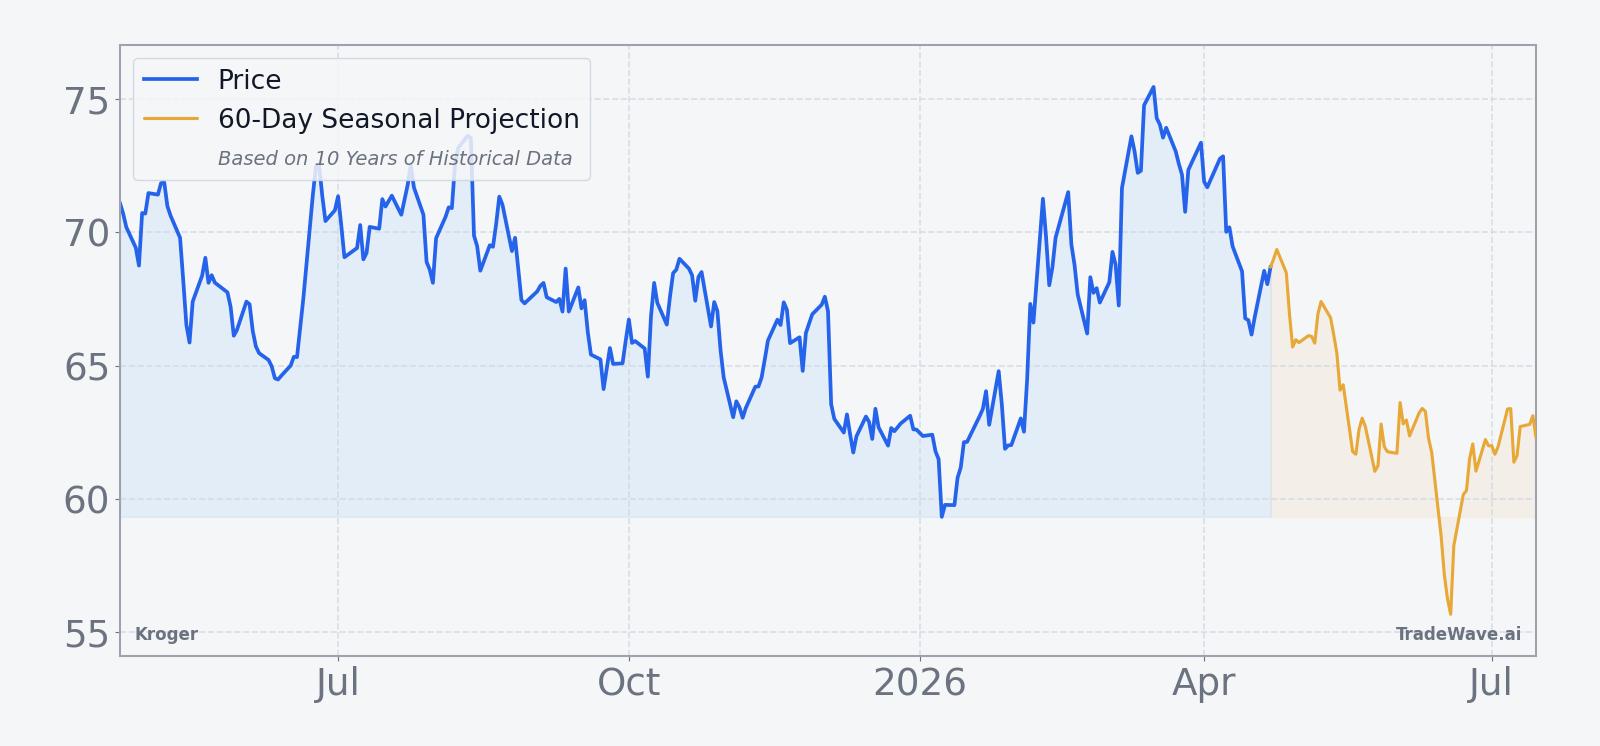
From a positioning standpoint, Kroger’s 20-day average volume of about 6.5 million shares suggests liquidity is ample for both institutional and active retail traders heading into this seasonal window.[5] The stock is trading almost exactly in line with its 50-day moving average near $70.02, which reinforces the idea that the current tape is balanced between bulls and bears rather than stretched in either direction.[5] That neutral setup could make the upcoming late-April seasonal pattern more influential than usual if fresh macro or company-specific news nudges sentiment one way or the other.
On the fundamental side, Kroger’s last detailed guidance update came in early 2025, when the company projected full-year identical sales excluding fuel to rise 2.7% to 3.4% and guided adjusted earnings per share to a $4.60 to $4.80 range, alongside plans for store optimization and heavier e-commerce investment.[3] In June 2025, the grocer reported Q1 2025 results that modestly beat earnings expectations, with identical sales excluding fuel up 3.2% and e-commerce sales growing 15% year over year, underscoring the strength of its digital and fresh offerings even as shoppers sought lower prices and cooked more at home.[2] In September 2025, Kroger raised its annual sales forecast again as grocery demand stayed firm, highlighting the staying power of at-home food consumption even as broader retail spending shifted.[3][6]
Analysts have generally remained constructive on the name, with a Buy consensus rating cited by Forbes in a Q2 2025 preview that also noted a historical 60% chance of a post-earnings rise based on prior reactions.[1] That backdrop of steady earnings delivery and cautious but positive guidance helps explain why the stock is still trading closer to its highs despite the softer tone from management in March 2026.[5] For traders focused on the upcoming KR seasonal trend, the key question is whether that fundamental resilience will blunt the historical late-April weakness or simply provide a higher starting point for any pullback.
Sector-wise, Kroger sits at the intersection of defensive staples and evolving retail grocery trends. In June 2025, CNBC reported that the company’s shares rose after it highlighted how shoppers were seeking lower prices and cooking more at home, with identical sales up 3.4% and investments in private labels and store optimization aimed at protecting market share.[2] Reuters has also pointed to resilient grocery demand amid tariff-related consumer caution, with shoppers gravitating toward larger packs and value offerings, a dynamic that can support volumes but pressure pricing power.[4] That mix of steady traffic and tight margins is exactly the kind of environment where a historically bearish Kroger trading window can matter, because small changes in sentiment around pricing or costs can trigger outsized stock moves.
Corporate actions are another layer. In January 2026, Kroger announced the sale of Vitacost.com, a move that fits its broader strategy of sharpening focus on core grocery, pharmacy and fresh categories while streamlining non-core digital assets.[10] Portfolio clean-up can be a positive for long-term valuation, but in the near term it also reminds investors that management is still reshaping the business under new leadership. That ongoing transition could amplify volatility if the upcoming seasonal window coincides with fresh commentary on pricing, competition or capital allocation.
What should traders watch in this Kroger (KR) window?
For the late-April seasonal window that starts on Apr 23, the first thing to watch is how Kroger behaves around the $70 level and its 50-day moving average. A decisive break below that band early in the window would line up with the historical pattern of mid-window weakness and could signal that the bearish KR seasonal trend is asserting itself again. Conversely, a firm hold or push back toward the 52-week high near $76.58 would look more like the rare 2023-style outlier year for shorts.
Earnings timing also matters. With the next scheduled report not until Sep 10, 2025 for Q2 2025 in the historical record, this particular 33-day stretch is less about a single binary event and more about how investors digest macro data, food inflation headlines and competitive updates.[1][3] Traders should track any commentary from management or peers on promotional intensity and private-label growth, since those themes have repeatedly influenced Kroger’s valuation in past cycles.[2][4][5]
Finally, watch liquidity and tape behavior. If volume picks up meaningfully above the recent 20-day average of about 6.5 million shares while the stock starts to roll over, that would look consistent with prior winning short years in this Kroger trading window.[5] If instead the stock grinds higher on light volume and holds above its 50-day moving average, it would suggest that this iteration may be one of the rare seasons where the historical pattern takes a back seat to a still-supportive fundamental story. Either way, the next 33 trading days after Apr 23 will offer a clean test of whether a decade of historical seasonality still has a say in how Kroger trades.
Sources
- [1] Forbes – Kroger Q2 Preview: 60% Chance Of A Post-Earnings Rise (Sep 09, 2025)
- [2] CNBC – Kroger's shares rise as grocer says shoppers seek lower prices, cook more at home (Jun 20, 2025)
- [3] Reuters – Kroger raises annual sales forecast as grocery demand stays strong (Sep 11, 2025)
- [4] Reuters – Kroger lifts annual sales target on resilient demand for groceries (Jun 20, 2025)
- [5] Reuters – Kroger keeps forecasts soft as new CEO bets on growth by keeping prices down (Mar 05, 2026)
- [6] Reuters – Kroger raises annual sales forecast as Americans stick to eating at home (Sep 11, 2025)
- [7] CNBC – Stocks making the biggest moves midday: Meta Platforms, Kroger, SAIC, PVH, Snowflake and more (Dec 04, 2025)
- [10] Kroger – Kroger Announces the Sale of Vitacost.com, Inc. (Jan 09, 2026)
About this seasonal analysis
Seasonal pattern data is sourced from TradeWave.ai, which analyzes historical price behavior across annual calendar windows going back up to 30 years. Read the full data methodology or the book The 100-Year Pattern by Afshin Moshrefi (2026 edition). Past performance of seasonal patterns does not guarantee future results. This article is for informational purposes only and does not constitute investment advice.