Honeywell (HON) 2026 EPS Guidance Lift Aligns With a 10-for-10 Bullish Spring Run
Honeywell is heading into a historically strong 47-day spring trading window just as shares sit near record highs after a powerful post-earnings run.

What is the seasonal pattern for Honeywell (HON)?
Honeywell has risen in 10 of 10 years during this late-March-to-mid-May window, with an average gain of 3.44% in winning years.
- 10 for 10 in this window, averaging 3.44% gains in winning years across the past decade.
- The 47-day spring window begins on Mar 31 and has delivered a 39% cumulative return over 10 years for long exposure.
- Percent Profitable is 100%, with 10 winners and 0 losers in the historical sample.
- Typical gains cluster around a 3.2% median profit, with a Sharpe ratio of 1.43 for end-of-window results.
- The TradeWave Ratio of 2.86 signals that price has often traveled meaningfully in the long direction within the window.
- Intraperiod swings can be sharp, with some years showing double-digit drawdowns before finishing higher.
According to historical data from TradeWave.ai, this upcoming stretch for Honeywell has behaved very differently from an average month on the calendar, and the next iteration starts this week.
How has Honeywell (HON) traded in this late-March seasonal window?
Honeywell has posted gains in every single late-March-to-mid-May window for the past 10 years, averaging a 3.44% profit for long positions. The next 47-day window opens on Mar 31, with the stock last trading at $223.12, about 10.1% below its 52-week high of $248.18 and up roughly 16% year to date.[1] That combination of a strong historical spring pattern and a stock still shy of its recent peak gives this Honeywell trading window unusual weight for investors watching the industrial and aerospace cycle.
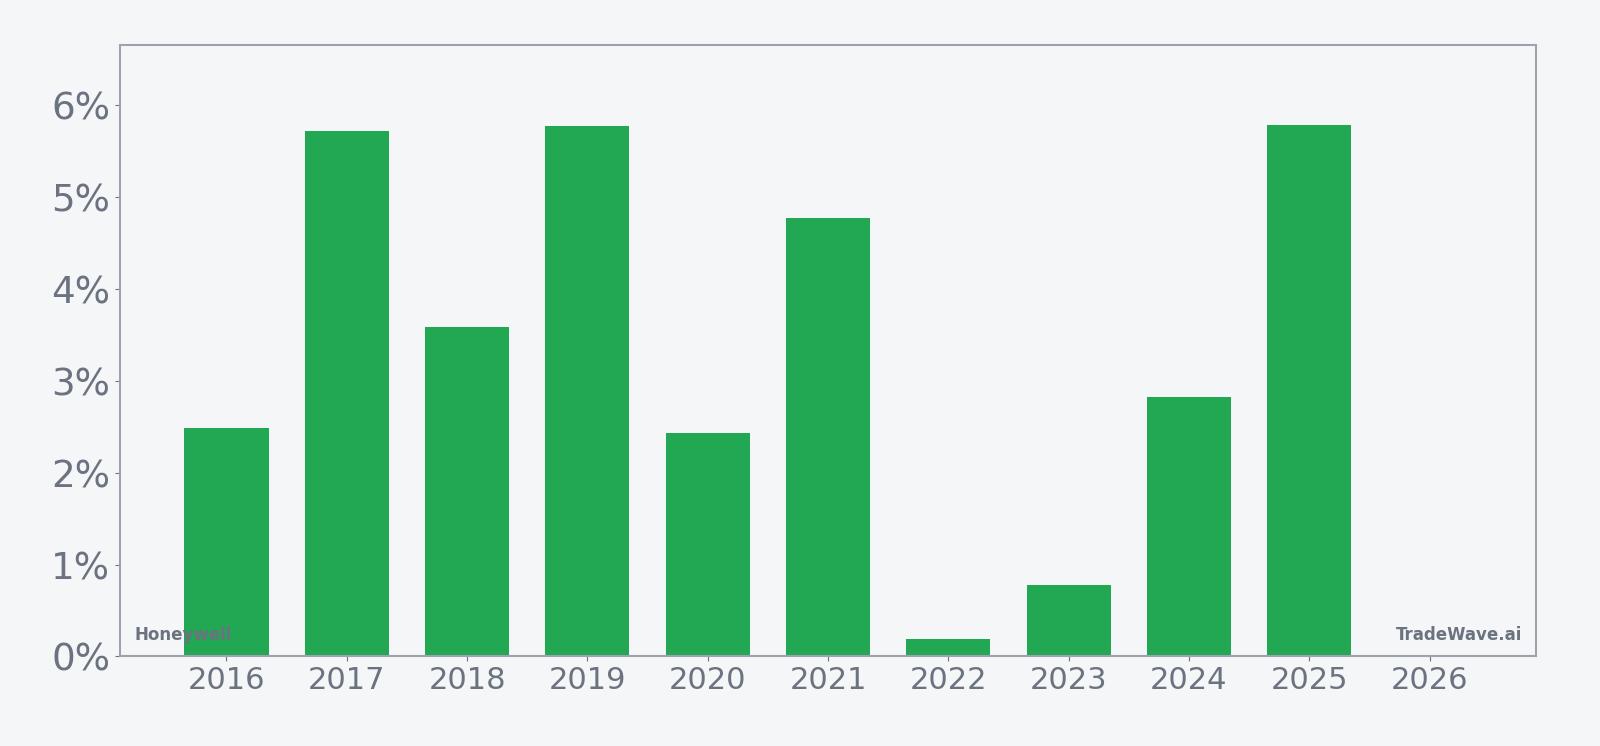
Across the 10-year sample, the strongest years for this Honeywell seasonal trend were 2019 and 2025, with net gains of 5.77% and 5.79% respectively, while the softest outcome still finished slightly positive at 0.19% in 2022. Average winners gained 3.44%, and the median profit of 3.2% shows that results have clustered around mid-single-digit advances rather than being skewed by one outlier year. For a long-only pattern, that kind of consistency is rare.
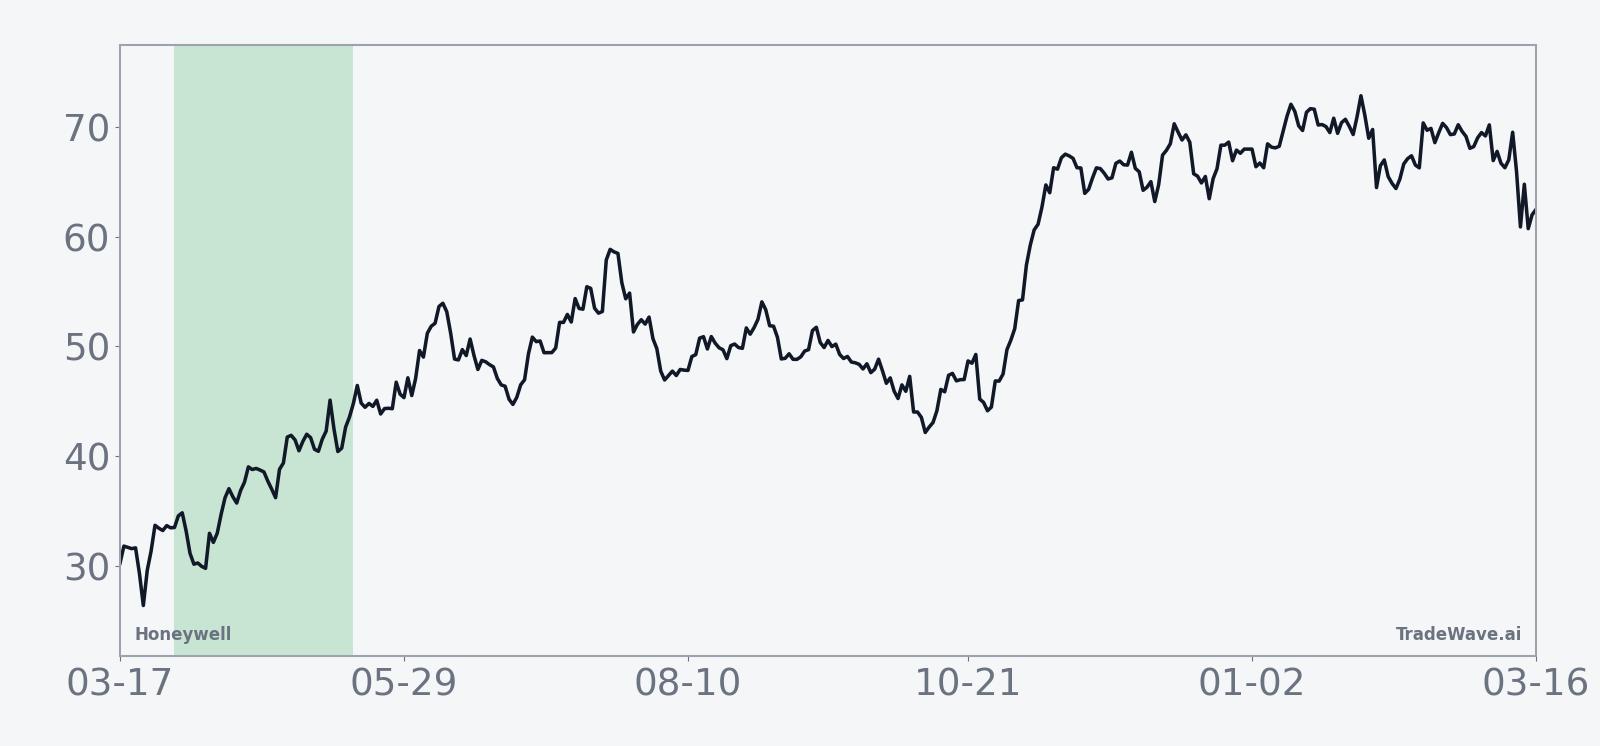
The historical seasonal average suggests that Honeywell’s gains in this window tend to build gradually rather than in a single burst. The trend chart shows a modest early lift, a mid-window consolidation, and then a firmer push into the back half of the 47 days, which fits a pattern of investors digesting earnings and guidance before leaning back into the stock.
A closer look at yearly best and worst swings inside the window shows how much upside and downside Honeywell has historically packed into this stretch.
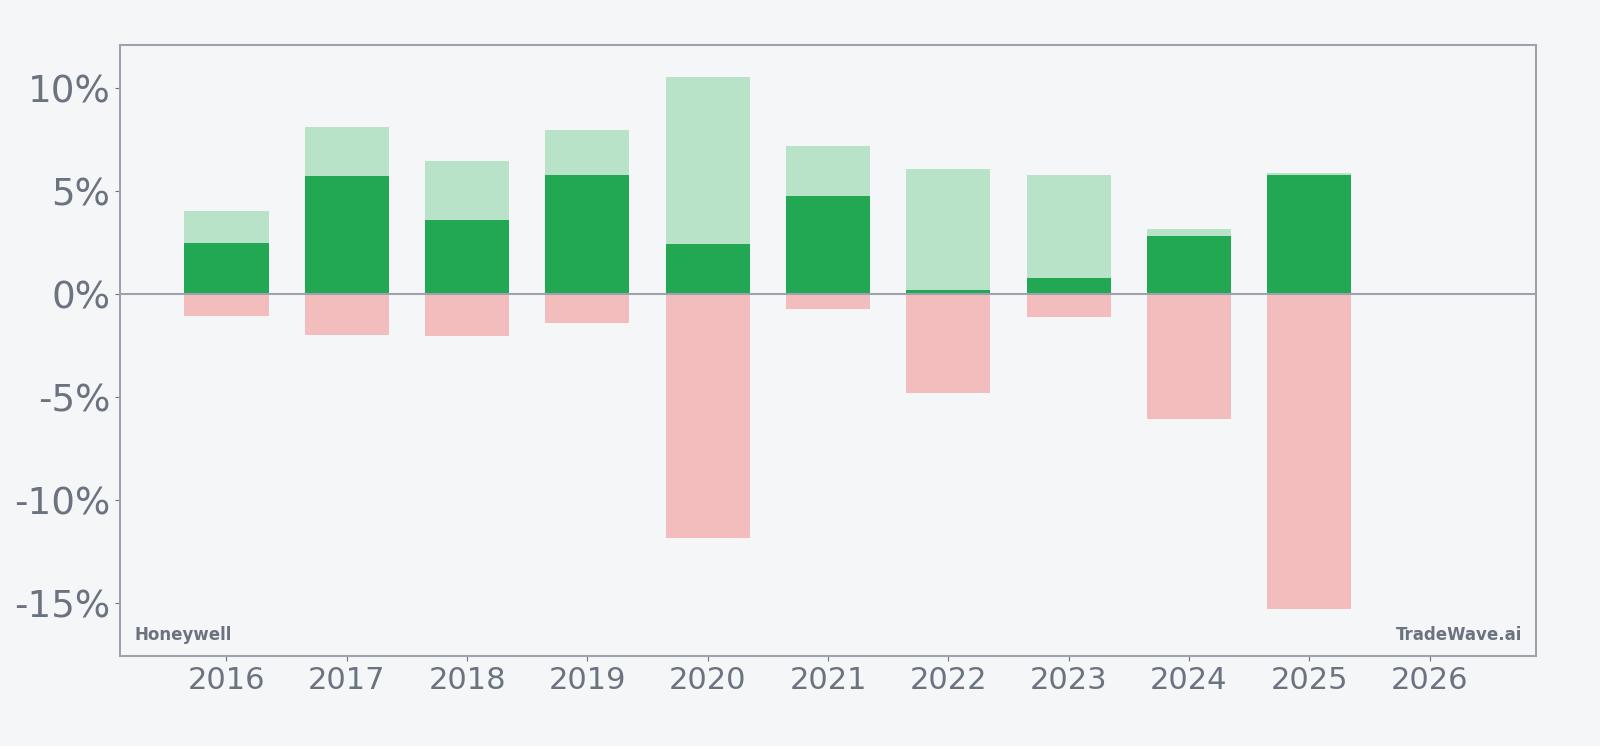
Maximum favorable moves inside the window have been sizable, with several years posting peak run-ups above 7% and one year, 2020, touching a 10.52% intraperiod gain before settling back to a 2.43% net profit. On the downside, maximum adverse excursions have at times been deep, including a 15.3% drawdown in 2025 and an 11.82% dip in 2020 before the stock recovered by the end of the window. That mix of strong MFE and occasionally large MAE means this Honeywell trading window has historically rewarded patience but demanded a high tolerance for swings along the way.
Put simply, this is a bullish seasonal pattern with teeth: 10 for 10 positive outcomes, mid-single-digit typical gains, and a history of sharp but ultimately temporary drawdowns inside the window.
Why does Honeywell (HON) follow this seasonal pattern?
One likely driver is the clustering of Honeywell’s earnings reports and guidance updates around late winter and early spring, which can reset expectations and trigger follow-through buying in the weeks that follow.[3] The company’s aerospace and industrial exposure also ties it to broader sector rotation, as investors position for mid-year demand in aviation, building automation, and industrial technology.[1] This pattern may reflect institutional portfolio rebalancing into quality cyclicals after earnings clarity, rather than a simple calendar effect.
History does not guarantee future results, and even in a 100% winning window, adverse excursions inside the period have at times been large.
What is driving Honeywell (HON) today?
Honeywell shares closed Monday at $223.12, down 0.9% on the day, leaving the stock about 10.1% below its 52-week high of $248.18 and still up roughly 16% year to date.[1] The pullback comes after a strong run that accelerated when the company reported better-than-expected fourth-quarter results and laid out upbeat 2026 guidance, which helped push the stock more than 7% higher around the time of the announcement.[2][3]
In Q4 2025, Honeywell delivered adjusted earnings per share of $2.59, topping the $2.53 consensus estimate, on $9.8 billion in revenue that grew 6% year over year, with organic sales up 11%.[3][4] Aerospace Technologies and Building Automation led the way, reinforcing the narrative that Honeywell is leaning into higher-growth, higher-margin segments rather than legacy industrial exposure.[3] That earnings beat and mix shift have been central to the stock’s climb into the upper end of its 12-month range.
The company also set 2026 adjusted EPS guidance at $10.35 to $10.65 and projected sales between $38.8 billion and $39.8 billion, signaling confidence in its multi-year growth trajectory.[3][4] Analysts at JPMorgan, cited by CNBC in January 2026, reiterated a Buy rating and a $255 price target as Honeywell’s planned break-up and portfolio optimization progressed, framing the stock as a quality way to play aerospace and industrial technology themes.[5] With the shares trading below that target, the Street still sees room for upside, though the target reflects assumptions made earlier in the year.
Strategically, Honeywell is in the middle of a significant reshaping. In October 2025, the company announced plans to spin off its Aerospace division, a move pitched as a way to unlock value and sharpen the focus of the remaining businesses.[2] At the same time, management has been managing legacy liabilities, including a roughly $470 million charge tied to a potential settlement with Flexjet disclosed in December 2025, which weighed on near-term earnings optics but helped clear the deck for 2026 and beyond.[6]
Sector context has been supportive. Demand in Aerospace Technologies has been robust, with one recent analysis highlighting 23% organic order growth and a record $37 billion backlog, underscoring how Honeywell is plugged into a powerful aviation and defense upcycle.[1] That backdrop has made HON a favored name among investors looking for exposure to both industrial recovery and long-cycle aerospace spending.
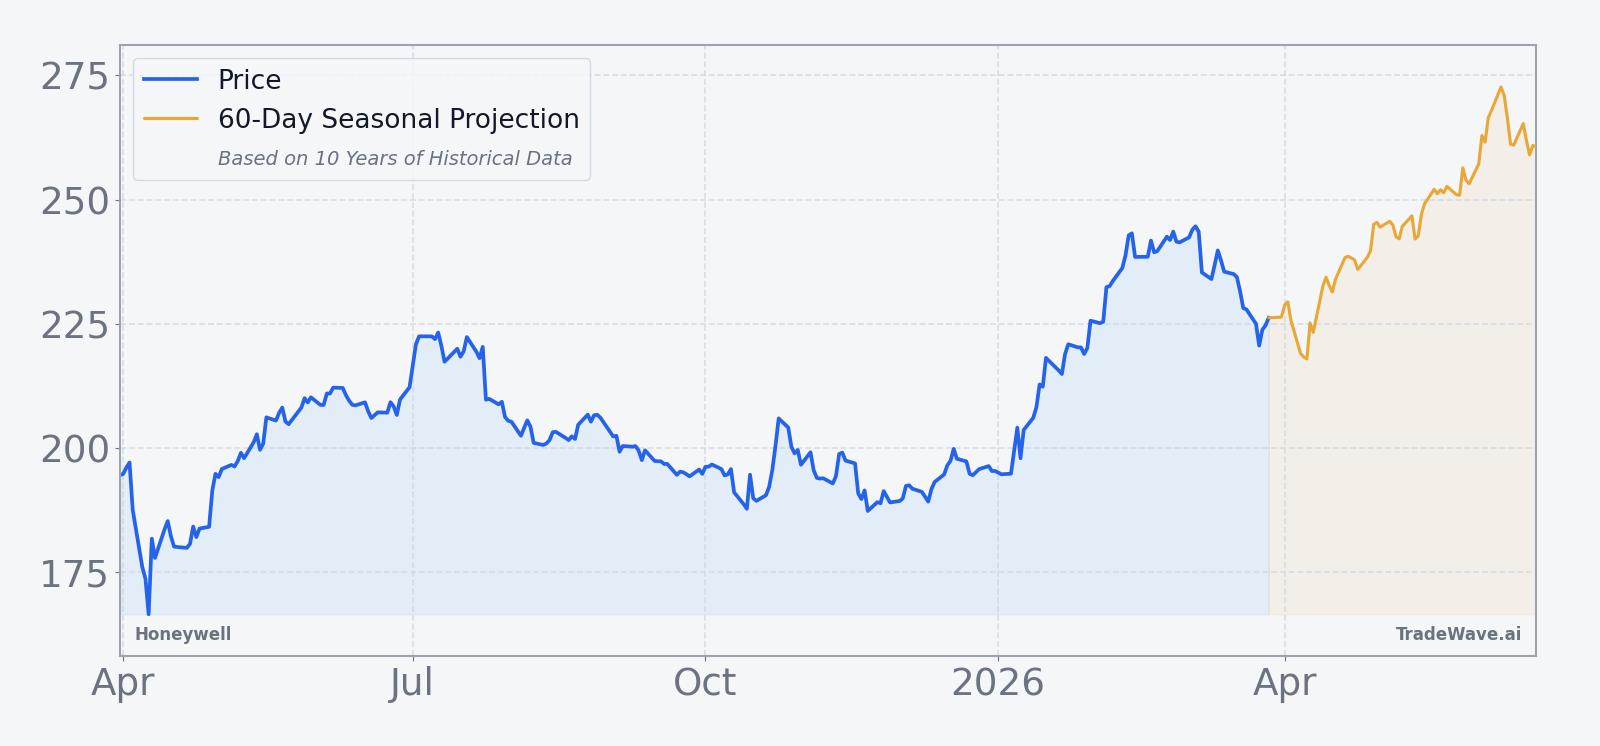
The chart below situates the latest move in its recent multi-month context, alongside a 60-day seasonal projection that reflects the historical spring pattern.
What does the earnings outlook mean for Honeywell (HON)?
Honeywell’s latest quarter gave investors a clean read on both execution and visibility. Adjusted EPS growth of 17% year over year in Q4 2025, combined with 6% reported revenue growth and double-digit organic sales, showed that the company is not just riding macro tailwinds but also expanding margins and mix.[3][4] That kind of earnings quality tends to matter more in a stock pattern analysis when it lines up with a historically strong seasonal window, because it can fuel follow-through buying rather than one-day pops.
The 2026 guidance range of $10.35 to $10.65 in adjusted EPS implies continued mid- to high-single-digit earnings growth from the current base, depending on how the aerospace spin-off and portfolio moves are executed.[3][4] Sales guidance of $38.8 billion to $39.8 billion suggests management is comfortable with demand trends across aerospace, building technologies, and industrial automation, even as global growth expectations remain uneven.[3] For a diversified industrial like Honeywell, that level of visibility into the next year can be a powerful anchor for institutional positioning during the spring trading window.
Street sentiment is broadly constructive. JPMorgan’s Buy rating and $255 target, highlighted in January 2026, framed Honeywell as a beneficiary of its own break-up story and a cleaner, higher-growth portfolio.[5] A Forbes analysis in late January 2026 similarly argued that “smart money” was gravitating toward Honeywell on the back of its aerospace strength and backlog, reinforcing the idea that large investors see the stock as a core holding rather than a tactical trade.[1]
How does the macro and sector backdrop affect Honeywell (HON)?
Honeywell sits at the intersection of several macro themes: commercial aviation recovery, defense spending, industrial automation, and building efficiency. Sector commentary points to particularly strong demand in Aerospace Technologies, where organic orders grew 23% and the backlog reached a record $37 billion, giving Honeywell multi-year revenue visibility in that segment.[1] That kind of backlog-driven growth can smooth out some of the macro noise that typically hits cyclical industrials.
At the same time, Honeywell’s Building Automation and industrial technology businesses are leveraged to capital spending cycles and energy-efficiency upgrades. Those trends tend to ebb and flow with interest rates and corporate confidence, which can inject volatility into the stock even when the long-term story is intact. For traders watching the HON seasonal trend, the key is that the spring window often lands just after management has refreshed guidance, when macro narratives and company-specific data are most aligned.
How are investors valuing Honeywell (HON) into this window?
With the stock at $223.12 and a consensus price target of $255 from JPMorgan via CNBC, Honeywell trades at a discount to that analyst waypoint, though the target reflects assumptions made earlier in 2026 rather than intraday pricing.[5] Recent commentary from both Wall Street and independent research outlets has framed Honeywell as a quality compounder in aerospace and industrial technology, not a deep-value play, which means investors are willing to pay up for visibility and execution.[1][5]
For traders focused on the HON seasonal trend, valuation is less about pinpointing fair value and more about understanding whether the stock is stretched or under-owned heading into a historically strong window. With shares below their 52-week high but well above the 52-week low, Honeywell enters this spring stretch from a position of strength rather than distress, which historically has been the backdrop in many of the prior winning years.
What should traders watch in Honeywell (HON) during this window?
Add it up: Honeywell has gone 10 for 10 in this late-March-to-mid-May window, with steady mid-single-digit gains and a track record of sharp but ultimately temporary drawdowns. That makes the next 47 days a focal point for anyone tracking the HON seasonal trend, especially with the stock riding strong earnings, upbeat guidance, and a robust aerospace backlog into the period.[1][3]
- Price levels: Watch how Honeywell behaves as it approaches the 52-week high near $248. A decisive push toward or through that level during the window would rhyme with prior strong years, while a failure there would mark a break from the historical pattern.[1]
- Post-earnings follow-through: The stock’s more than 7% jump around the latest results showed how sensitive HON can be to guidance and backlog headlines.[2][3] Traders should monitor whether volume and buying interest stay elevated into April and May or fade as the earnings narrative gets fully priced.
- Aerospace and industrial data: Any updates on aerospace orders, defense budgets, or industrial production that affect Honeywell’s end markets could either reinforce or undercut the bullish seasonal bias. Strong order commentary would align with the historical spring strength, while negative surprises would test it.[1][3]
- Intraperiod volatility: Given past maximum adverse excursions that have reached double digits even in winning years, traders should track how deep any pullbacks run inside the window. Shallow, bought-dip behavior would fit the historical script, while a sustained break with no recovery by mid-May would mark a rare deviation from the 10-year pattern.
For now, Honeywell heads into one of its most reliable calendar stretches with momentum, supportive fundamentals, and a sector backdrop that still favors aerospace and industrial technology exposure. The next 47 trading days will show whether that historical edge holds up in a market that has already rewarded the stock for delivering on its story.
Sources
- [1] Forbes – “Why Smart Money Should Buy Honeywell Stock” (Jan 30, 2026)
- [2] CNBC – “Honeywell stock is soaring — why we think there is plenty of more room to run” (Oct 23, 2025)
- [3] Zacks Investment Research – “HON's Q4 Earnings Top Estimates, Aerospace Technologies Sales Up Y/Y” (Jan 29, 2026)
- [4] Yahoo Finance – “HON's Q4 Earnings Top Estimates, Aerospace Technologies Sales Up Y/Y” (Jan 29, 2026)
- [5] CNBC – “Honeywell is a buy as planned break-up continues, JPMorgan says” (Jan 16, 2026)
- [6] Yahoo Finance – “Honeywell expects $470 million charge from Flexjet settlement” (Dec 22, 2025)
- [7] CNBC – “Stocks making the biggest moves premarket: Honeywell, Strategy, Oracle & more” (Dec 22, 2025)
About this seasonal analysis
Seasonal pattern data is sourced from TradeWave.ai, which analyzes historical price behavior across annual calendar windows going back up to 30 years. Read the full data methodology or the book The 100-Year Pattern by Afshin Moshrefi (2026 edition). Past performance of seasonal patterns does not guarantee future results. This article is for informational purposes only and does not constitute investment advice.