McKesson Corporation (MCK) Has Gained in 10 of 10 Spring Windows, Averaging 6.93%
McKesson Corporation is heading into a 42-day spring stretch that has delivered gains every year for a decade, just as the stock cools from February’s earnings spike and trades well below its 52-week high.

What is the seasonal pattern for McKesson Corporation (MCK)?
McKesson Corporation has risen in 10 of 10 years during this April–May window, with an average gain of 6.93% in winning years.
- 10 for 10 in this 42-day spring window, with average gains of 6.93% in winning years.
- Percent Profitable is 100%, with 10 winners and 0 losers across the past decade.
- The window begins on Apr 9 and runs for 42 trading days, forming a consistently bullish MCK seasonal trend.
- Average cumulative return across all years is 94%, reflecting strong compounding across repeated spring windows.
- The TradeWave Ratio (TWR) of 2.67 signals that price has typically traveled meaningfully in the long direction within the window.
- A Sharpe ratio of 2.05 points to unusually strong risk‑adjusted performance for this specific McKesson Corporation trading window.
According to historical data from TradeWave.ai, this upcoming stretch has behaved very differently from an average month on the calendar for McKesson. The next section walks through how that pattern has played out and where the risks have shown up in prior years.
How has McKesson Corporation (MCK) traded in this April–May window?
McKesson Corporation has posted gains in every single iteration of this 42-day April–May window over the past decade, averaging 6.93% per year. The latest window starts on Apr 9, with the stock last changing hands at $856.77 on Apr 7, down 3.1% on the day and about 14.2% below its 52-week high of $999.00.[3] That combination of a strong historical seasonality and a pullback from the highs gives traders a clean backdrop to study how this pattern has behaved in prior years.
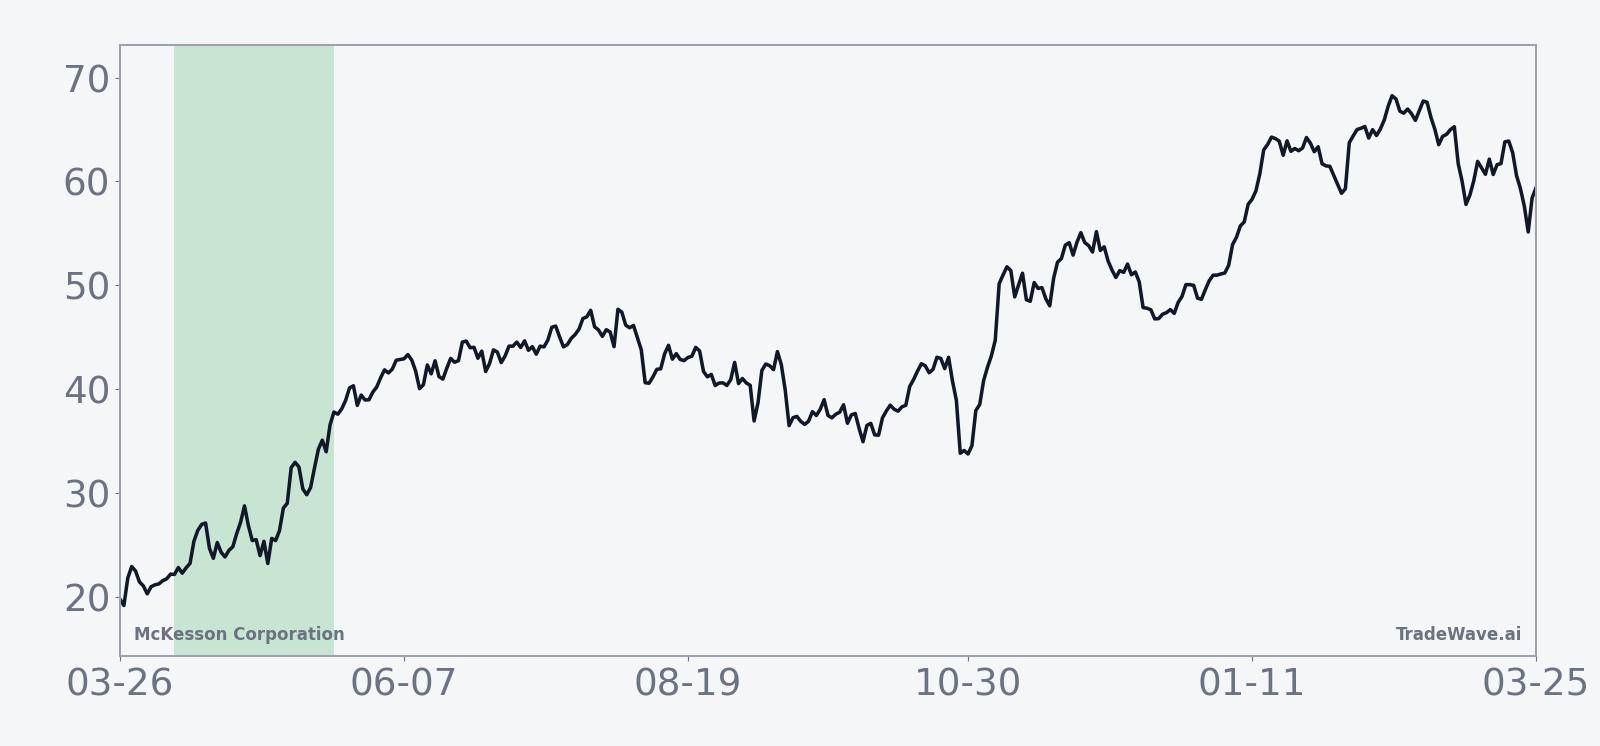
Year-by-year net returns and intraperiod swings help clarify how much upside and downside has actually shown up inside the window.
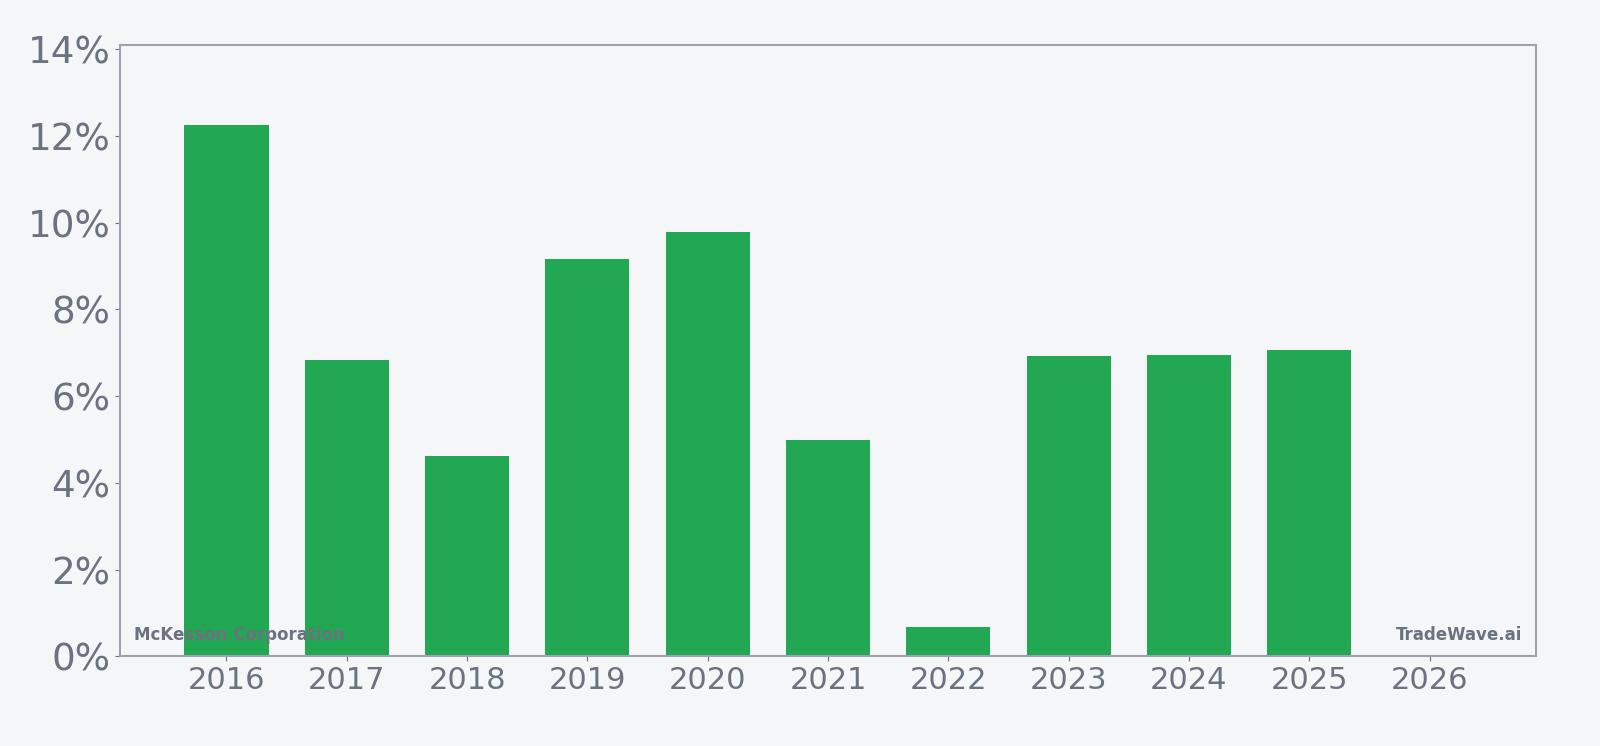
Across the 10-year sample, the trade direction is firmly long. Every year finished positive, with the weakest outcome a 0.68% gain in 2022 and the strongest a 12.26% gain in 2016. Average winners at 6.93% and a 94% cumulative return across all windows underline how consistently this April–May slice has rewarded long exposure.
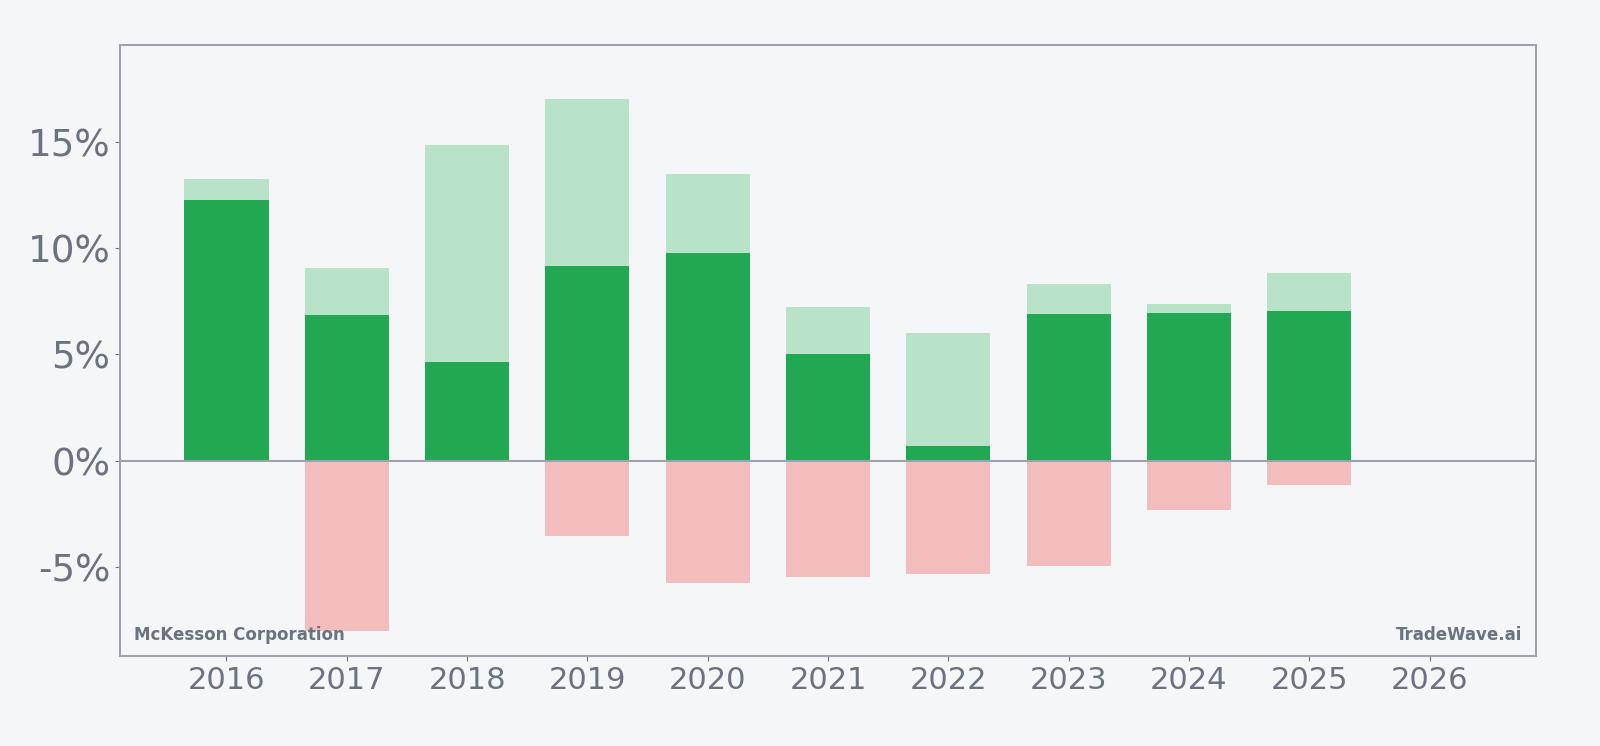
The per-year profile shows that even the softer years still offered meaningful upside at some point in the window. In 2019, for example, McKesson gained 9.15% net with a maximum favorable move of 17.02% from entry, while the worst drawdown from entry was 3.53%. In 2020, the stock finished up 9.78% after a 13.5% peak run-up and a 5.75% intraperiod dip, a reminder that even “good” windows can feel choppy in real time.
The maximum favorable excursion and maximum adverse excursion pattern is especially important for risk management. Years like 2017 and 2020 combined double‑digit peak rallies with adverse moves of 8.02% and 5.75% respectively, showing that traders often had to sit through sizable pullbacks before the window closed higher. By contrast, 2016 and 2025 saw relatively shallow worst drawdowns of 0.02% and 1.13% while still delivering 12.26% and 7.06% net gains, the kind of smooth ride that is rare but memorable.
The 10-year seasonal trend chart suggests that strength tends to build gradually rather than in a single burst. The average path slopes higher through most of the 42 days, with only modest mid-window pauses. The cumulative return chart, which stacks each year’s outcome, shows a steady climb rather than a pattern dominated by one or two outlier years, which supports the idea that this is a recurring MCK seasonal trend rather than a fluke.
Put it together and the message is simple: for the past decade, this April–May window has favored longs in McKesson Corporation, with every year closing higher and several delivering double‑digit percentage gains.
Why does McKesson Corporation (MCK) follow this seasonal pattern?
One likely driver is the healthcare sector’s earnings and guidance cadence, which often clusters around late spring and can reset expectations for drug distribution volumes and specialty demand. Institutional portfolio rebalancing after the first calendar quarter may also steer fresh capital toward defensive growth names like McKesson, especially when guidance has been trending higher. This pattern may further reflect recurring sector rotation into healthcare as investors look for stability heading into the summer.
History does not guarantee future results; adverse excursions (MAE) can be large even in winning windows.
What is driving McKesson Corporation (MCK) today?
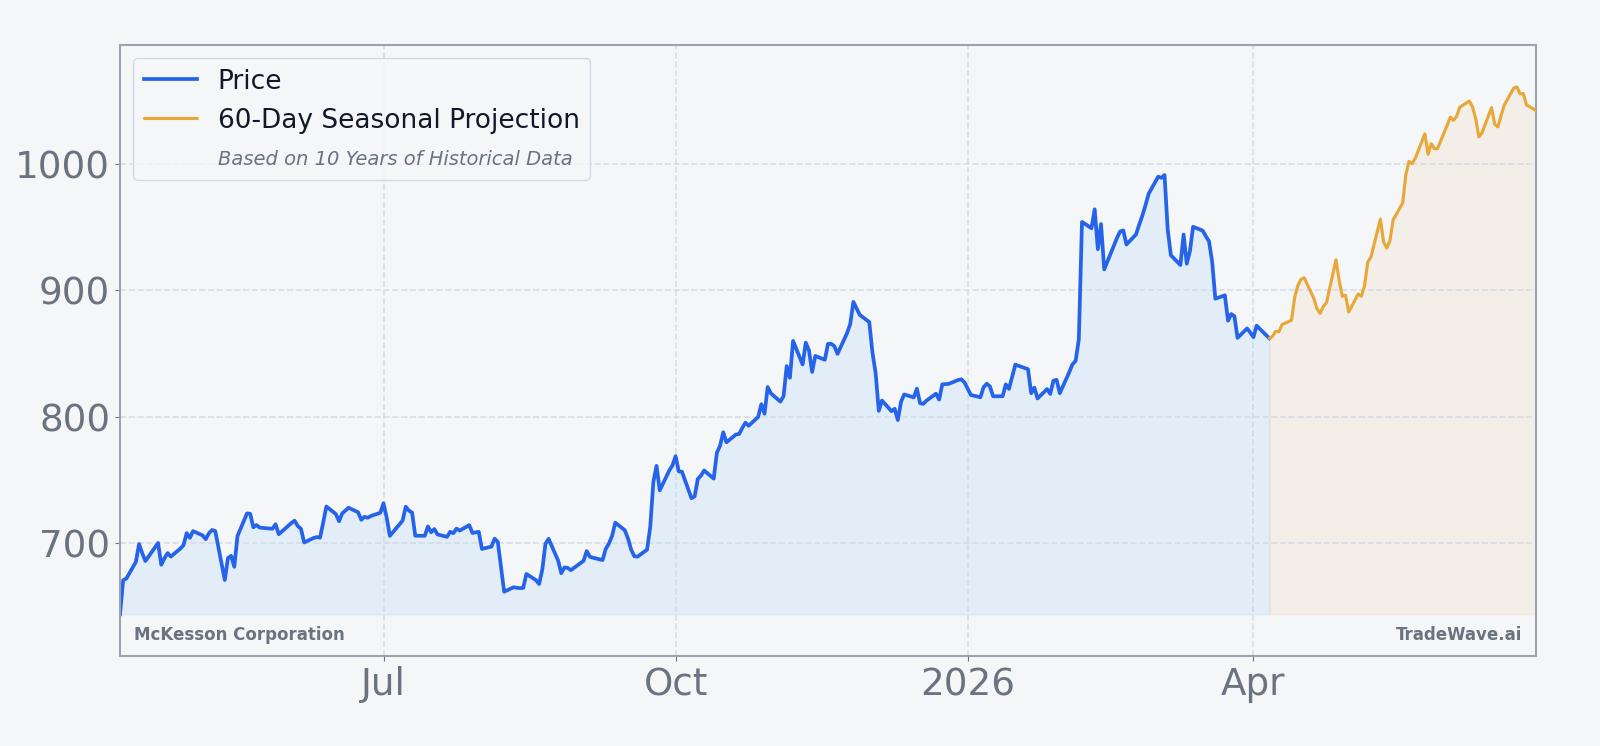
McKesson shares closed at $856.77 on Apr 7, down 3.1% on the session and roughly 14.2% below their 52-week high of $999.00, after sliding about 6.8% over the past month on cooling momentum following a powerful earnings rally.[3] On Feb 6, the stock jumped 17% in a single day on heavy volume after the company reported strong quarterly results and raised its FY2026 adjusted EPS guidance to a range of $38.80 to $39.20, underscoring robust demand for specialty drugs and operational leverage in its U.S. pharmaceutical segment.[3] That surge reset the price level and left McKesson trading at a higher base heading into spring, even as short-term traders have been taking profits into the recent pullback.
In May 2025, McKesson reported fiscal 2025 fourth-quarter revenue of $90.8 billion and adjusted EPS of $10.12, alongside initial FY2026 guidance that has since been raised multiple times as specialty drug volumes and acquisitions have supported growth.[4] Earlier guidance updates in Aug 2025 and Nov 2025 also pushed the FY2026 adjusted EPS outlook higher, reflecting a steady pattern of upgrades as management responded to stronger-than-expected demand in oncology and other complex therapies.[1][2] The sector backdrop remains constructive, with healthcare pharmaceuticals benefiting from robust demand for specialty drugs used in cancer and rheumatoid arthritis, a trend that has been a key tailwind for McKesson’s U.S. pharmaceutical business.[1]
The chart below situates the latest pullback against the past year’s rally and the upcoming seasonal projection.
What does the earnings outlook imply for McKesson Corporation (MCK)?
McKesson’s most recent reported quarter showed Q2 revenue of $103.15 billion versus an estimate of $104.13 billion, while adjusted EPS of $9.86 topped the $9.02 consensus, reinforcing the company’s ability to expand margins even when top-line results are slightly below expectations.[3][4] For fiscal 2025, the company delivered Q4 revenue of $90.8 billion and adjusted EPS of $10.12, and management has since raised FY2026 adjusted EPS guidance multiple times, with ranges spanning from $37.10–$37.90 up to $38.80–$39.20 as demand trends strengthened.[1][2][3][4]
Street-level consensus rating and price target data are not available in the latest snapshot, but the repeated guidance upgrades suggest analysts have been playing catch‑up to a faster earnings trajectory. For traders watching the upcoming seasonal window, the key question is whether the raised FY2026 bar proves conservative or aggressive once the next set of results arrives. A beat‑and‑raise pattern would align with the bullish historical seasonality, while any sign of margin pressure or slowing specialty volumes could test that pattern.
How does the healthcare backdrop shape McKesson Corporation’s seasonal outlook?
McKesson sits at the center of the healthcare pharmaceuticals supply chain, and the sector’s current theme is clear: robust demand for specialty drugs, particularly in oncology and autoimmune conditions, is driving growth in its U.S. pharmaceutical segment.[1] These therapies are complex, high‑value products that tend to be less sensitive to short‑term economic swings, which can make McKesson’s earnings stream more resilient than many cyclical names.
That resilience matters for seasonality. When macro uncertainty rises, investors often rotate toward defensive growth sectors like healthcare, and distributors that benefit from secular drug trends can attract incremental capital. If broader markets wobble into late spring, McKesson’s role as a critical infrastructure player in specialty drugs could reinforce the historical pattern of strength in this April–May window.
How should traders frame valuation and risk for McKesson Corporation (MCK)?
Specific valuation markers such as forward P/E or dividend yield are not included in the latest data set, but the stock’s behavior around earnings offers some clues. A 17% one‑day jump on Feb 6 following a guidance hike suggests investors were willing to pay up for McKesson’s earnings power and visibility, especially in its specialty drug franchise.[3] The subsequent 6.8% one‑month pullback and the stock’s position about 14.2% below its 52‑week high indicate that some of that enthusiasm has cooled, potentially resetting expectations ahead of the seasonal window.[3]
For traders, the key is to separate the historical MCK seasonal trend from the current price regime. A decade of positive outcomes in this window does not remove the risk of a drawdown, particularly if future earnings or sector news disappoint. But when a stock with a history of guidance upgrades and strong specialty demand trades well off its highs heading into a historically strong stretch, the setup becomes one that many quantitative and discretionary desks at least want on their radar.
What should traders watch in McKesson Corporation (MCK) during this window?
First, watch how McKesson trades as the Apr 9 window opens relative to key technical levels around the recent low near $850 and the 52‑week high at $999.[3] A pattern of higher lows and firm buying on dips inside the 42‑day stretch would be consistent with the historical April–May seasonal pattern, while a decisive break lower with expanding volume would mark a clear departure from the past decade’s behavior.
Second, keep an eye on any updates to FY2026 guidance or commentary around specialty drug demand, whether through formal earnings or investor presentations.[1][2][3][4] The strongest historical years in this window have often coincided with improving earnings visibility, so fresh confirmation that oncology and autoimmune volumes remain robust would support the long‑biased seasonal backdrop. Conversely, any hint of pricing pressure or slower growth in high‑margin categories could blunt the pattern’s impact.
Third, monitor sector flows into healthcare pharmaceuticals. If investors rotate back toward defensive growth and drug distributors, McKesson could again become a preferred vehicle for that theme, amplifying the typical seasonal move. If risk appetite instead swings toward more cyclical or speculative areas, the stock may still follow its historical path but with less intensity.
Finally, track intraperiod volatility. Prior windows have featured both strong rallies and meaningful drawdowns before closing higher, so how McKesson behaves on down days inside this stretch will be as important as the final outcome. If the stock absorbs selling pressure with relatively shallow pullbacks and recovers quickly, it would echo the smoother years like 2016 and 2025. Deeper, more persistent dips would not automatically break the pattern, but they would raise the bar for the window to deliver another clean win.
Sources
- [1] Reuters, "McKesson raises annual profit forecast on robust demand for specialty drugs", Nov 5, 2025.
- [2] Reuters, "Mckesson lifts annual profit forecast on robust demand for specialty drugs", Aug 6, 2025.
- [3] Forbes, "How McKesson Stock Surged 17% In A Day", Feb 6, 2026.
- [4] McKesson, "McKesson Reports Fiscal 2025 Fourth Quarter and Full Year Results and Provides Fiscal 2026 Guidance", May 8, 2025.
About this seasonal analysis
Seasonal pattern data is sourced from TradeWave.ai, which analyzes historical price behavior across annual calendar windows going back up to 30 years. Read the full data methodology or the book The 100-Year Pattern by Afshin Moshrefi (2026 edition). Past performance of seasonal patterns does not guarantee future results. This article is for informational purposes only and does not constitute investment advice.