Conagra Brands (CAG) Slides on 6.8% Sales Drop as 65-Day Weak Spring Window Nears
Conagra Brands is hovering just above its 52-week low as it approaches a 65-day spring stretch that has rewarded short-side positioning in every year of the past decade.
What is the seasonal pattern for Conagra Brands (CAG)?
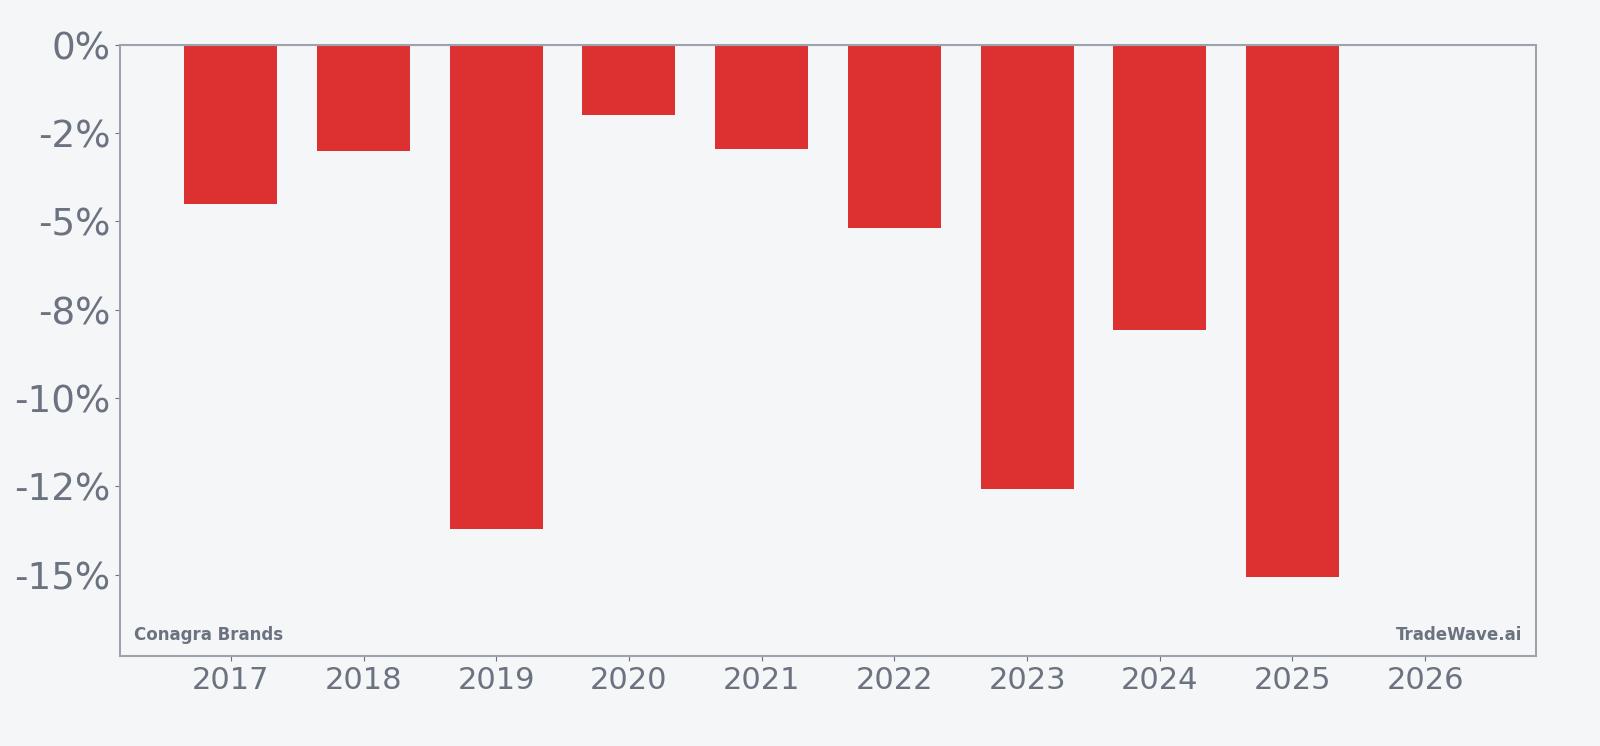
Conagra Brands has fallen in 9 of 9 years during this late-April 65-day window, with an average gain of 7.45% for short positions in winning years.
- 9 for 9 in this window, with short trades averaging 7.45% profit across winning years.
- The pattern runs from Apr 25 for 65 trading days and has delivered a 100% profitable record for shorts, with 9 winners and 0 losers.
- Cumulative return across the nine-year lookback is 89% for the short side, with a Sharpe ratio of 1.33.
- The TradeWave Ratio of 1.99 signals that price has typically moved meaningfully in the trade direction within the window.
- Individual years have seen sizable intraperiod swings, with adverse moves against the short often reaching double digits before the trade finished in the green.
- With CAG trading just 4.6% above its 52-week low, this historically weak spring window arrives against an already pressured backdrop.
According to historical data from TradeWave.ai, this upcoming spring stretch has behaved very differently from an average month on the calendar for Conagra. The next section walks through how that pattern has played out and what it could mean for traders watching CAG into early summer.
How has Conagra Brands (CAG) traded in this late-April seasonal window?
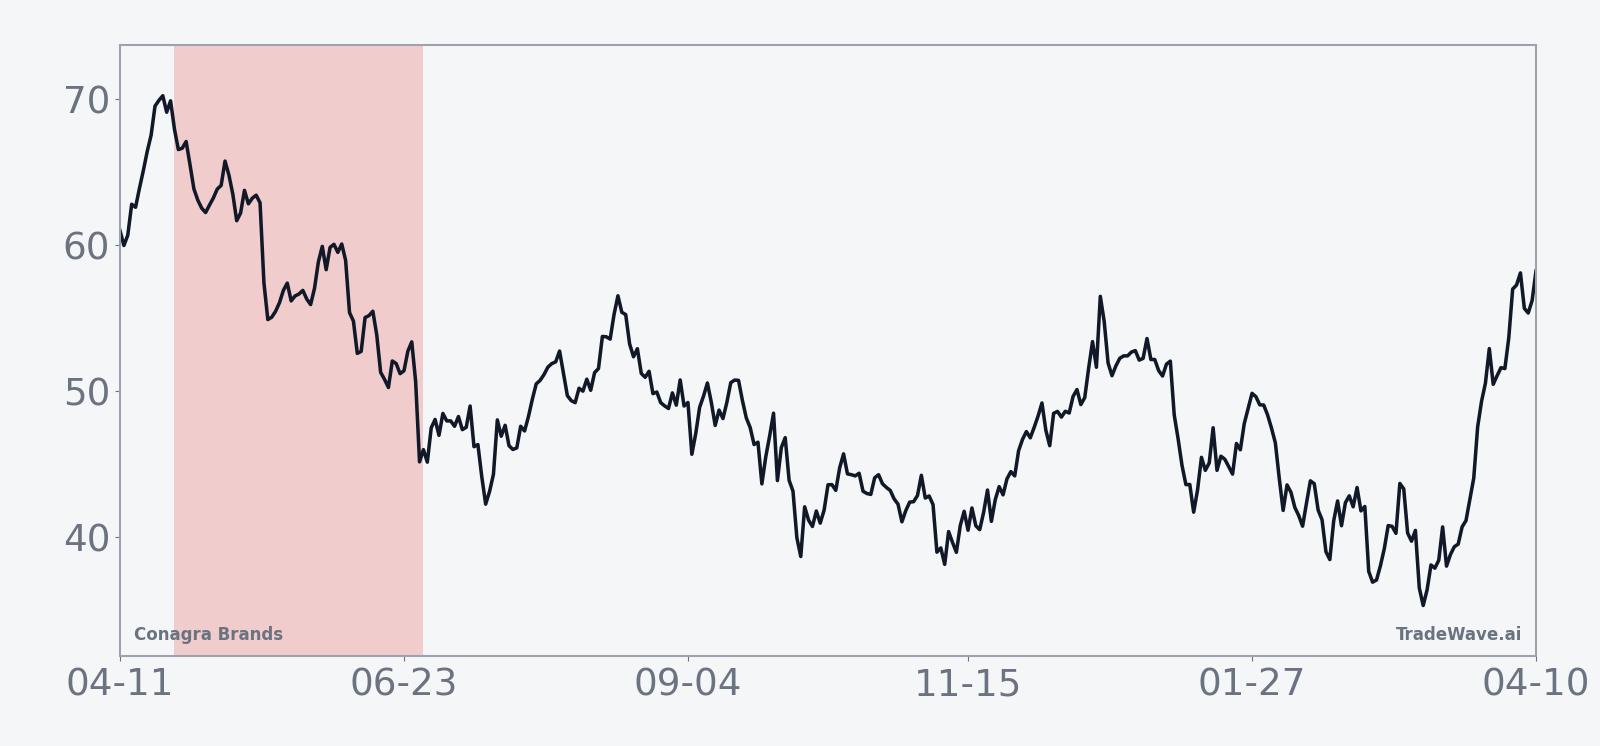
Conagra Brands has produced profitable short-side results in all 9 years of this late-April 65-day window, with average gains of 7.45% for traders positioned short. The stock closed Monday at 15.72, up 1.3% on the day and sitting about 4.6% above its 52-week low of 15.04 while more than one-third below its 52-week high of 23.94. That combination of a heavy longer-term slide and a historically weak spring window gives this year’s setup extra weight for anyone tracking the CAG seasonal trend.
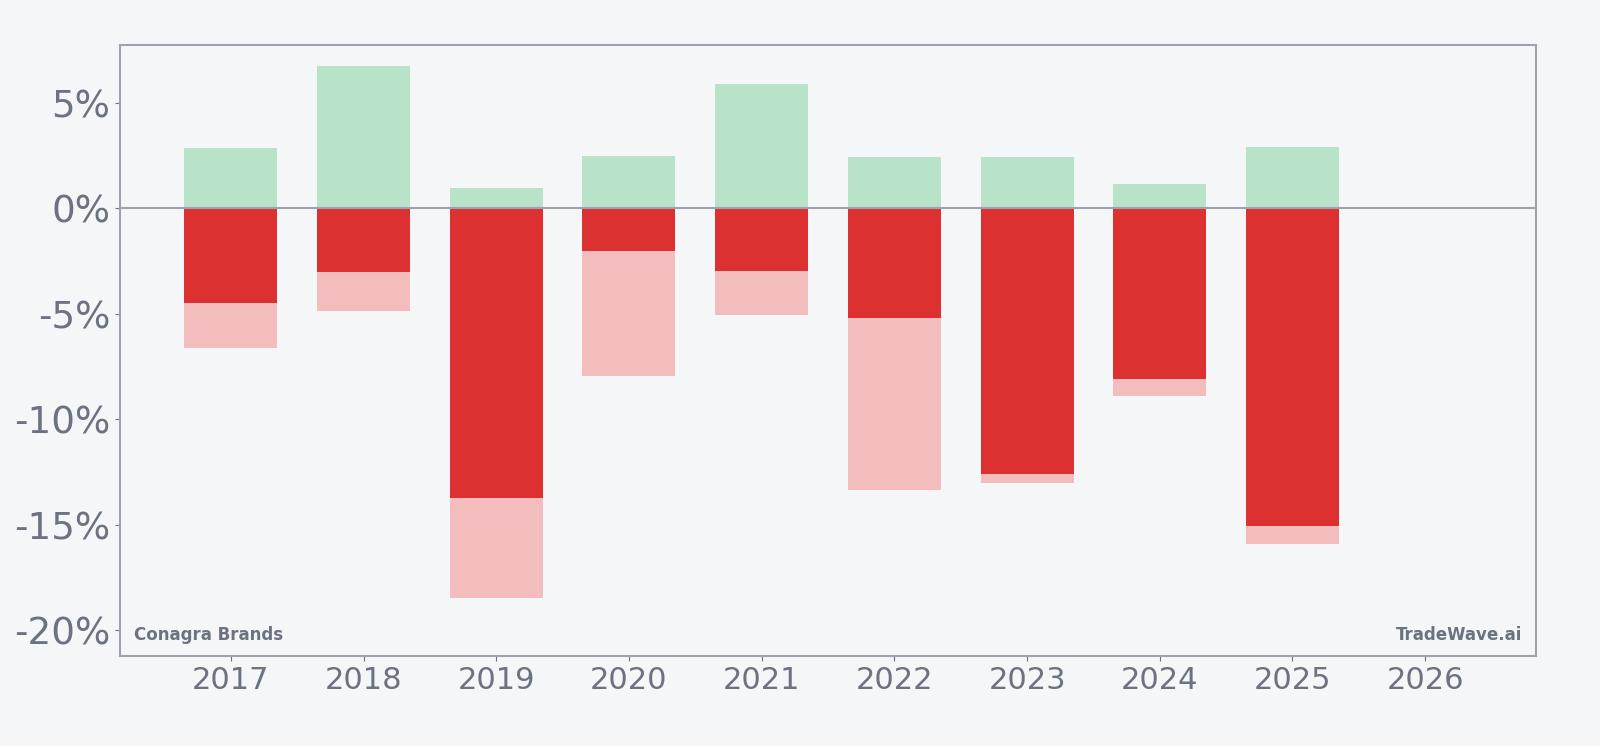
A stacked view of net returns alongside best and worst intraperiod swings shows how far CAG has tended to move in both directions during this stretch.
Across the nine-year sample, every iteration of this Conagra Brands trading window has ended with the stock lower, which is positive for a short setup. The median profit for shorts is 5.18%, and the cumulative return across all years is 89%, a strong record for a single recurring slice of the calendar. The Sharpe ratio of 1.33 indicates that, based on end-of-window outcomes, returns have been favorable relative to volatility.
Individual years show that the path to those profits has not been smooth. In 2019, for example, CAG dropped 13.72% from entry to exit, but the worst intraperiod drawdown against the short reached 18.47% before the trade finished in the green. In 2025, the stock fell 15.06% over the window, yet the maximum adverse move against the short was 15.93%, underscoring how sharp countertrend rallies can appear inside an ultimately bearish stretch.
The maximum favorable move, or best point-to-peak decline in favor of the short, has often been more modest than the worst drawdown. Several years show maximum favorable excursions in the low single digits while maximum adverse moves run into high single or low double digits. That profile suggests a window where the final result has tended to favor shorts, but where timing and risk management matter because squeezes against the position can be large before the trend reasserts itself.
The average seasonal trend line tilts steadily lower across the 65 days, with most of the pressure clustering in the middle of the window rather than at the open or close. Early days often show choppy action, followed by a more decisive slide, then a tendency for the stock to stabilize or bounce into the end of the period. The cumulative return chart reinforces that pattern, with a relatively flat start, a pronounced downslope through the middle third, and a leveling off into the final weeks.
Put together, the pattern is clear: this late-April through early-summer stretch has historically favored short exposure in Conagra Brands, delivering consistent profits but with intraperiod swings that can be uncomfortable for anyone leaning into the move too aggressively.
History does not guarantee future results; adverse excursions can be large even in windows that have ultimately finished profitably for the short side.
Why does Conagra Brands (CAG) follow this seasonal pattern?
One likely driver is the company’s fiscal calendar, with key earnings updates and guidance resets often landing around this period and shaping expectations for the rest of the year. Packaged-food names also tend to feel the impact of shifting consumer spending patterns after the winter holidays, when shoppers trade down or pull back on discretionary grocery items. This seasonal pattern may reflect a mix of those earnings catalysts, cost pressures and portfolio repositioning as investors reassess defensive consumer staples exposure heading into summer.
What is driving Conagra Brands (CAG) today?
Conagra Brands shares closed Monday at 15.72, up 1.3% on the session, in a range between 15.24 and 15.74 on heavy volume of about 17.0 million shares. That leaves the stock roughly 34.4% below its 52-week high of 23.94 and only about 4.6% above its 52-week low of 15.04, underscoring how hard the name has been hit over the past year.
In October 2025, Conagra reported fiscal first-quarter revenue of $2.63 billion, slightly ahead of estimates, with adjusted earnings of 39 cents per share topping expectations and driving a 4% pop in the stock as investors cheered resilient demand for pantry staples.[1][3] In December 2025, the tone shifted when the company disclosed a 6.8% sales decline and a quarterly loss tied to noncash charges and softer consumer spending, reinforcing concerns that higher living costs were pressuring volumes even in the value-focused packaged-food aisle.[2] Management has flagged an expected low-7% rise in cost of goods sold, including a 3% hit from tariffs, and has leaned on cost-saving initiatives to protect margins in that environment.[1][2]
Those crosscurrents sit on top of a tougher macro backdrop for staples. In October 2025, inflation and tariffs were already squeezing input costs and nudging shoppers toward cheaper private-label options, a trend that has persisted into this year.[1] By late 2025, analysts were highlighting how challenged consumer spending was weighing on Conagra’s volumes, even as the company tried to push through price increases to offset higher costs.[2] With the stock now pinned near its lows, the market is effectively waiting for the next clear read on whether Conagra can stabilize sales without sacrificing profitability.
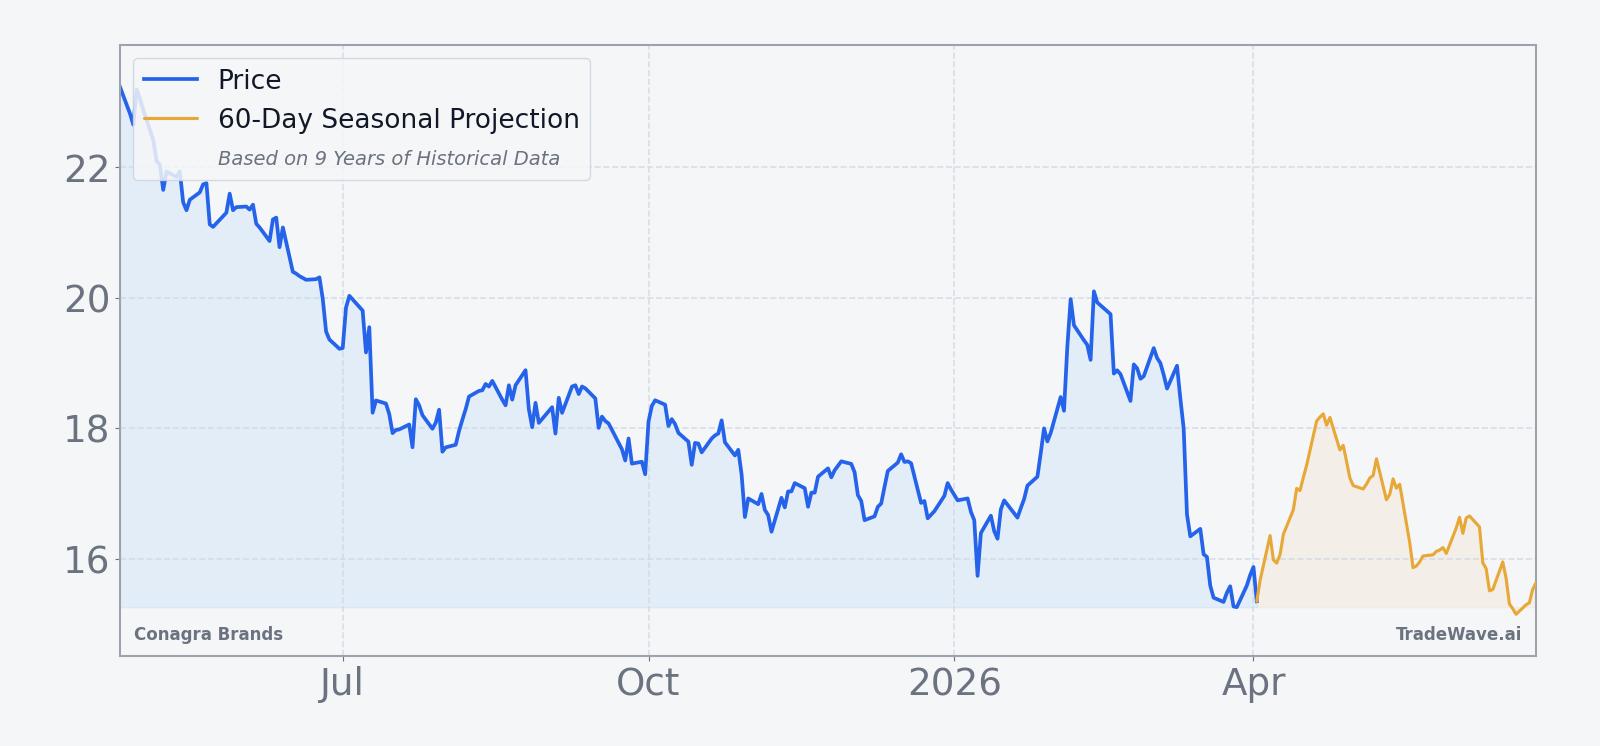
The chart below situates the latest move against the past year of trading and a 60-day seasonal projection.
What should traders watch in this Conagra Brands seasonal window?
The next iteration of this 65-day window begins on Apr 25, landing just as Conagra navigates a fragile balance between cost inflation and pressured consumer demand. With the stock already deep below its 52-week high, traders will be watching whether any bounce into the start of the window fades the way it has in prior years or whether buyers finally absorb the selling pressure. A sustained move back above the 50-day moving average near 17.72 would signal that this year’s tape is breaking from the historical pattern, while another failure near that level would fit the established bearish seasonal script.
On the fundamental side, any updates on pricing, promotional intensity or tariff impacts will matter, especially if management revisits its expectation for a low-7% rise in cost of goods sold and the 3% tariff drag.[1][2] Traders will also track volume trends in the grocery aisle as a real-time gauge of whether value-seeking shoppers are trading down from branded products like Conagra’s portfolio. If the stock sells off into or during the window in line with history, the focus will shift to how deep the intraperiod rallies run and whether those squeezes resemble the double-digit adverse moves seen in 2019 and 2025 before the short-side trend reasserted itself.
Add it up: a stock near its lows, a decade-long record of profitable short-side spring windows, and a consumer backdrop still wrestling with inflation and tariffs. For traders, the next few months in CAG will be about whether that historical seasonality repeats or finally breaks.
Sources
- [1] Reuters, “Conagra Brands beats quarterly estimates on strong pantry staples demand,” Oct 1, 2025.
- [2] The Wall Street Journal, “Conagra Sales Decline as Consumer Spending Remains Challenged,” Dec 19, 2025.
- [3] CNBC, “Stocks making the biggest moves midday: Pfizer, Nike, Conagra, Corteva, GEO Group, Tesla, Reddit and more,” Oct 1, 2025.
About this seasonal analysis
Seasonal pattern data is sourced from TradeWave.ai, which analyzes historical price behavior across annual calendar windows going back up to 30 years. Read the full data methodology or the book The 100-Year Pattern by Afshin Moshrefi (2026 edition). Past performance of seasonal patterns does not guarantee future results. This article is for informational purposes only and does not constitute investment advice.