Estée Lauder Companies (The) (EL) Has Dropped 8 of 8 Late-April Windows, Averaging 6.43% Short Gains
Estée Lauder Companies (The) is approaching a late-April trading window that has reliably rewarded shorts even as the stock sits well below its 52-week high but remains up double digits year to date.

What is the seasonal pattern for Estée Lauder Companies (The) (EL)?
Estée Lauder Companies (The) has fallen in 8 of 8 years during this late-April six-day window, with an average gain of 6.43% for short positions in winning years.
- 8 for 8 in this window, with short trades averaging 6.43% gains in winning years across the past eight cycles.
- The upcoming pattern runs from Apr 29 for six trading days and has historically favored downside moves in EL.
- Percent Profitable is 100%, with 8 winners and 0 losers for the short-side setup in this specific window.
- Average profit across all years matches the winning-year average at 6.43%, reflecting the absence of losing seasons in the sample.
- Intraperiod swings have been meaningful, with past years showing sizable peak run-ups for shorts alongside notable adverse bounces.
- Add it up: a 62% cumulative return for the pattern over eight years, paired with a TradeWave Ratio of 1.51 and a Sharpe ratio of 1.06.
According to historical data from TradeWave.ai, this late-April stretch has behaved very differently from an average week for EL, and the next iteration is now less than a month away.
How has Estée Lauder Companies (The) (EL) traded in this late-April window?
Estée Lauder Companies (The) has delivered short-side gains in every one of the past eight late-April six-day windows, with an average profit of 6.43% for traders positioned short. The next window begins on Apr 29, with EL currently at 69.12, about 43.2% below its 52-week high of 121.64 yet still up roughly 16% year to date.[4] That combination of a bruised long-term chart and a strong, repeatable short window makes this slice of the calendar stand out on the beauty giant’s trading map.
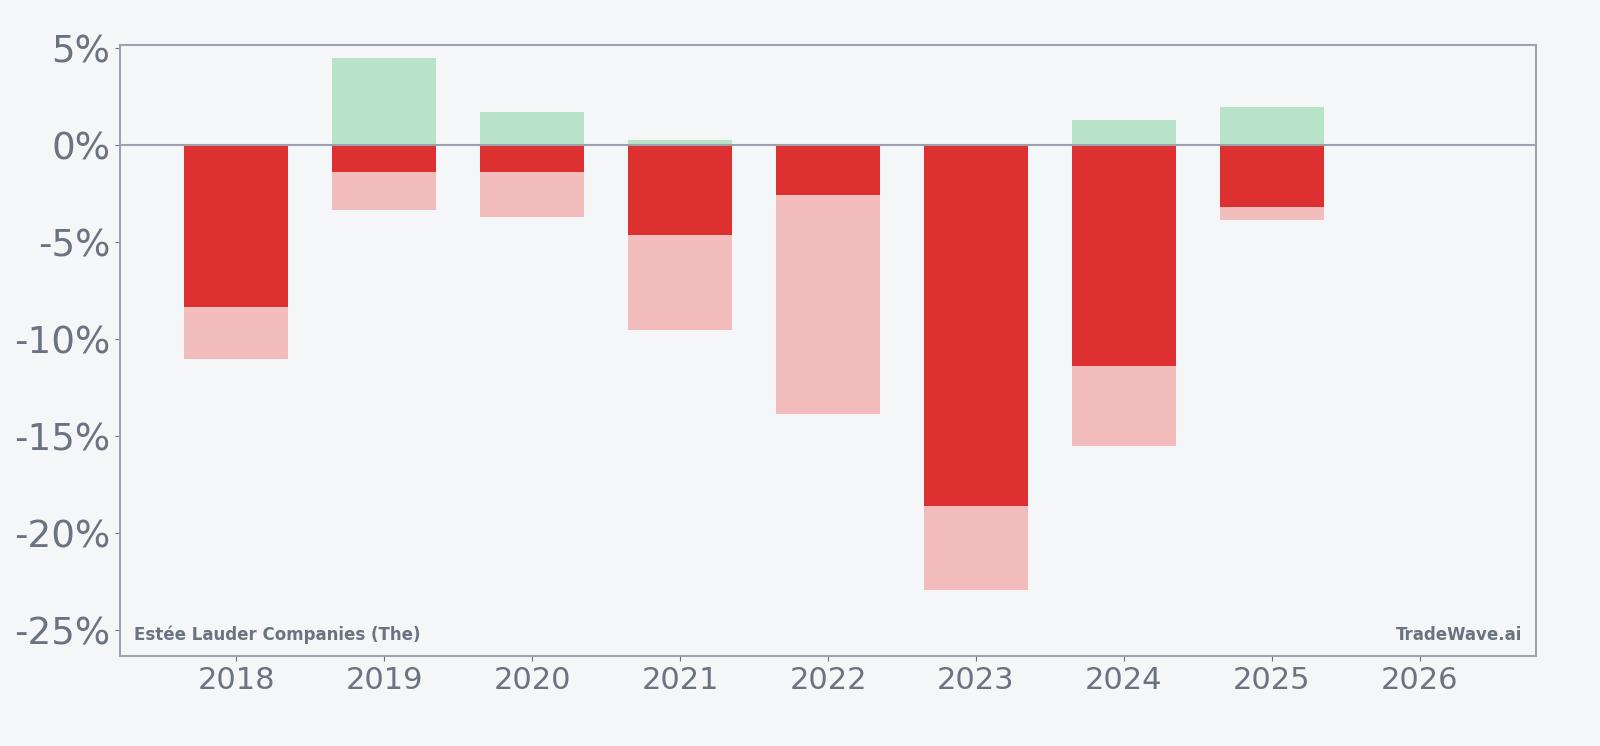
A combined view of net returns with peak favorable and worst adverse moves shows how far EL has tended to travel inside this window.
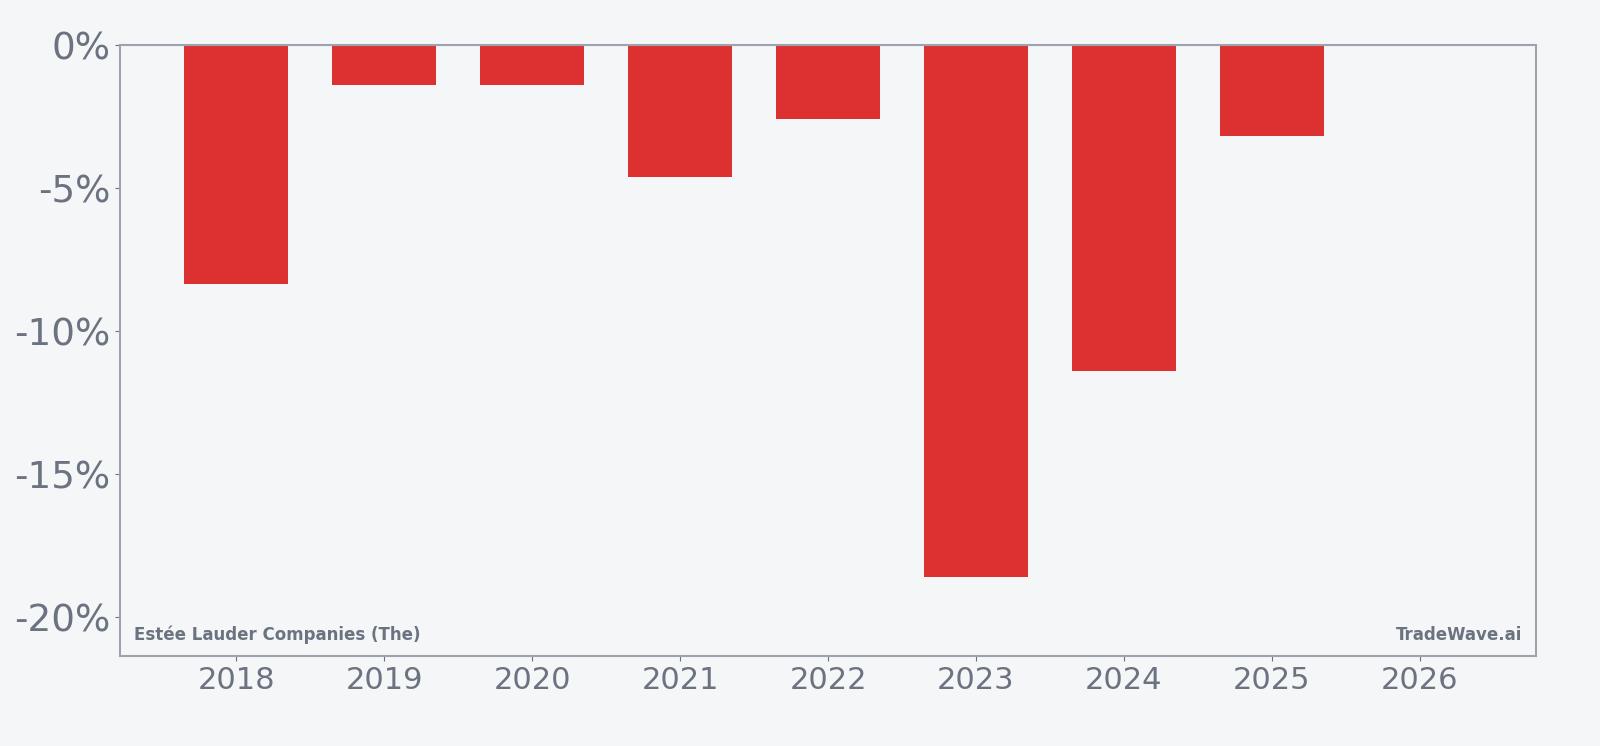
Across the eight-year sample, the pattern is unambiguously aligned with the short trade direction. Percent Profitable sits at 100%, with 8 winners and 0 losers, and a 62% cumulative gain for the strategy over the period. Average profit of 6.43% per window is sizable for a six-day stretch, and the median outcome of 3.9% shows that even the “typical” year has delivered meaningful downside for the stock.
The per-year breakdown shows how that plays out in practice. The strongest year in the sample was 2023, when EL dropped 18.58% across the window, while the softest outcome was 2019 and 2020, each with a 1.4% decline. In 2018 and 2024, the stock fell 8.34% and 11.38% respectively, reinforcing that this is not just a low-volatility drift lower but a window that has often captured sharp air pockets.
Intraperiod behavior has been choppy, which matters for anyone trying to time entries. Maximum favorable excursion, the best point-to-peak move for shorts, has ranged from modest to very large, while maximum adverse excursion, the worst drawdown against shorts, has at times been steep. In 2023, for example, the worst move against the short position reached 22.91% before the trade finished deep in the green, underscoring how violent bounces can be even in winning years.
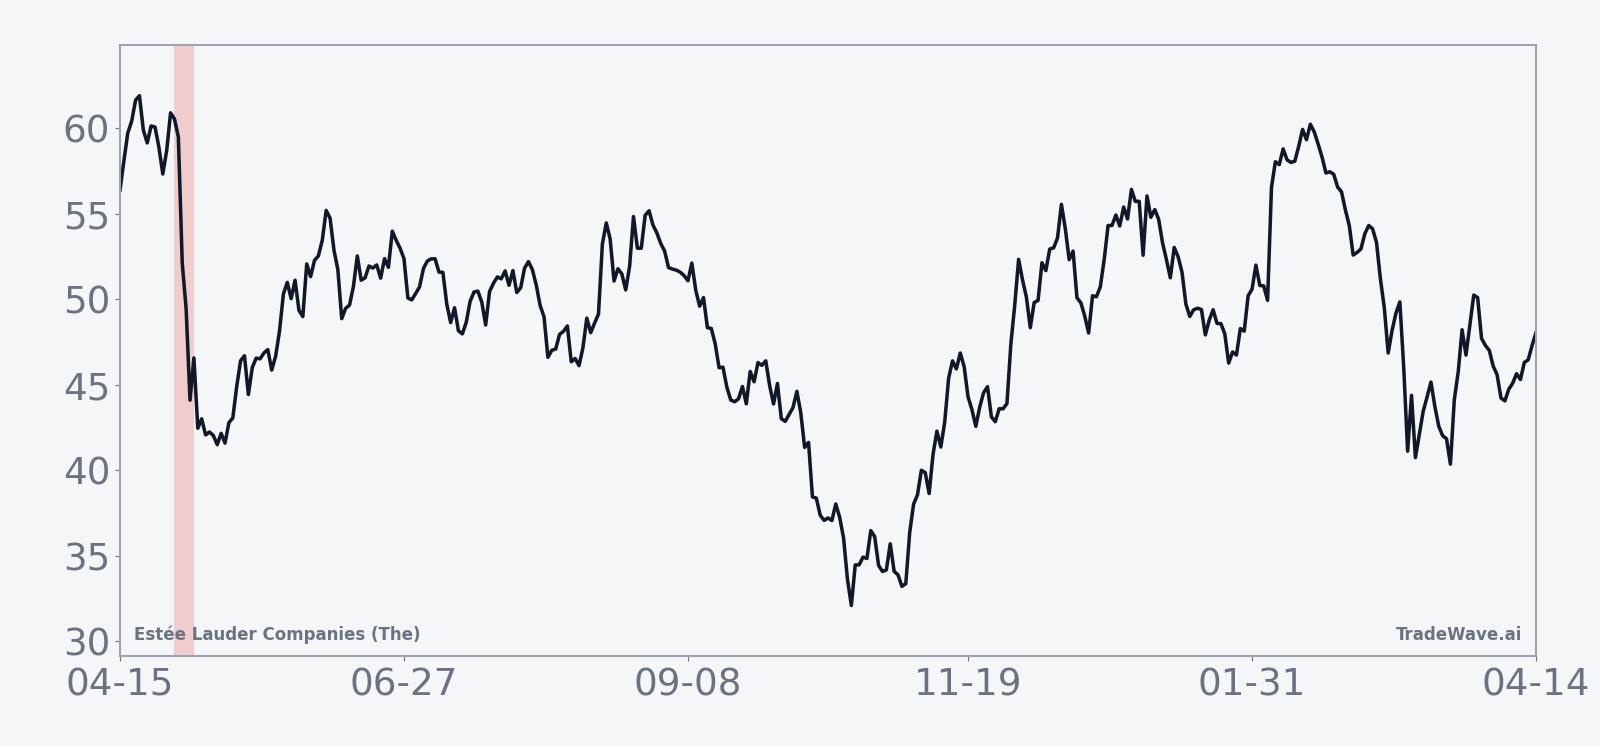
The historical seasonal trend chart suggests that weakness often builds quickly once the window opens. In several years, the bulk of the decline has come in the first few sessions, followed by either stabilization or a partial snapback. That profile fits a pattern where traders use late April to reset positioning in consumer and beauty names, creating short, sharp bursts of selling rather than a slow grind.
Put together, the message is simple: this six-day late-April window has been a consistent, high-velocity downside stretch for EL, with every year in the sample rewarding short exposure but often after enduring sizable intraperiod swings. History does not guarantee a repeat, but eight for eight is a record that is hard to ignore.
Why does Estée Lauder Companies (The) (EL) follow this seasonal pattern?
One likely driver is the company’s fiscal and earnings rhythm, which tends to cluster guidance updates and analyst revisions around the spring period, prompting portfolio managers to rebalance exposure in consumer and beauty stocks. This pattern may also reflect broader sector rotation, as investors shift from defensives into more cyclical names heading into summer, pressuring premium beauty valuations. In addition, options expiration and hedging flows around late April can amplify short-term moves when sentiment is already fragile.
History does not guarantee future results; adverse excursions can be large even in winning windows, and traders using this pattern should be prepared for sharp countertrend moves inside the six-day stretch.
What is driving Estée Lauder Companies (The) (EL) today?
EL closed at 69.12 on Apr 6, down 2.25% on the day, extending a rough month that has left the stock about 27.9% lower over the past 30 days even as it remains up roughly 16% year to date.[4] That puts the shares about 43.2% below their 52-week high of 121.64 and still comfortably above the 52-week low near 47.16, with volume of 8.3 million shares on Monday running well ahead of the 20-day average of about 5.9 million.[4] The pullback comes after a powerful early-2026 rebound that was fueled in part by a pair of high-profile analyst upgrades and growing confidence in the company’s turnaround plan.[1][3]
In January 2026, Raymond James lifted EL to Strong Buy with a $130 price target, calling the stock a top pick for the year as management executes on its Profit Recovery and Growth Plan.[3] That followed a Goldman Sachs upgrade to Buy in October 2025, which argued that a return to topline growth and improved EBIT margins could justify a move toward $115 per share, implying roughly 31% upside from then-current levels.[1] The upgrades helped shift sentiment after a difficult stretch marked by restructuring charges and demand softness in key markets.
Those restructuring efforts were not small. In December 2025, Estée Lauder disclosed a $1.14 billion restructuring charge tied to its two-year Profit Recovery and Growth Plan, including workforce reductions and other cost actions aimed at rebuilding profitability.[2] Management has signaled that the heavy lifting on restructuring is largely behind it and that the focus is now on reigniting growth, particularly in prestige skincare and travel retail channels.[1][2] Goldman’s analysis suggested that topline growth could return as soon as the September 2025 quarter, with double-digit EBIT margins targeted for fiscal 2027 and beyond.[1]
Sector context matters here as well. Estée Lauder sits in the consumer defensive space, where investors have been weighing the appeal of stable cash flows against questions about pricing power and category growth.[3][4] A March 2026 Forbes comparison of EL with Procter & Gamble framed the debate bluntly, arguing that some investors may prefer P&G’s steadier profile over Estée Lauder’s more volatile turnaround story, even if EL offers more upside if the recovery sticks.[4] That tension between defensive characteristics and cyclical earnings risk has kept the stock’s valuation and positioning in flux.
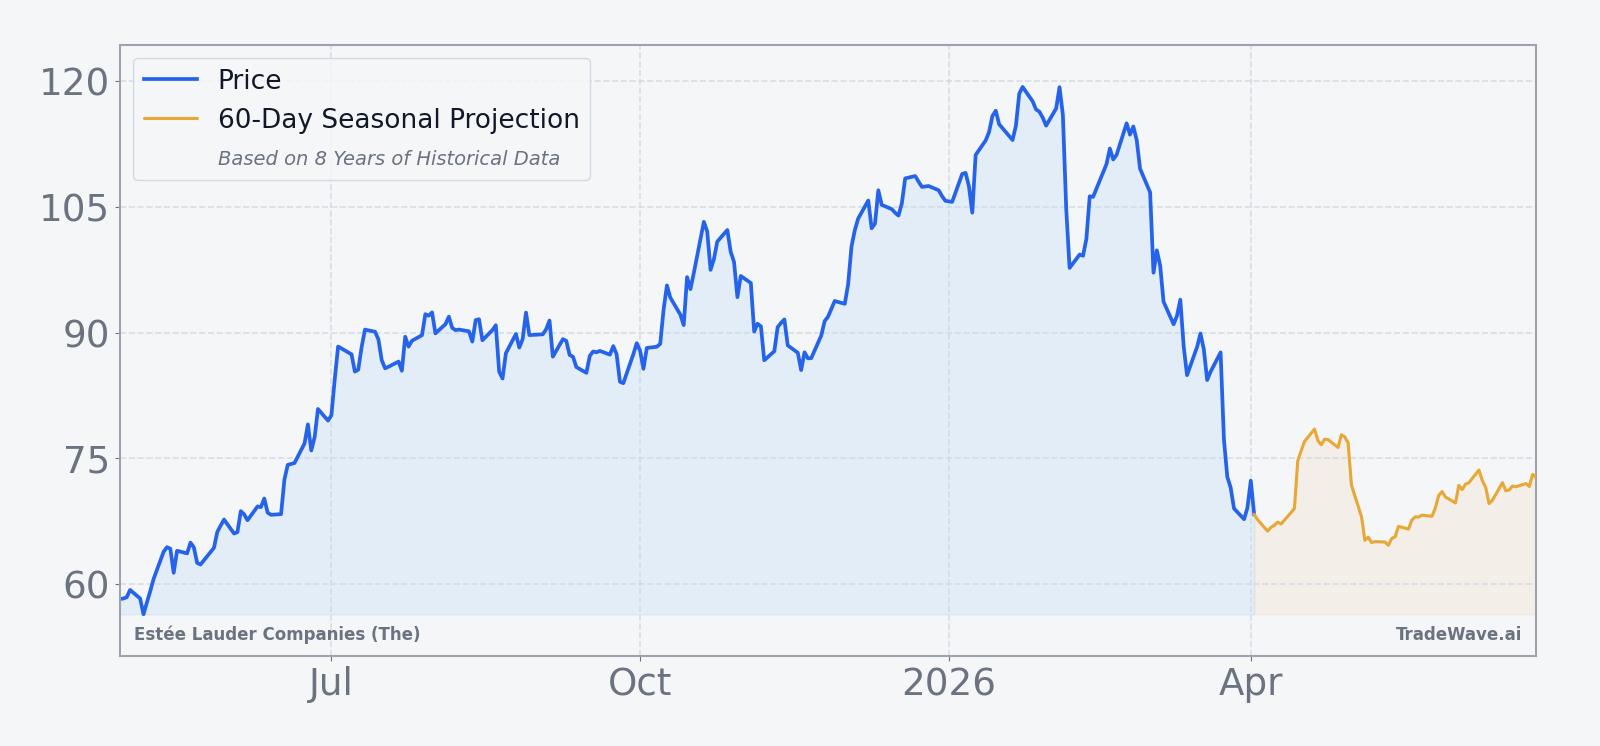
The chart below situates the latest move in its recent multi-month context, alongside a 60-day seasonal projection path.
How do earnings, macro and valuation frame this seasonal setup?
On the earnings front, the next formal report date has not yet been set, but investors are still digesting the impact of the restructuring and the path back to growth.[2][3] Recent commentary has centered on whether travel retail and China demand can stabilize fast enough to support the margin targets embedded in bullish analyst calls.[1][4] With consensus ratings sitting around Hold and a Goldman Sachs-linked consensus target of $115 that reflects an earlier, higher price regime, the street is effectively waiting for proof that the recovery is durable before re-rating the stock further.[1][4]
Macro conditions add another layer. Beauty and personal care spending has held up better than some discretionary categories, but currency swings and uneven global growth have complicated the outlook for multinational consumer names.[4] Within the consumer defensive sector, investors have been rotating between staples with strong pricing power and those, like EL, that are more exposed to premium demand and travel flows.[3][4] That backdrop can amplify short-term moves around any catalyst, including the kind of calendar-driven trading window highlighted by the seasonal data.
Valuation is caught between those crosscurrents. After the recent slide, EL trades well below the levels that underpinned the $115 to $130 analyst targets cited in late 2025 and early 2026, which were set when the stock was higher and sentiment was improving.[1][3][4] Bulls argue that the current price bakes in a lot of execution risk on the Profit Recovery and Growth Plan, while bears point to the restructuring charge and still-uncertain growth trajectory as reasons to demand a discount.[2][4] That push and pull is the backdrop against which the late-April seasonal window will unfold.
What should traders watch as the late-April window approaches?
First, the calendar itself matters. The six-day window starting Apr 29 has historically been a concentrated period of downside for EL, with every year in the past eight delivering a profitable outcome for short positions and several years posting double-digit declines. Traders will be watching whether the stock starts to weaken into that date, which would be consistent with prior patterns, or whether dip buyers step in early and blunt the move.
Second, price levels and volatility will be key. On the downside, the 52-week low near 47.16 is a longer-term reference point, while on the upside, any sustained push back toward the 50-day moving average around 98.23 would signal that the recent selloff is losing steam.[4] Inside the window itself, behavior around short-term support and resistance zones will help confirm whether this year is tracking closer to the milder 1% to 3% declines of 2019 and 2020 or the sharper drops seen in 2018, 2023 and 2024.
Third, watch for how the turnaround narrative evolves. Any incremental news on the Profit Recovery and Growth Plan, travel retail trends or China demand could intersect with the seasonal window and either reinforce or overwhelm the historical pattern.[1][2][4] If management commentary or third-party data points hint at faster-than-expected margin recovery, the stock could react differently than in past years, even within the same calendar slot.
Finally, liquidity and sector flows will shape how tradable the pattern is. Volume has already been running above average during the latest pullback, and further spikes around late April would suggest that institutional investors are actively repositioning in consumer defensives.[3][4] If that repositioning lines up with the historical late-April weakness, the seasonal window could once again deliver outsized moves; if flows instead rotate back into EL, a break from the eight-for-eight record would be an important signal that the stock’s trading regime is changing.
Sources
About this seasonal analysis
Seasonal pattern data is sourced from TradeWave.ai, which analyzes historical price behavior across annual calendar windows going back up to 30 years. Read the full data methodology or the book The 100-Year Pattern by Afshin Moshrefi (2026 edition). Past performance of seasonal patterns does not guarantee future results. This article is for informational purposes only and does not constitute investment advice.