Waters Corporation (WAT) to Buy Becton Unit in $17.5B Deal as Long-Term Rally Window Opens
Waters Corporation shares trade around $320 as the stock approaches a historically strong 244-day seasonal window that has delivered double-digit average gains and sizable swings for lab-equipment investors.

What is the seasonal pattern for Waters Corporation (WAT)?
Waters Corporation has risen in 13 of 14 years during this late-April-to-year-end window, with an average gain of 12.61% in winning years.
- 13-for-14 record in this window, with winners averaging 12.61% gains and only one losing year across the sample.
- Seasonal window begins Apr 29 and runs 244 trading days, covering most of the mid-year through early-year trading calendar.
- Percent Profitable stands at 93%, with 13 winners and 1 loser across the 14-year lookback.
- Average profit across all years, including the lone loss, is still a robust 12%, pointing to a strong bullish seasonal bias.
- The weakest year saw a modest 1.94% loss, while several years posted net returns above 20%, highlighting both upside and volatility.
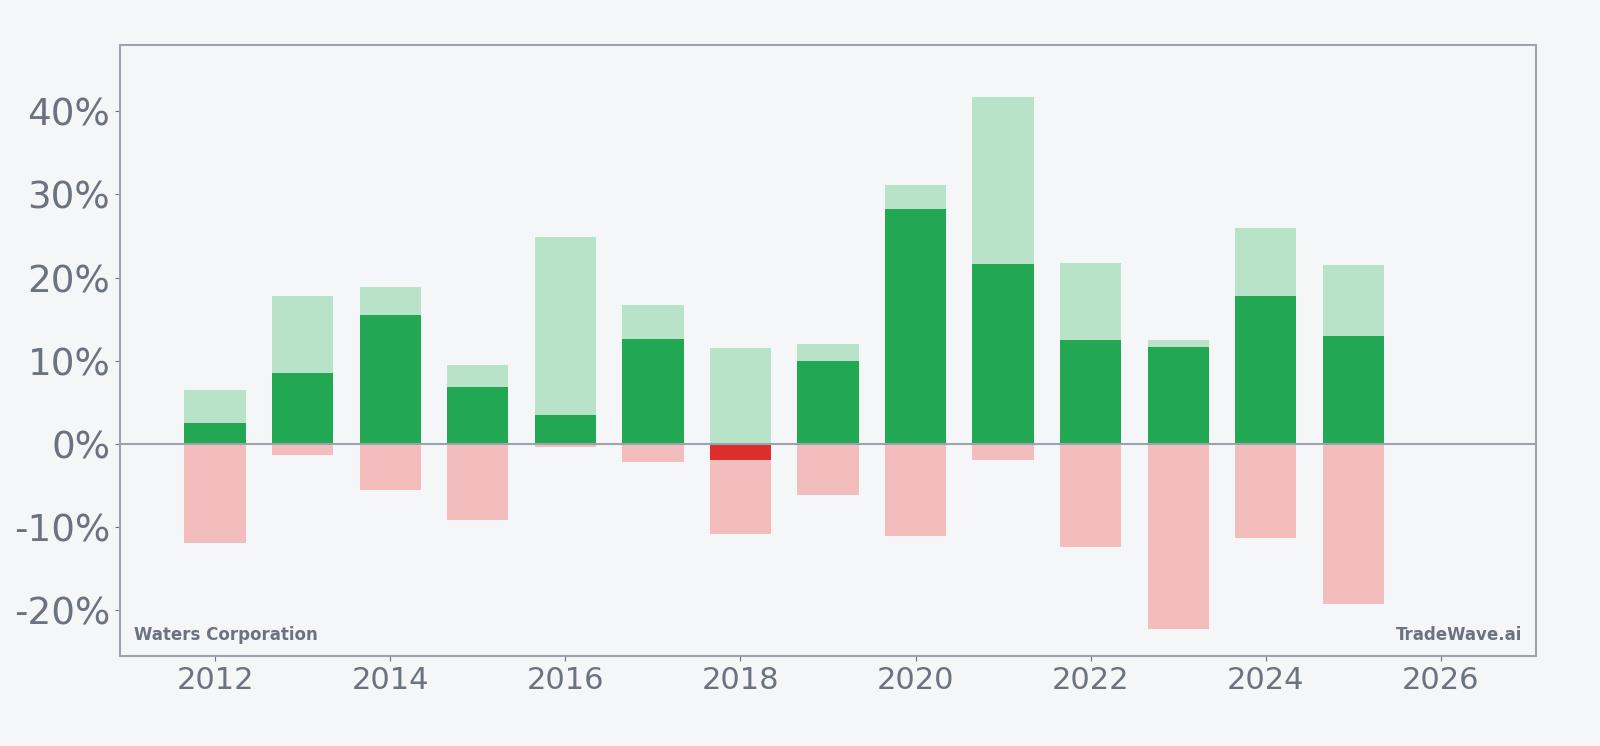
- Intraperiod swings have been meaningful, with some years experiencing double-digit drawdowns even as the window ultimately finished higher.
According to historical data from TradeWave.ai, this long Waters Corporation trading window has behaved very differently from an average calendar stretch, with a clear directional tilt that many investors may not have on their radar.
How has Waters Corporation (WAT) traded in this long seasonal window?
Waters Corporation has climbed in 13 of the past 14 years during the 244-day window that starts on Apr 29, posting an average gain of 12.61% in winning years. Today the stock closed at $320, up 0.7% on the session and sitting about 22.8% below its 52-week high of $414.15, leaving room on the chart if the historical pattern repeats.
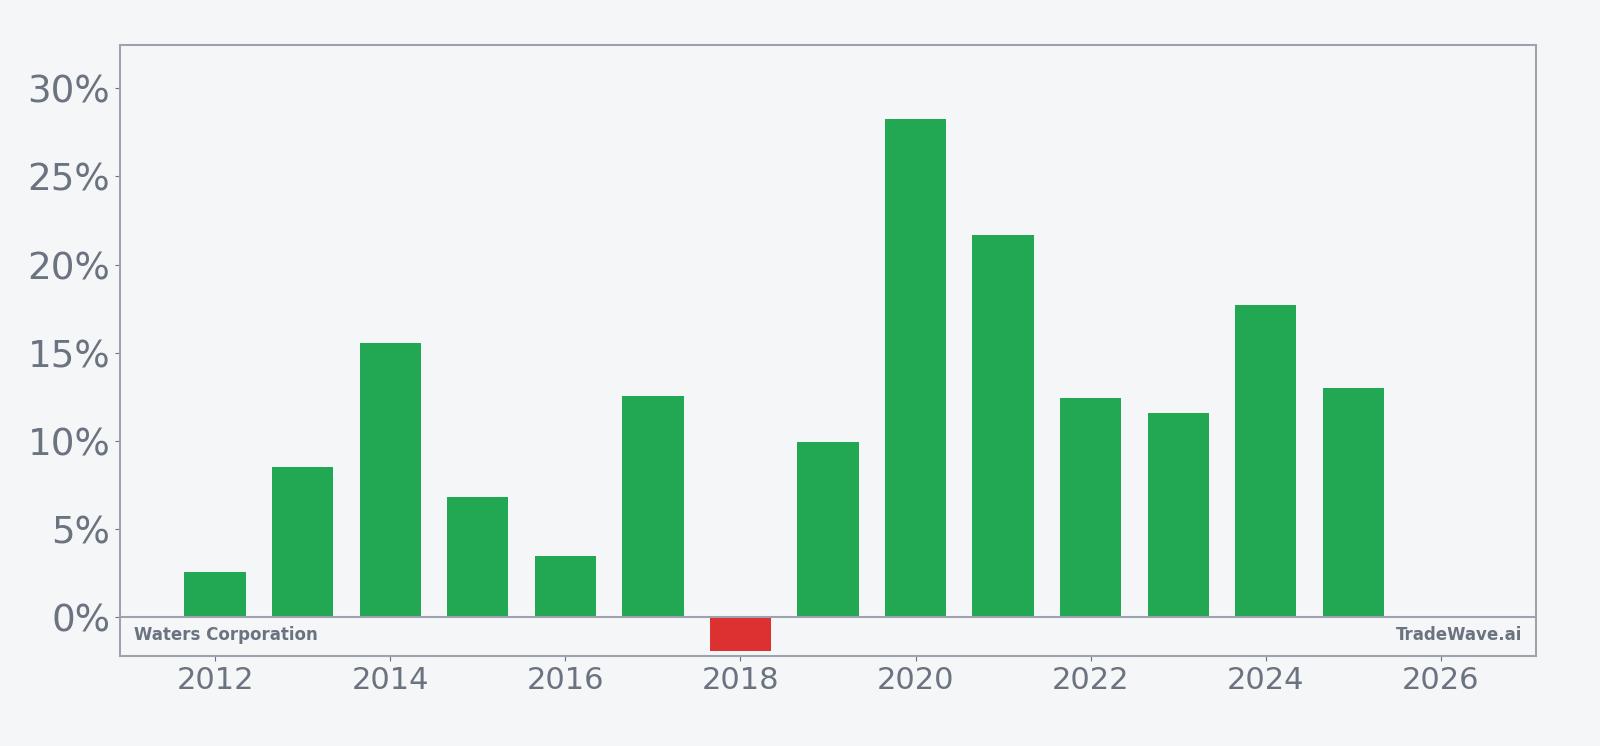
For this long window the trade direction is explicitly long, and the historical record backs that up. Across 14 years, 13 finished higher and only 2018 closed with a loss, at just 1.94% down from entry. The all-years average of 12% shows that even after including that weak year, the WAT seasonal trend in this stretch has been firmly positive.
The strongest outcome in the sample came in 2020, when Waters gained 28.23% between the late-April entry and the end of the 244-day window, with a maximum favorable move of 31.15% at the peak. By contrast, 2016 delivered a more modest 3.46% net gain despite a 24.87% intraperiod run-up, a reminder that rallies inside the window do not always stick through the close.
Intraperiod swings have been meaningful. In 2023, for example, the stock finished the window up 11.59% but endured a maximum adverse move of 22.24% from the entry point before recovering. Several other years, including 2020, 2022, 2024 and 2025, saw double-digit worst drawdowns even as the final result was solidly positive, which fits a profile of a bullish but volatile lab-equipment seasonal outlook.
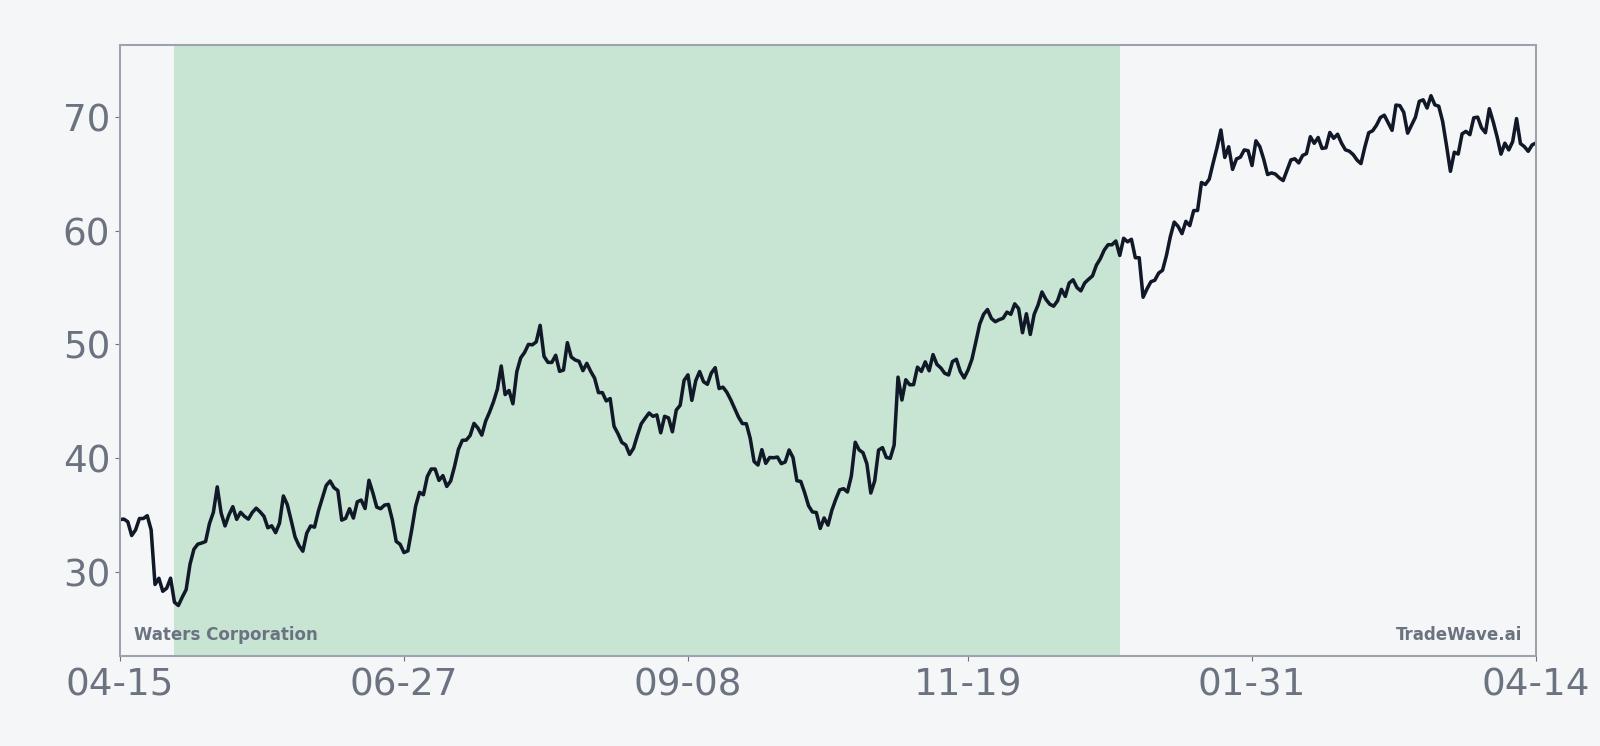
The historical seasonal average, captured in the trend chart, shows gains that tend to build over the life of the window rather than spiking in a single short burst. Early segments of the window often see choppy action, with the bulk of the net advance accruing as the year progresses and investors digest earnings cycles and capital spending plans in biopharma and diagnostics.
Year-by-year bars with peak rallies and worst drawdowns show how often upside has outweighed intraperiod stress.
Across the sample, the combination of a 93% win rate, double-digit average gains and repeated double-digit intraperiod swings makes this one of the more striking long seasonal windows in the healthcare tools space. History does not guarantee a repeat, but the consistency of positive closes across 13 of 14 years is hard to ignore.
Why does Waters Corporation (WAT) follow this seasonal pattern?
One likely driver is the clustering of Waters’ earnings reports and guidance updates across this span, which can reset expectations for biopharma and diagnostics spending. Analysts have also pointed to institutional portfolio repositioning around fiscal year-ends, when healthcare and life-science tools often see flows tied to long-term R&D budgets. The pattern may also reflect sector rotation into more defensive growth names as macro uncertainty ebbs and flows through the back half of the year.
History does not guarantee future results, and even in winning years the worst intraperiod drawdowns have been large enough to test conviction.
What is driving Waters Corporation (WAT) today?
Waters Corporation ended the latest session at $320, up 0.7% on the day, with roughly 848,000 shares changing hands against a 20-day average volume of about 835,000. The stock trades about 22.8% below its 52-week high of $414.15 and roughly 16.3% above its 52-week low of $275.05, while sitting almost exactly on its 50-day moving average near $319.39, a neutral technical posture that leaves the upcoming seasonal window as a potential catalyst either way.
Fundamentally, the most recent detailed update came in August 2025, when Waters raised the lower end of its 2025 profit forecast after stronger-than-expected demand for lab equipment from biotech clients and delivered better-than-anticipated second-quarter results.[1] In July 2025 the company also agreed to buy a Becton Dickinson unit in a $17.5 billion deal aimed at expanding its footprint in clinical and diagnostic applications, a move that was framed as potentially doubling its addressable market and helping offset tariff pressures.[2] Those developments are older and reflect a prior phase of the story, but they underline how much of the Waters investment case is tied to biopharma capital spending and diagnostic testing volumes.
Sector-wise, Waters sits squarely in the life-science tools and lab-equipment group, where demand from biopharma clients for drug-development and research tools has been a key theme.[1] That backdrop can amplify the WAT seasonal trend when funding cycles and R&D pipelines line up with the historical window, especially if large customers accelerate orders into year-end or early-year budget periods.
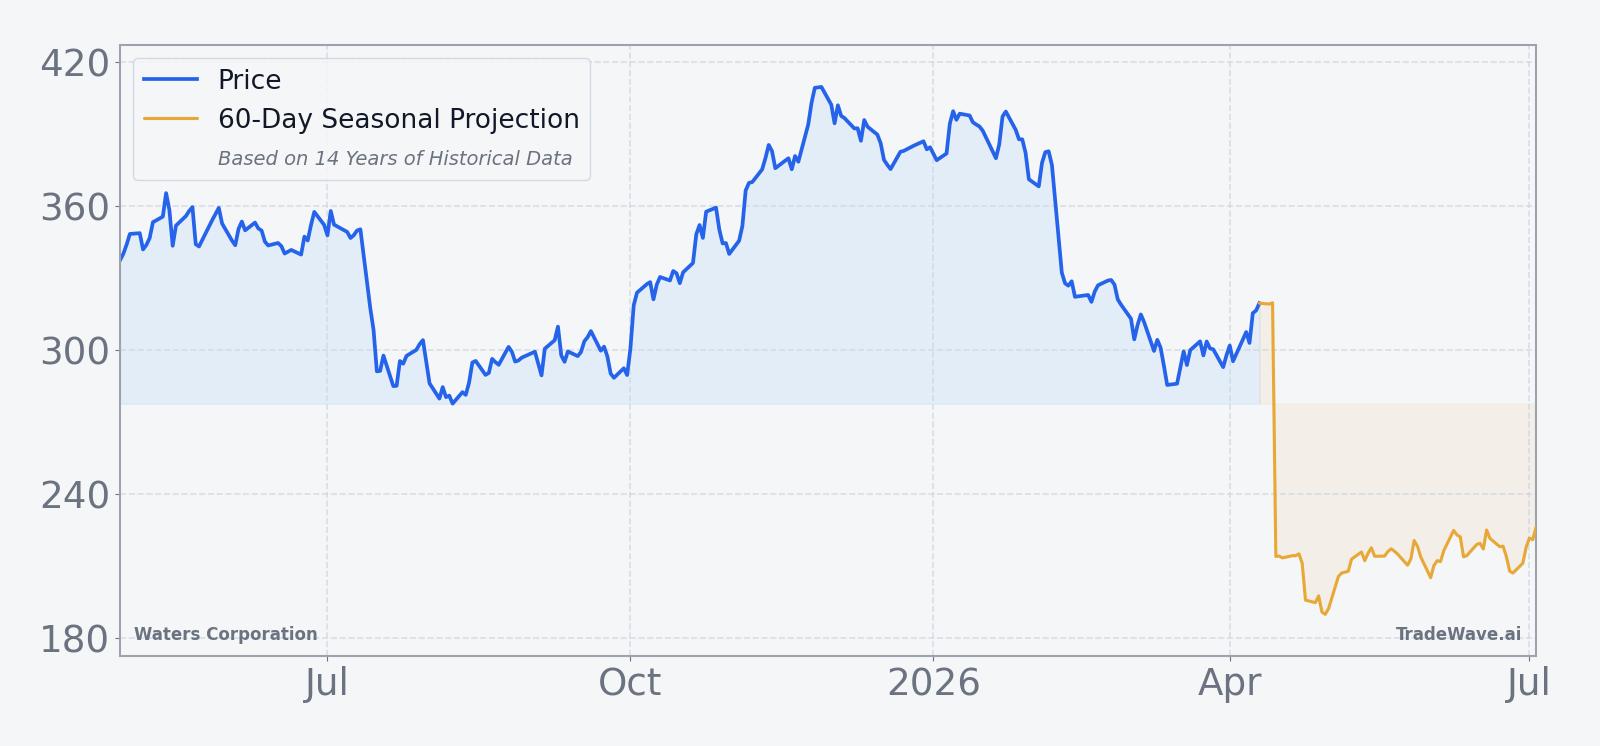
The chart below situates the latest move in its recent multi-month context and overlays a short-term seasonal projection.
What should traders watch as this Waters Corporation seasonal window approaches?
First, the calendar. The 244-day WAT seasonal window kicks off on Apr 29, so price action in the next two weeks will set the entry level against which any historical pattern is measured. A break above the 50-day moving average with rising volume would signal that buyers are leaning in ahead of the window, while a drift back toward the mid-$280s to low-$290s would leave more upside room if the typical pattern reasserts itself.
Second, earnings and guidance. While the next earnings date is not yet specified, the company’s last detailed outlook called for annual adjusted profit per share of $12.95 to $13.05 and third-quarter adjusted EPS of $3.15 to $3.25, tied closely to lab-equipment demand from biotech clients.[1] Any update that confirms sustained biopharma spending or faster integration of the Becton unit could reinforce the bullish historical seasonality, whereas softer guidance would test how much of the 13-for-14 record is already priced in.
Third, sector flows and macro tone. The biotech and diagnostics spending backdrop that supported Waters’ 2025 forecast upgrade remains the key swing factor for the stock’s fundamental story.[1] If risk appetite rotates back toward healthcare tools as investors look for durable growth, that could align with the historical WAT seasonal trend; if capital shifts toward other sectors, the window could still deliver volatility without the same upside follow-through.
Finally, intraperiod behavior. The historical record shows that even winning years often included double-digit drawdowns before finishing higher, so traders may want to watch how WAT reacts to any pullbacks once the window opens. A pattern of shallow, bought dips would rhyme with the stronger years in the sample, while deep, persistent selloffs that fail to recover would mark a clear break from the 13-of-14 track record and signal that this cycle is writing its own script.
Sources
About this seasonal analysis
Seasonal pattern data is sourced from TradeWave.ai, which analyzes historical price behavior across annual calendar windows going back up to 30 years. Read the full data methodology or the book The 100-Year Pattern by Afshin Moshrefi (2026 edition). Past performance of seasonal patterns does not guarantee future results. This article is for informational purposes only and does not constitute investment advice.