Tractor Supply (TSCO) Has Rallied in 6 of 7 Midterm Windows, Averaging 42.48% Gains
Tractor Supply is heading toward a historically strong midterm-election-year seasonal window even as the stock trades just above its 52-week low, setting up a rare tension between price weakness and long-cycle strength.

What is the seasonal pattern for Tractor Supply (TSCO)?
Tractor Supply has risen in 6 of 7 midterm-election-year windows since 1998 during this 359-day stretch starting Apr 29, with an average gain of 42.48% in winning years.
- 6 wins and 1 loss in this window since 1998, with winning years averaging 42.48% gains.
- The upcoming seasonal window begins on Apr 29, 2026 and runs for 359 trading days across the last 7 midterm election years.
- Percent Profitable is 86%, with 6 winners and 1 loser across the historical sample.
- Including every year, Avg Profit - All is still a strong 35%, compared with an Avg Loss of -11.17% in the lone down year.
- The pattern is designed for a long trade direction, with a TradeWave Ratio of 1.31 and a Sharpe ratio of 1.07, pointing to historically favorable risk-adjusted returns.
- Drawdowns have still been meaningful in some years, with adverse moves exceeding -30% even in a generally bullish seasonal trend.
According to historical data from TradeWave.ai, this midterm-election-year stretch for Tractor Supply has behaved very differently from an average calendar year, and the next iteration is about to open.
How has Tractor Supply (TSCO) traded in past midterm-year windows?
Tractor Supply has risen in 6 of the last 7 midterm-election-year windows that start around Apr 29 and run for 359 trading days, with winning years averaging 42.48% gains. Shares finished Monday at $45.41, up 1.2% on the day and sitting about 27.9% below their 52-week high and roughly 2.2% above the 52-week low.[1]
Grouping the data by the presidential election cycle matters here because this pattern only looks at midterm election years, which often feature shifting fiscal priorities, regulatory noise and uneven risk appetite as Washington resets after the first half of a presidential term. For a domestically focused retailer like Tractor Supply, that backdrop can influence everything from consumer confidence in rural markets to expectations for infrastructure and agricultural spending.
This seasonal window begins on Apr 29, 2026 and spans 359 trading days, covering the last 7 midterm election years back to 1998. The trade direction is long, and the historical profile is clearly bullish: Percent Profitable is 86%, with 6 winners and just 1 loser in the sample. Avg Profit in winning years is 42.48%, while Avg Profit - All, which includes the losing year, still comes in at 35%, showing that the single down year has not erased the strength of the pattern.
The lone losing instance came in 2006, when the stock finished the window down 11.17% despite a modest 3.49% maximum favorable move at one point. By contrast, the strongest year in the sample was 2010, when Tractor Supply gained 75.39% across the window after a maximum favorable excursion of 88.0% from the entry level. Other strong midterm years such as 2002 and 2018 delivered net returns of 52.4% and 51.62% respectively, underscoring how powerful this specific Tractor Supply trading window has been in prior cycles.
Intraperiod swings have been large in both directions. Maximum favorable excursions have ranged from 18.02% in 1998 to 88.0% in 2010, while maximum adverse excursions have stretched as deep as -38.49% in 2006 and -31.71% in 1998. In plain English, even the good years often included double-digit drawdowns before the stock finished higher, which is consistent with a high-beta retail name trading through a full midterm-year policy and earnings cycle.
The TradeWave Ratio for this pattern is 1.31, which means the stock has typically traveled meaningfully in the trade direction within the window, independent of where it closed. The Sharpe ratio of 1.07, based on end-of-window outcomes, points to historically attractive risk-adjusted returns for a long bias in this specific seasonal regime compared with a flat calendar allocation.
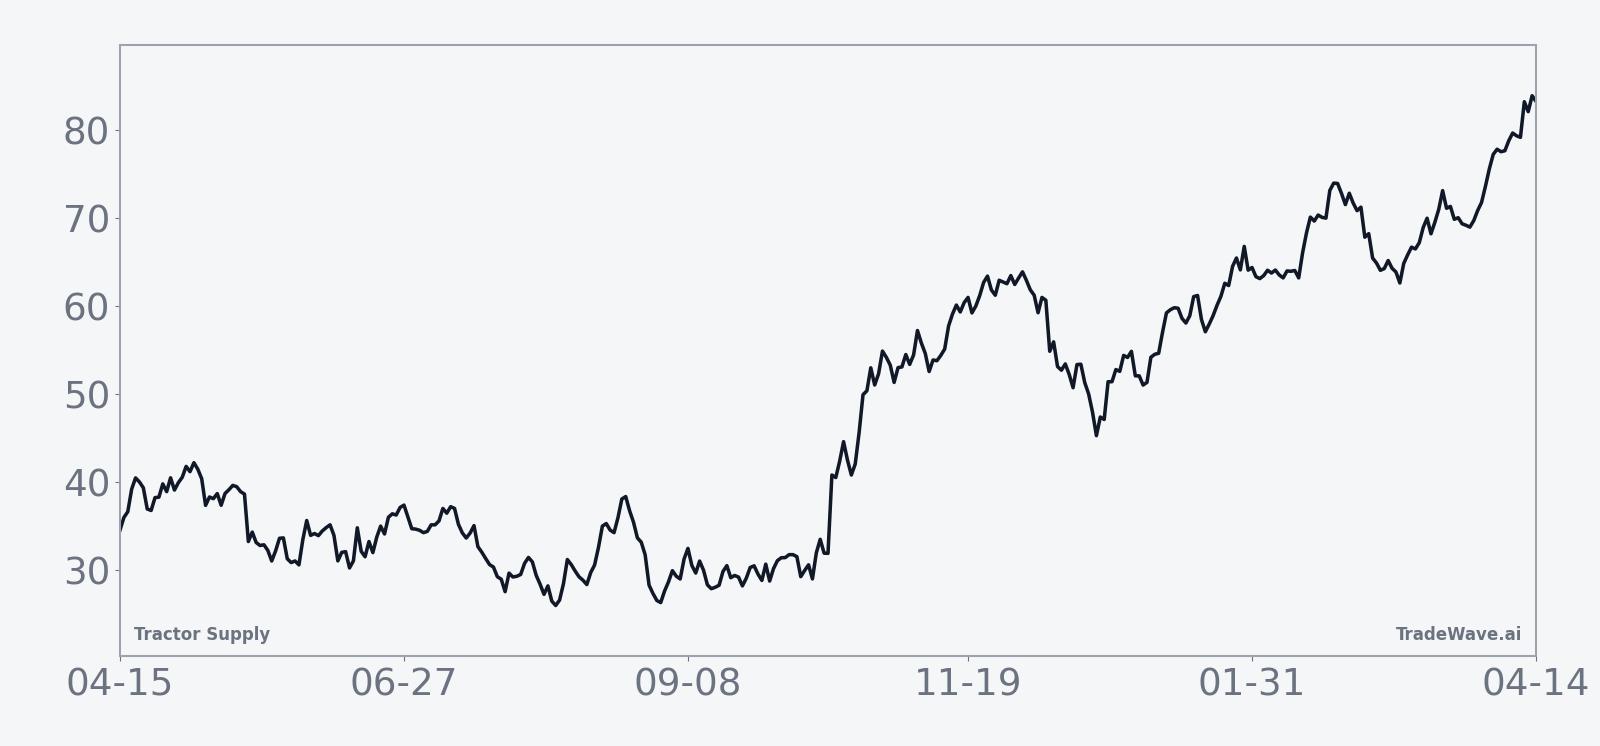
Looking at the historical seasonal trend chart, the average path across these seven midterm years shows gains that tend to build over the life of the window rather than spiking in a single month. The curve is not perfectly smooth, but the typical pattern shows early choppiness followed by a more persistent climb as the window progresses into the following pre-election year, which has often been a friendlier environment for U.S. equities.
The per-year bars with maximum favorable and adverse moves show how often big rallies have come with sizable drawdowns along the way.
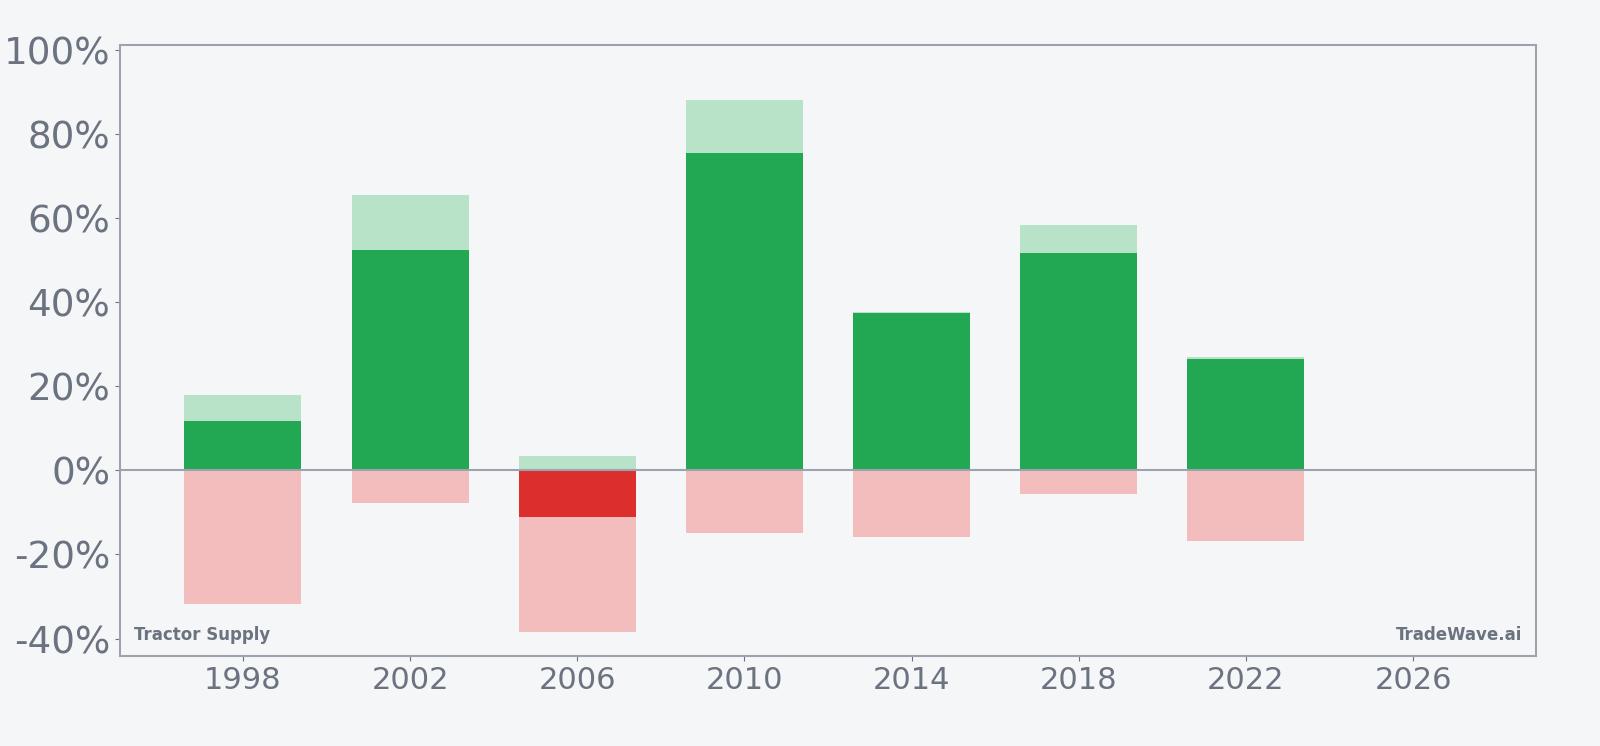
History does not guarantee future results; adverse excursions (MAE) can be large even in winning windows.
Why does Tractor Supply (TSCO) follow this seasonal pattern?
One likely driver is the way Tractor Supply’s earnings calendar and capital spending plans line up with the midterm and pre-election policy cycle, which can influence rural consumer demand and farm-related purchases. Analysts have also pointed to sector rotation into domestic, economically sensitive retailers as investors position for potential fiscal support and infrastructure spending in the back half of a presidential term. The pattern may also reflect portfolio rebalancing as institutions adjust exposure to U.S. small and mid-cap retail names when political uncertainty typically fades heading into the pre-election year.
What is driving Tractor Supply (TSCO) today?
Tractor Supply closed Monday at $45.41, up 1.2% on the session, after trading between $45.13 and $45.85 on volume of about 4.6 million shares, versus a 20-day average of roughly 5.6 million.[1] The stock is trading well below its 50-day moving average of $51.10 and sits about 27.9% under its 52-week high of $62.96 while hovering only about 2.2% above its 52-week low of $44.44, leaving the rural retail name in a technically weak spot heading into April.[1]
In August 2025, Tractor Supply outlined plans to beef up last-mile delivery for bulky goods to rural customers, targeting an increase in digital sales from 8% of revenue to 10% to 12% by 2029, a move aimed at boosting customer satisfaction and repeat orders.[2] That strategy underscores how much of the company’s growth story is tied to execution in e-commerce and logistics rather than just store openings, and it will remain a key backdrop as investors weigh the upcoming seasonal window against fundamentals.
The chart below situates the latest move in its recent multi-month context and overlays a short-term seasonal projection.
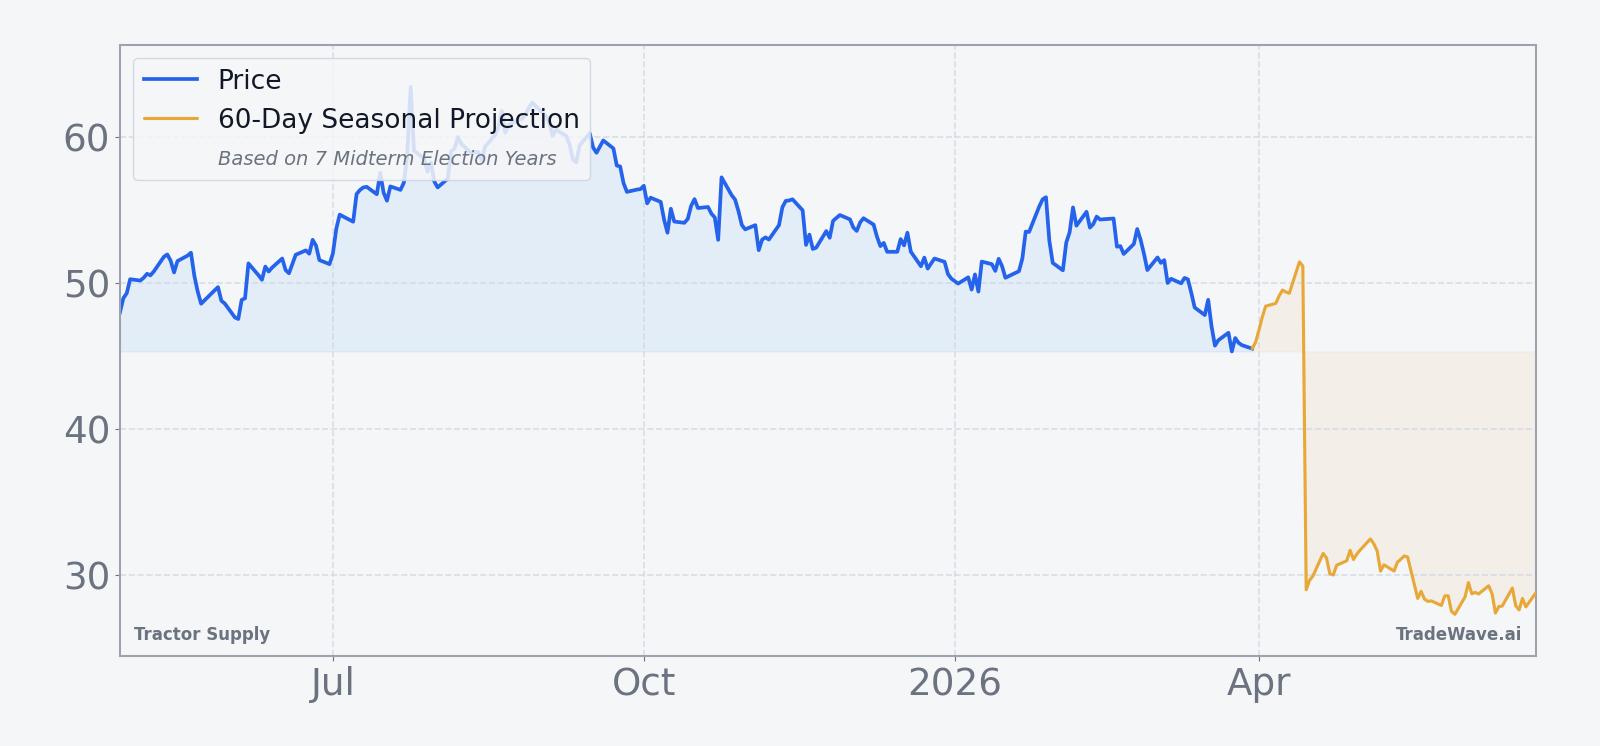
What should traders watch in this Tractor Supply (TSCO) seasonal window?
The first marker is timing. The new midterm-election-year seasonal window opens on Apr 29, so traders will be watching how TSCO behaves in the weeks just before and after that date. A sustained move off the recent 52-week low while the stock is still below its 50-day moving average would be more consistent with the historical pattern than a fresh breakdown to new lows.
Second, price levels matter. On the downside, the 52-week low near $44.44 is the immediate line in the sand, while on the upside, the 50-day moving average around $51.10 and then the low-$60s 52-week high zone are the key resistance bands that would test whether this midterm-year seasonal trend can reassert itself.[1] How TSCO trades around those levels as the window progresses will tell investors whether this cycle is tracking closer to the strong years like 2010 and 2018 or the outlier 2006 drawdown.
Finally, keep an eye on fundamental catalysts that intersect with the calendar. Any updates on Tractor Supply’s last-mile delivery buildout, digital sales penetration or rural demand trends will shape how much investors are willing to lean into a historically bullish seasonal regime.[2] If the stock can pair improving execution with the tailwind of a midterm-to-pre-election seasonal pattern that has delivered 6 wins out of 7, the historical template suggests the next year could look very different from the weak tape traders see today.
Sources
- [1] EODHD, “TSCO US equity quote and 52-week statistics,” data as of Mar 31, 2026.
- [2] The Wall Street Journal, “Tractor Supply Beefs Up Last-Mile Delivery to Grow Sales,” Aug 4, 2025.
About this seasonal analysis
Seasonal pattern data is sourced from TradeWave.ai, which analyzes historical price behavior across annual calendar windows going back up to 30 years. Read the full data methodology or the book The 100-Year Pattern by Afshin Moshrefi (2026 edition). Past performance of seasonal patterns does not guarantee future results. This article is for informational purposes only and does not constitute investment advice.