Analyst ‘Moderate Buy’ Meets a 7-for-7 Midterm Slide Record for CNH Industrial (CNH)
CNH Industrial is heading toward an 80-day midterm-election-year seasonal window that has been consistently bearish, even as the stock trades well below its 52-week high.

What is the seasonal pattern for CNH Industrial (CNH)?
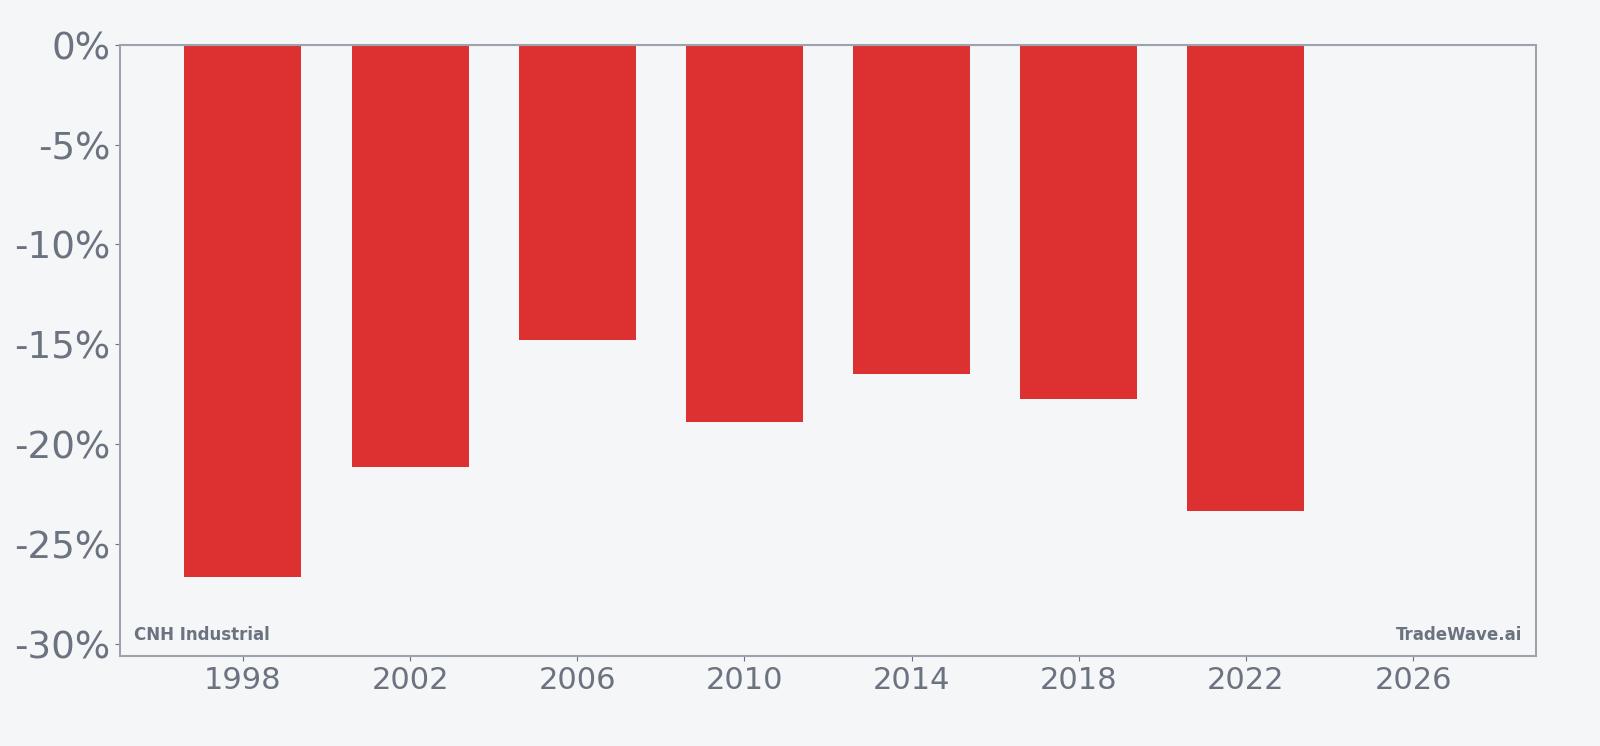
CNH Industrial has fallen in 7 of 7 midterm-election-year windows starting around Apr 23, with an average 19.87% gain for short positions in winning years.
- 7 for 7 in this window for short trades, with an average 19.87% profit in winning years across the last seven midterm election cycles.
- The upcoming seasonal window begins Apr 23 and runs for 80 trading days, historically a bearish stretch for CNH Industrial’s share price.
- Percent Profitable is 100%, with 7 winners and 0 losers for the short-side pattern in this midterm-year slice.
- Average winner gains of about 19% for shorts come alongside sizable intraperiod swings, with both strong favorable moves and deep drawdowns recorded.
- The TradeWave Ratio of 4.28 signals that price has typically traveled meaningfully in the trade direction within the window, independent of the final close.
- A Sharpe ratio of 4.61 on end-of-window outcomes points to unusually consistent risk-adjusted returns for this specific CNH Industrial trading window.
According to historical data from TradeWave.ai, this midterm-election-year stretch has behaved very differently from an average spring for CNH Industrial, and the next iteration is only weeks away.
How has CNH Industrial (CNH) traded in this midterm-year window?
CNH Industrial has declined in every one of the last seven midterm-election-year windows starting around Apr 23, with short trades averaging a 19.87% profit over 80 trading days. Shares finished Monday at $10.72, leaving the stock about 24.9% below its 52-week high of $14.27 and roughly 19.1% above the 52-week low of $9.00. That combination of a beaten-up price and a historically bearish spring-to-summer pattern gives this upcoming CNH seasonal trend unusual weight for traders focused on the agriculture and construction equipment sector.
The pattern is built on the last seven midterm election years, a phase of the presidential cycle that often brings policy uncertainty, shifting farm subsidies and infrastructure priorities, and choppy risk appetite. Grouping CNH Industrial’s behavior by this election phase rather than by simple calendar years surfaces a cleaner stock pattern analysis for a company tied closely to government spending and agricultural credit conditions.
A second view combines net results with the best and worst intraperiod swings to show how far CNH has tended to move inside the window.
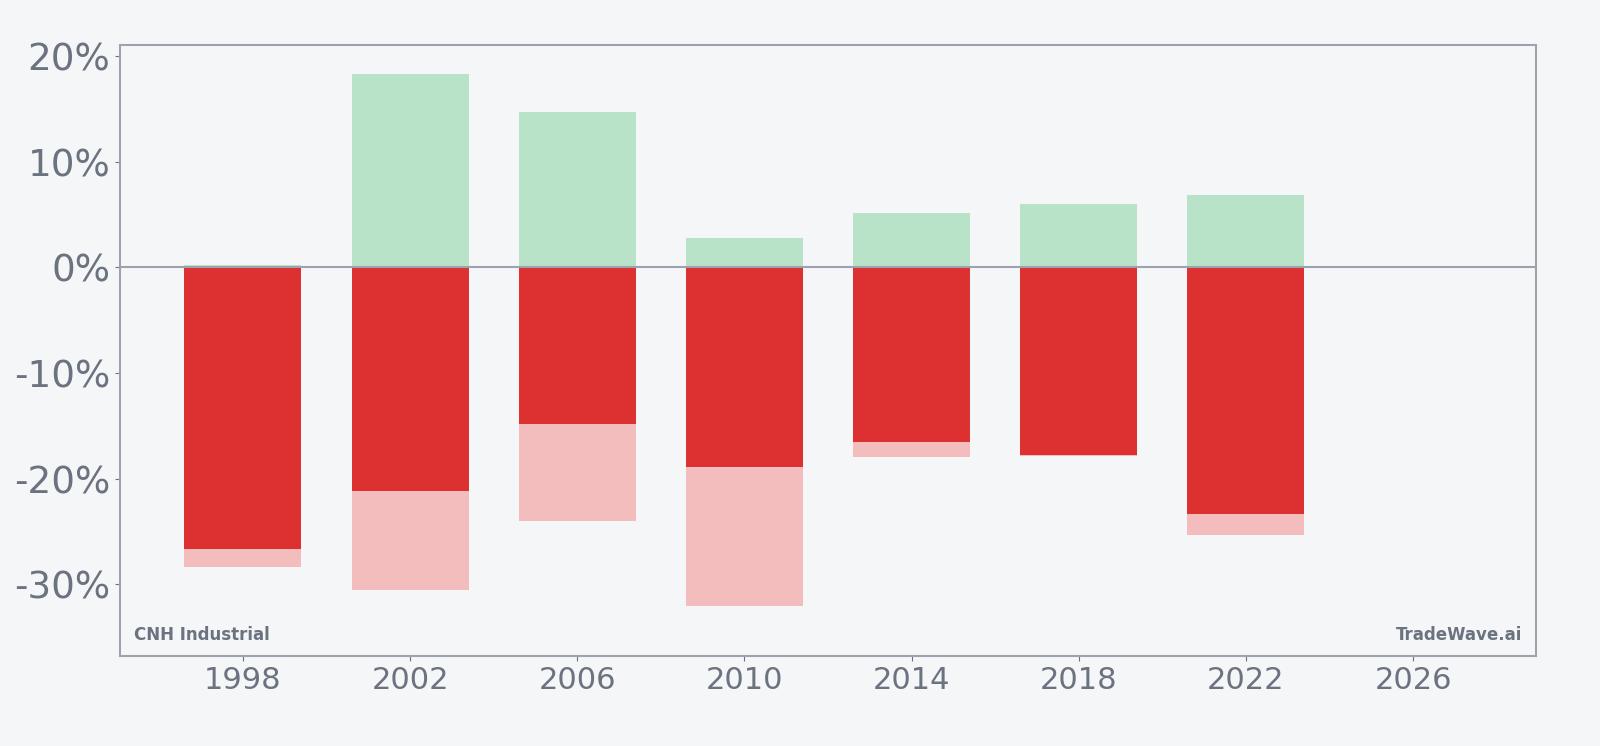
Across individual years, the strongest short-side outcome came in 1998, when CNH fell 26.65% from entry to exit while the worst intraperiod drawdown against the short, the maximum adverse excursion, reached 28.36% before the trade finished in the green. At the other end of the spectrum, 2006 delivered a smaller but still meaningful 14.81% net decline in the share price, with a maximum favorable move of 14.69% and a maximum adverse move of 23.99%. The mix of large favorable and large adverse excursions shows that this CNH Industrial trading window has historically been both directional and volatile, rewarding shorts that could sit through swings.
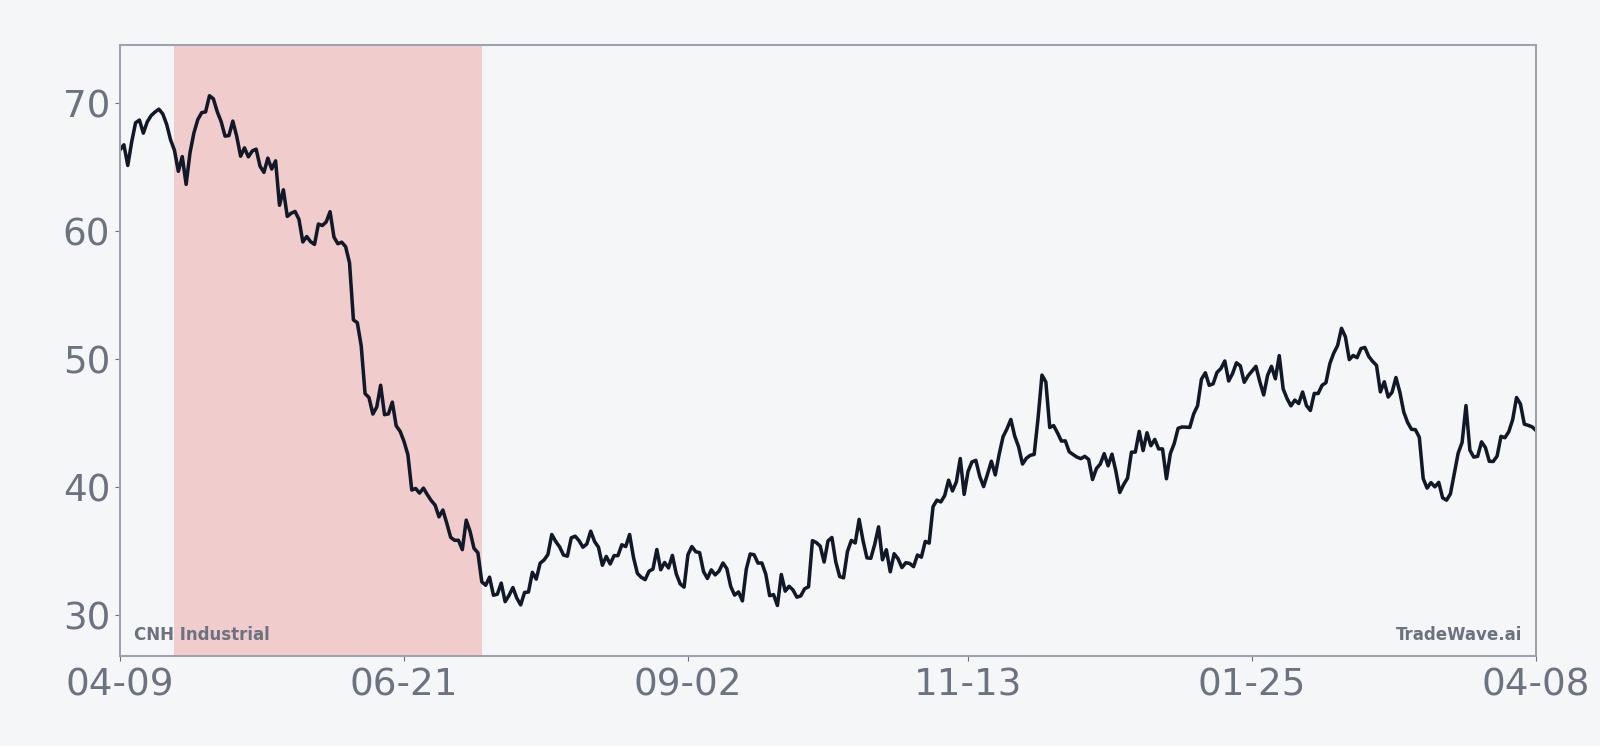
On average, the seasonal trend chart slopes lower fairly steadily across the 80 days, with no single cliff-edge moment. That suggests the typical pattern is a grind lower rather than a sudden collapse, even though individual years like 2002 and 2022 saw deep intraperiod drops of more than 25% from the entry point. The cumulative return profile, which sums these midterm-year windows over time, climbs in a near-straight line for short positions, reaching a 254% cumulative gain across the seven-sample history.
History does not guarantee future results, and the worst intraperiod drawdowns have been large even in years that ultimately finished as winners for the short-side pattern.
Why does CNH Industrial (CNH) follow this seasonal pattern?
One likely driver is the way midterm election years cluster key policy debates around farm subsidies, infrastructure spending and environmental regulation, all of which matter for heavy equipment demand. Analysts have also pointed to institutional portfolio repositioning in the spring and early summer, when investors reassess cyclical exposure to machinery names against updated crop-price and construction data. This CNH seasonal pattern may reflect that combination of policy uncertainty and sector rotation, which has repeatedly lined up with weaker share prices in this specific midterm-year window.
What is driving CNH Industrial (CNH) today?
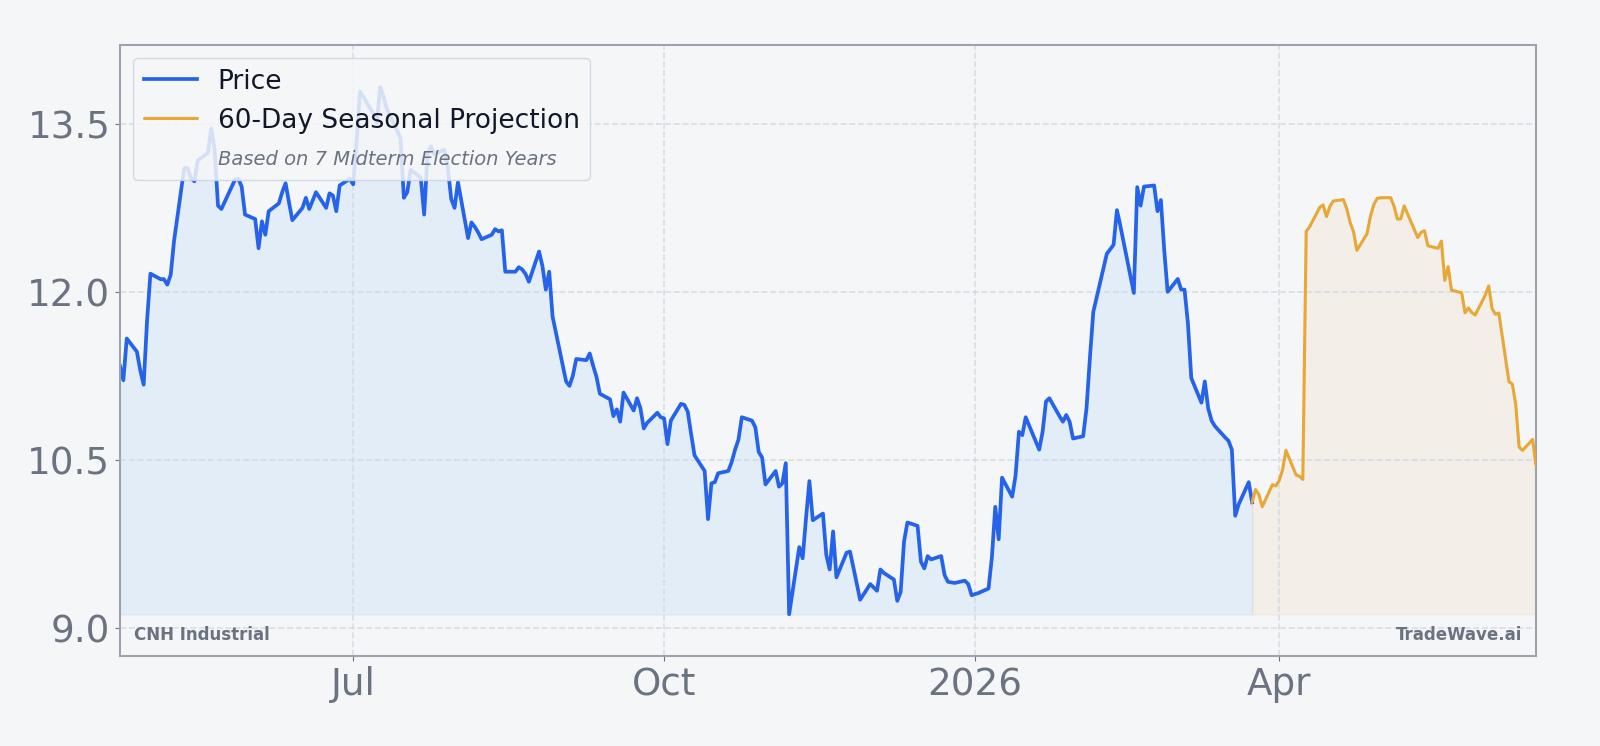
CNH Industrial closed Monday at $10.72, down 2.19% on the day, extending a one-month slide of 15.76% and leaving the stock about 24.9% below its 52-week high of $14.27 and 19.1% above its 52-week low of $9.00. Trading volume of 26.1 million shares was well above the 20-day average of about 13.8 million, and the stock now sits below its 50-day moving average of $11.45, underscoring how sentiment has cooled ahead of the next leg of the presidential election cycle.
On Feb 17, CNH Industrial reported quarterly earnings of $0.19 per share, beating consensus estimates of $0.11, and issued full-year 2026 guidance of $0.35 to $0.45 EPS while analysts were looking for about $0.70 for the current year.[2] That gap between company guidance and Street expectations has kept a lid on the stock despite the earnings beat, even as the consensus rating sits at “Moderate Buy” with a one-year price target around $14.88 from MarketBeat.com, implying notable upside from current levels.[1] For a name tied to agriculture and construction equipment, the macro backdrop of slower expected 2025 sales and production, flagged in earlier commentary, still hangs over the story even as investors look ahead to how fiscal policy might evolve in the presidential election year.[5]
The chart below shows how that recent weakness fits into CNH Industrial’s past year of trading, alongside a 60-day seasonal projection.
What should traders watch as this CNH Industrial seasonal window approaches?
First, the calendar: the 80-day midterm-year window begins on Apr 23, so any sharp rallies or breakdowns into that date will shape how stretched CNH looks as the historical pattern kicks in. Second, price levels: traders will be watching whether the stock can reclaim the 50-day moving average near $11.45 or instead retest the 52-week low around $9.00, which would change the risk-reward profile for any CNH Industrial trading window tied to this seasonality. Third, macro and policy catalysts: updates on farm income, construction spending and any midterm-year fiscal or regulatory headlines that affect heavy machinery demand could either reinforce or blunt the historical seasonal bias.
Add it up: a stock already under pressure, a midterm-election-year phase that has historically favored shorts in this exact 80-day slice, and a policy calendar that tends to get noisier into the summer. For traders who track historical seasonality, how CNH behaves inside this window will be a real-time test of a pattern that has gone 7 for 7 so far.
Sources
- [1] MarketBeat: CNH Industrial (NYSE:CNH) Sets New 1-Year Low Following Weak Earnings (Nov 8, 2025).
- [2] MarketBeat: CNH Industrial (NYSE:CNH) Releases FY 2026 Earnings Guidance (Feb 17, 2026).
- [3] MarketBeat: CNH Industrial (NYSE:CNH) Insider Sells $153,755.63 in Stock (Sep 23, 2025).
- [4] MarketBeat: Perpetual Ltd Lowers Holdings in CNH Industrial N.V. (CNH) (Sep 24, 2025).
- [5] GuruFocus: CNH Anticipates Lower Sales and Production in 2025 (May 1, 2025).
- [6] Finviz: CNH Industrial (CNH) Tumbles, Nears 52-Week Low (Nov 27, 2025).
- [7] GuruFocus: CNH Expects Lower 2025 Sales Amid Market Slowdown (Aug 1, 2025).
About this seasonal analysis
Seasonal pattern data is sourced from TradeWave.ai, which analyzes historical price behavior across annual calendar windows going back up to 30 years. Read the full data methodology or the book The 100-Year Pattern by Afshin Moshrefi (2026 edition). Past performance of seasonal patterns does not guarantee future results. This article is for informational purposes only and does not constitute investment advice.