Boeing (BA) Faces 7-for-7 Midterm Losing Streak as 52-Day Weak Window Nears
Boeing is heading into a historically weak 52-day midterm-year window just as shares trade below recent highs and investors weigh strong aircraft demand against lingering safety and regulatory risks.

What is the seasonal pattern for Boeing (BA)?
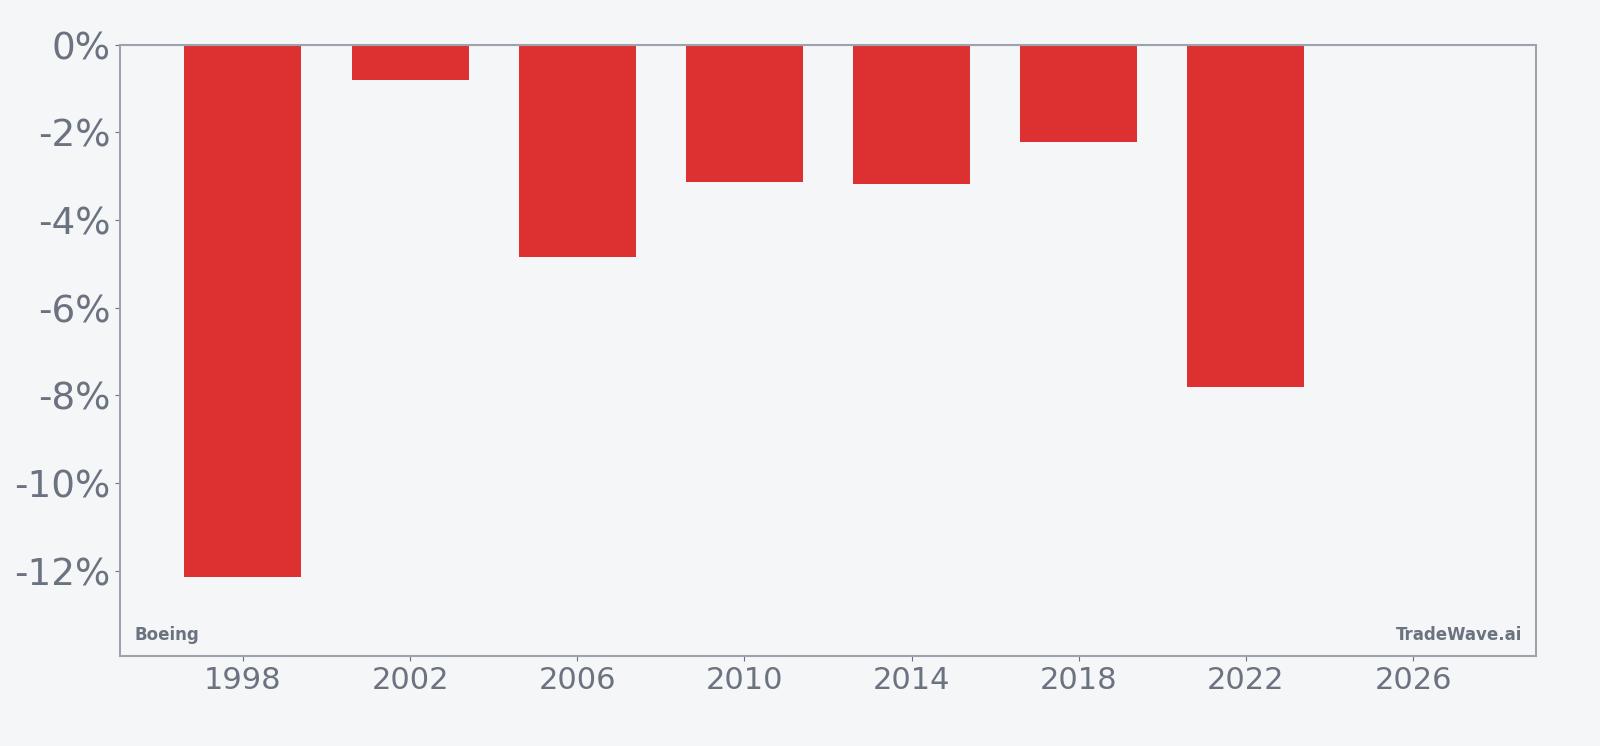
Boeing has fallen in 7 of 7 midterm-year windows starting around May 5, with an average 4.88% gain for short positions in winning years.
- 7 for 7 in this window for shorts, with average winning-year gains of 4.88% on the downside.
- The upcoming 52-day window starts May 5 and has historically been a bearish stretch for Boeing in midterm election years.
- Percent Profitable is 100%, with 7 winners and 0 losers for the short trade direction across the last seven midterm cycles.
- Cumulative return for the pattern is 39%, with an annualized return of 4.82% for the short setup.
- TradeWave Ratio is 1.35, indicating price has typically traveled meaningfully in the short direction within the window before closing.
- Intraperiod drawdowns have at times been deep, with adverse moves exceeding 15% in some years even though the short pattern still finished ahead.
According to historical data from TradeWave.ai, this midterm-year stretch has behaved very differently from an average spring for Boeing, and the next iteration is only weeks away.
How has Boeing (BA) traded in this midterm-year spring window?
Boeing has declined in all seven midterm election years during this 52-day window starting May 5, rewarding short positions every time with an average profit of 4.88%. Shares finished Friday at $218.88, down 2.3% on the day and about 13.9% below the 52-week high of $254.35.[8]
Grouping the data by the presidential election cycle matters here because this pattern only looks at the last seven midterm election years, a phase that often brings policy uncertainty, shifting defense budgets and choppy risk appetite for industrials. In that context, Boeing’s midterm-year seasonal trend stands out as unusually one-sided for a large-cap stock.
A second view that layers in best and worst intraperiod swings shows how far the stock has tended to move before the window closes.
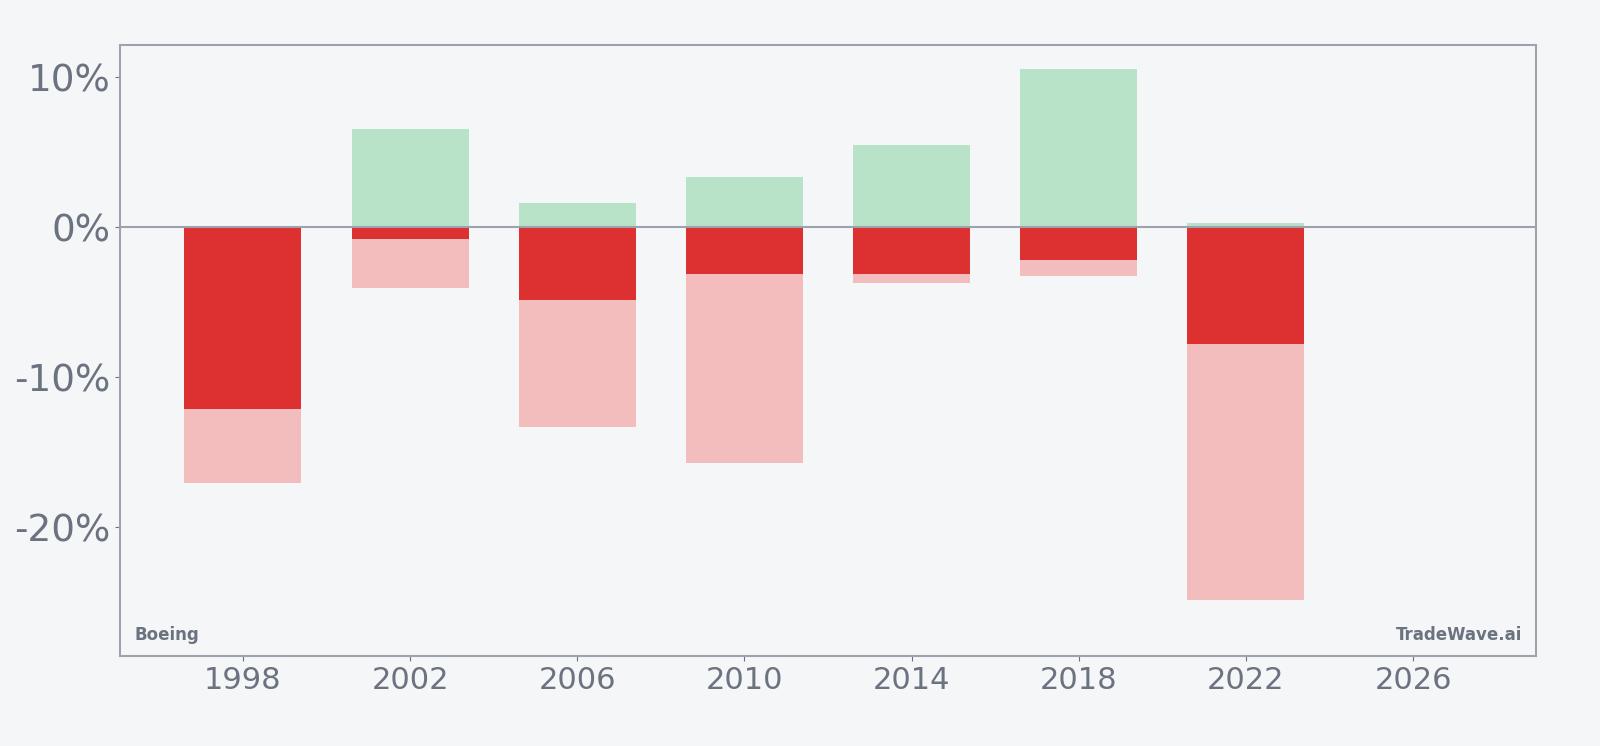
Across the seven midterm-year samples, the strongest short year was 1998, when Boeing fell 12.14% during the window, while the weakest was 2002, when the stock slipped just 0.81%. In several years, including 2006, 2010 and 2022, the worst intraperiod drawdown from the entry exceeded 13%, showing that even successful shorts had to sit through sizable rallies before the trade worked. The maximum favorable moves for the short side were more modest, often in the low- to mid-single digits, which fits a pattern of grinding downside rather than sudden collapses.
The cumulative return line for the pattern climbs steadily over the seven midterm cycles, reflecting a 39% total gain for the short strategy and an annualized return of 4.82%. That consistency, combined with a Sharpe ratio of 1.11, suggests this has been a relatively efficient seasonal window for traders who positioned with the historical bias. The key takeaway is simple: in the last seven midterm election years, this early May to late June stretch has not produced a single losing outcome for shorts in Boeing.
History does not guarantee future results; adverse excursions (MAE) can be large even in winning windows.
Why does Boeing (BA) follow this seasonal pattern?
One likely driver is the way midterm election years cluster policy and budget headlines around defense and aerospace spending in the late spring, which can inject uncertainty into Boeing’s order and margin outlook. Analysts have also pointed to institutional portfolio rebalancing around this time, as funds adjust industrial and aerospace exposure ahead of the summer and the back half of the political cycle. The pattern may also reflect how Boeing’s earnings and delivery updates in prior midterm years have lined up with macro shocks, creating a tendency for investors to de-risk into this specific window.
What is driving Boeing (BA) today?
Boeing slipped 2.3% to $218.88 on Friday, trading in a wide intraday band between $215.40 and $225.10 as volume ran slightly above its 20-day average of about 6.36 million shares.[8] The stock has rallied 6.26% over the past month but remains well below its 52-week high, leaving investors to balance a powerful recovery story against ongoing execution and regulatory risks.[8]
On Apr 1, 2026, analysis of Boeing’s order book and deliveries highlighted that the company has been outperforming Airbus on widebody demand, even as the Iran war shock raised questions about macro headwinds and geopolitical risk for global travel.[8] That backdrop has reinforced the aerospace sector’s constructive demand story, with airlines and lessors still chasing capacity after years of under-ordering, but it also means Boeing’s execution on production and quality controls remains under a microscope.
Earlier commentary in 2025 from Wall Street pointed to improving sentiment as 737 MAX production increased and supply chains slowly stabilized, helping Boeing narrow losses and grow revenue on higher deliveries.[2][6] At the same time, regulators have kept pressure on the company: in June 2025, the NTSB’s scrutiny of a 737 MAX 9 mid-air blowout underscored lingering quality-control concerns that could still influence investor confidence in 2026.[10]
Analyst views have generally leaned constructive on the turnaround. In Dec 2025, Citi reiterated a buy stance with a $265 price target, citing backlog strength, cash flow improvement and production ramp-up as key supports for the stock, while acknowledging sector-wide challenges.[4] In May 2025, UBS also raised its target, arguing that Boeing could navigate tariff risks and benefit from global aerospace demand, a thesis that remains relevant as trade and defense policy evolve into the heart of the U.S. political cycle.[9]
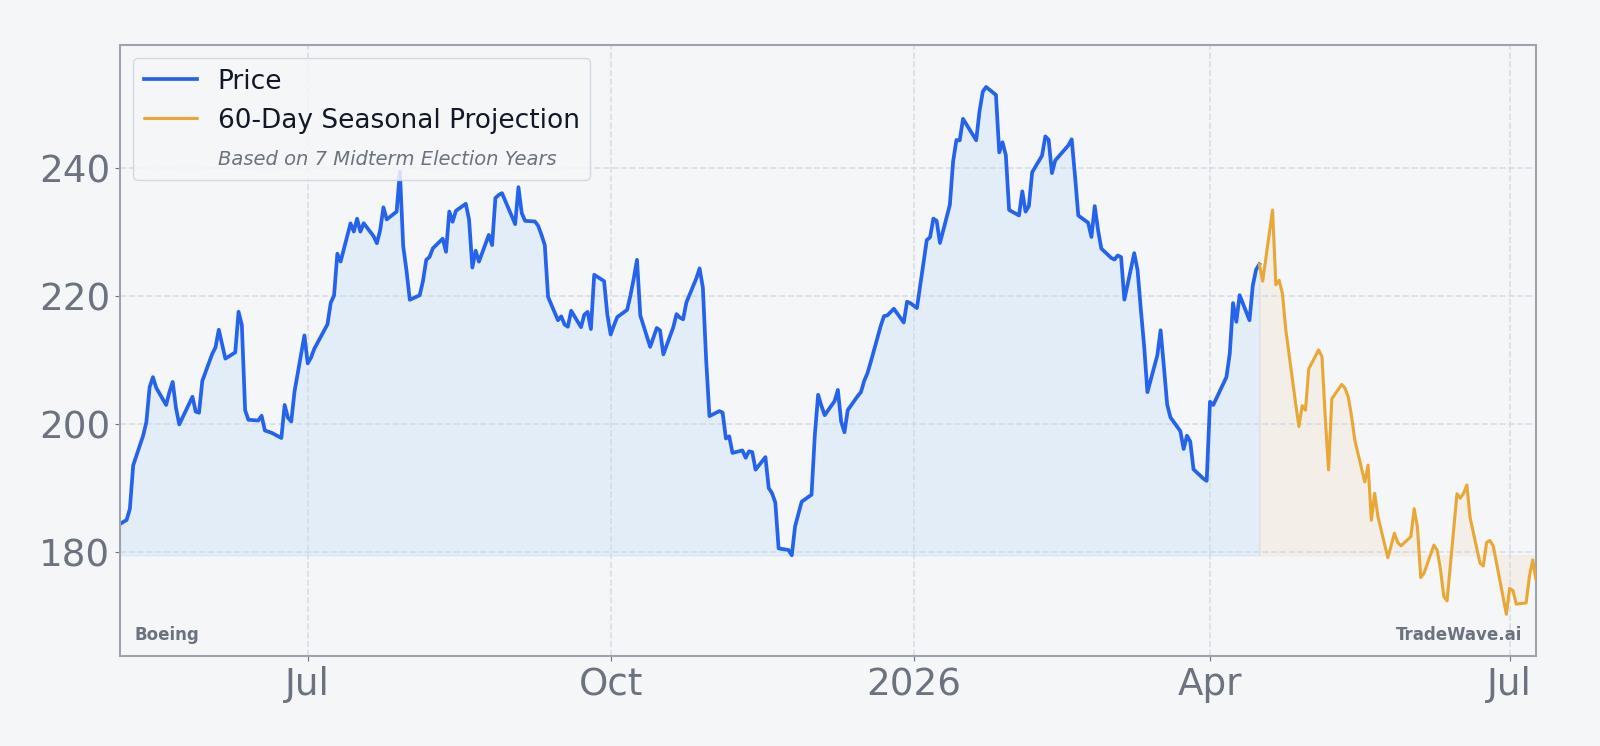
The chart below situates the latest move in its recent multi-month context, alongside a 60-day seasonal projection for the upcoming window.
What should traders watch as this Boeing (BA) window opens?
The first marker is timing. The 52-day midterm-year window begins on May 5, so price action in the final two weeks of April will shape how stretched or compressed Boeing looks as it enters a historically weak stretch. A sharp rally into that date would set up a bigger gap between the current trend and the historical pattern, while a pullback could mean some of the typical downside has already been front-loaded.
Second, watch how macro and policy headlines intersect with the aerospace tape. Any fresh news on defense budgets, export controls, tariffs or geopolitical shocks could amplify the usual midterm-year volatility that has shown up in this Boeing trading window in the past.[8][9] If the stock starts to slide in response to such catalysts and follows the historical path of grinding lower rather than collapsing, that would be consistent with the prior seven cycles.
Third, monitor intraday swings relative to the historical maximum favorable and adverse excursions. In earlier midterm years, shorts often had to sit through rallies of more than 10% before the trade moved back in their favor, so a similar pattern of sharp countertrend spikes would not be unusual in this window. Conversely, a clean, low-volatility drift without big squeezes would mark a departure from the typical MAE profile.
Finally, keep an eye on how Boeing trades around any updates on production, deliveries or regulatory oversight, since those have been key drivers of sentiment in prior cycles.[2][6][10] If the stock shrugs off negative headlines and pushes toward or through the 52-week high during the window, that would be a clear break from the historical seasonality and a sign that the turnaround narrative is overpowering the midterm-year pattern.
Sources
- Yahoo Finance: Boeing Q4 Earnings Preview: What To Expect From Upcoming Report (Jan 26, 2026)
- Seeking Alpha: Boeing tops expectations, stock seeks direction on higher deliveries and revenue beat (Jul 29, 2025)
- Barron's: Boeing Earnings Trounced Expectations. Why the Stock Is Dropping. (Jan 26, 2026)
- CNBC: Citi says Boeing is a buy as the new year approaches. Here's why (Dec 12, 2025)
- CNBC: Boeing is set to report earnings before the bell. Here's what Wall Street expects (Oct 29, 2025)
- CNBC: Wall Street sentiment on Boeing is improving as 737 MAX production increases (Jun 5, 2025)
- The Wall Street Journal: Boeing’s Stepped-Up Plane Deliveries Lift Sales (Jan 27, 2026)
- Seeking Alpha: Boeing Vs. Airbus: The Iran War Shock And The Production Reality (Apr 1, 2026)
- CNBC: Boeing gets a price target hike from UBS, which says the airplane maker can navigate tariff risk (May 9, 2025)
- Yahoo Finance: This Should've Been Caught Years Ago: Boeing Faces NTSB Heat Over 737 MAX 9 Alaska Airlines Mid-Air Blowout Incident (Jun 24, 2025)
About this seasonal analysis
Seasonal pattern data is sourced from TradeWave.ai, which analyzes historical price behavior across annual calendar windows going back up to 30 years. Read the full data methodology or the book The 100-Year Pattern by Afshin Moshrefi (2026 edition). Past performance of seasonal patterns does not guarantee future results. This article is for informational purposes only and does not constitute investment advice.