Amazon (AMZN) Has Rallied in 6 of 6 Midterm Windows Starting May 11, Averaging 28.68% Gains
Amazon is trading just below its 52-week high as it approaches a midterm-election-year seasonal window that has never produced a losing year in this sample.

What is the seasonal pattern for Amazon (AMZN)?
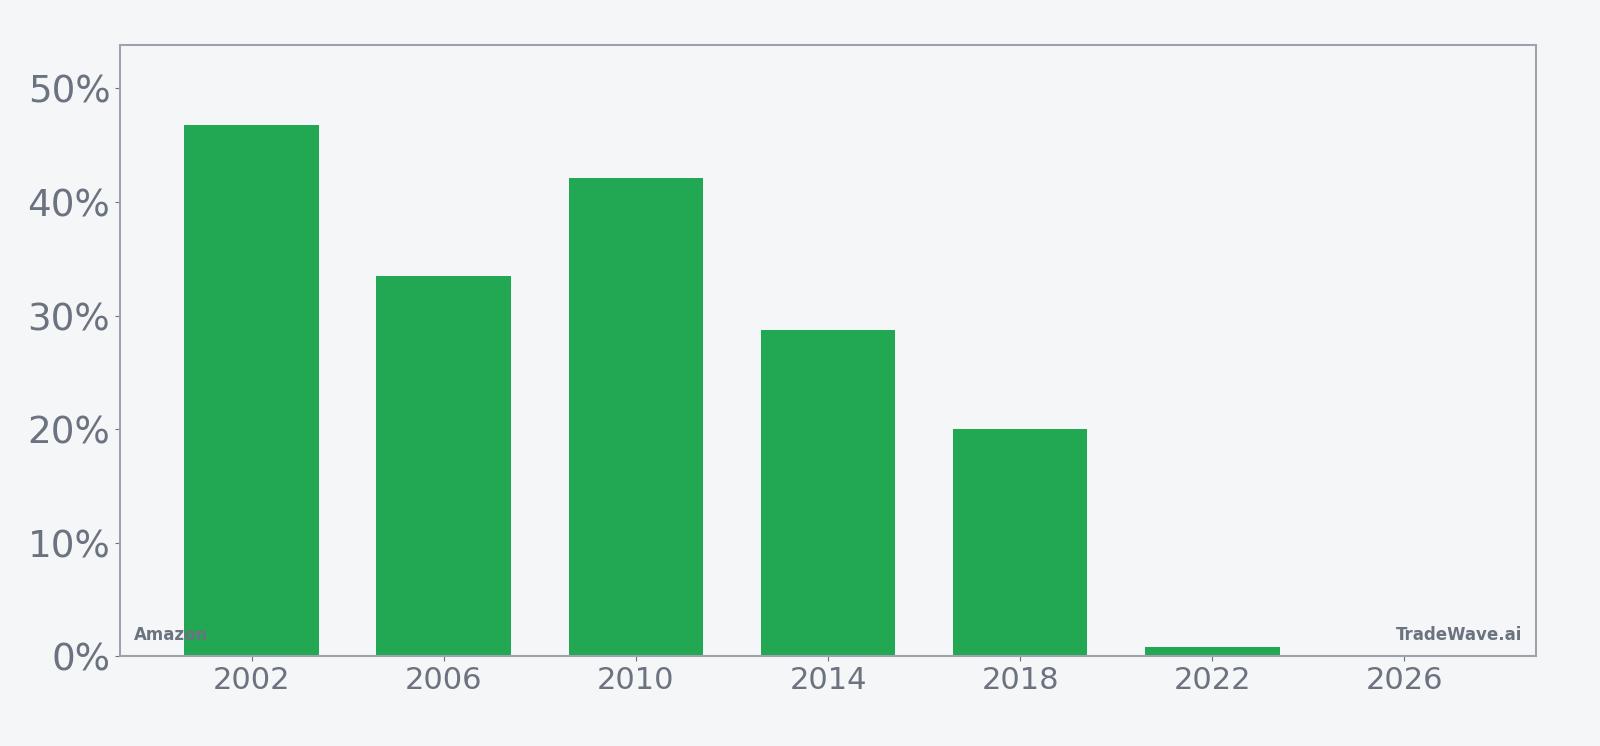
Amazon has risen in 6 of 6 midterm-election-year windows starting around May 11, with an average gain of 28.68% in winning years.
- 6 for 6 in this window, with winning years averaging 28.68% gains across a 348-day stretch.
- Pattern window runs from May 11 for 348 trading days, covering the late midterm year into the following pre-election year.
- Percent Profitable is 100%, with 6 winners and 0 losers across the last six midterm-election-year samples.
- Cumulative return across those six windows totals 334%, with a median single-window gain of 31.15%.
- Intraperiod swings have been large, with individual years showing worst drawdowns of more than 20% even when the window finished higher.
- TradeWave Ratio of 2.9 and a Sharpe ratio of 1.49 point to strong historical upside relative to volatility in this specific Amazon trading window.
According to historical data from TradeWave.ai, this upcoming midterm-year stretch for Amazon has behaved very differently from an average calendar year, and the next iteration is about to open again.
How has Amazon (AMZN) traded in this midterm-year window?
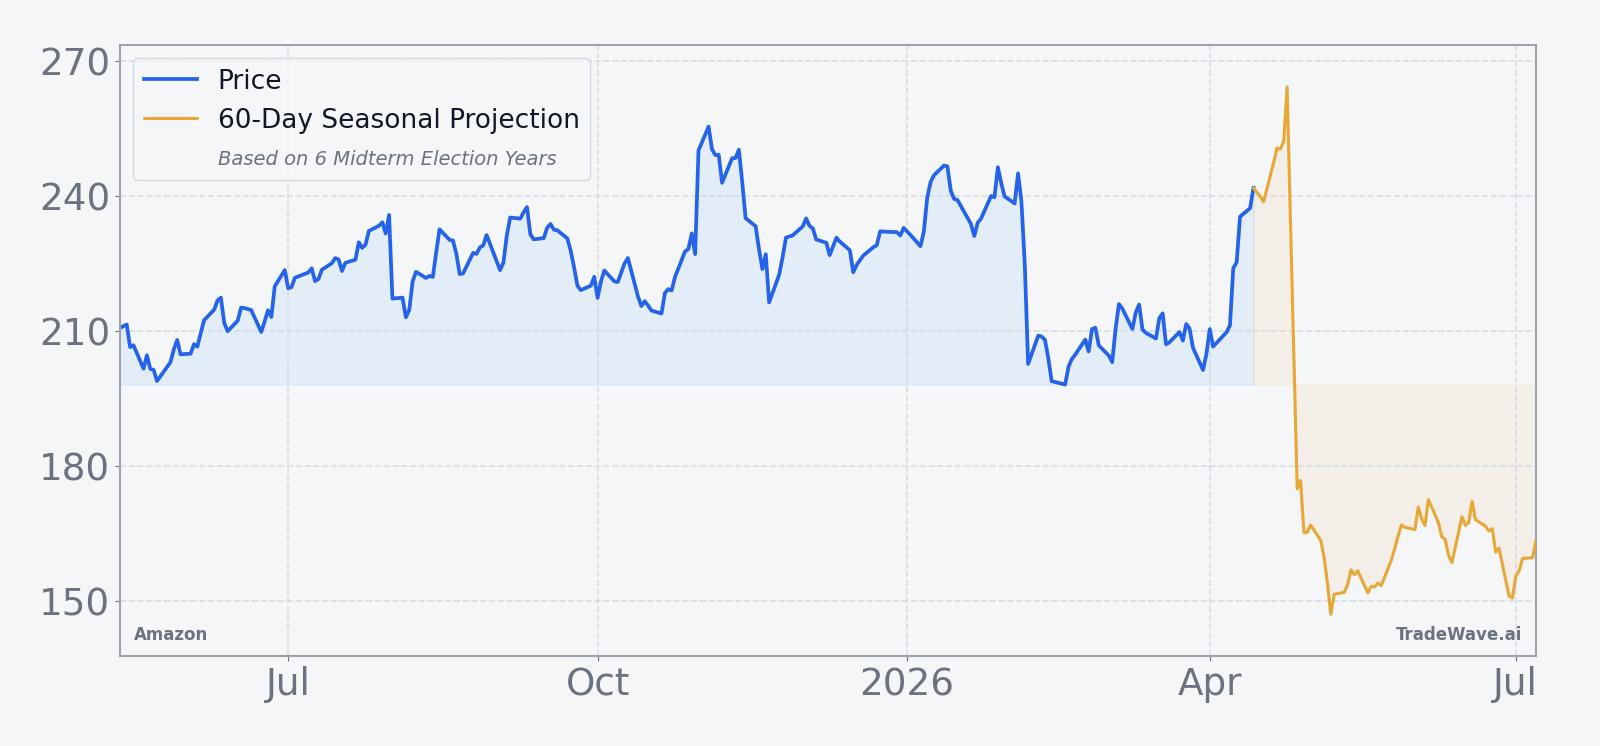
Amazon has risen in 6 of 6 midterm-election-year windows starting around May 11, averaging 28.68% gains over 348 trading days. The stock closed Thursday at $248.50, up about 3% year to date and roughly 3.9% below its 52-week high of $258.60.
This pattern groups Amazon’s behavior across the last six midterm election years, a phase where policy debates, spending decisions and regulatory noise often reshape expectations for big tech and e-commerce. The window that opens on May 11 stretches through the heart of the midterm year and deep into the following pre-election year, a span that has historically lined up with improving risk appetite for growth stocks.
Across the six midterm-year samples, the strongest single window came in 2002, when Amazon gained 46.82% between the May start and the end of the 348-day span, after a maximum favorable move of 61.89% and a worst intraperiod drawdown of 29.21%. The softest outcome was 2022, which still finished positive at 0.8% but saw a peak run-up of 39.1% and a maximum adverse move of 22.72%, underscoring how choppy the path can be even in a winning year.
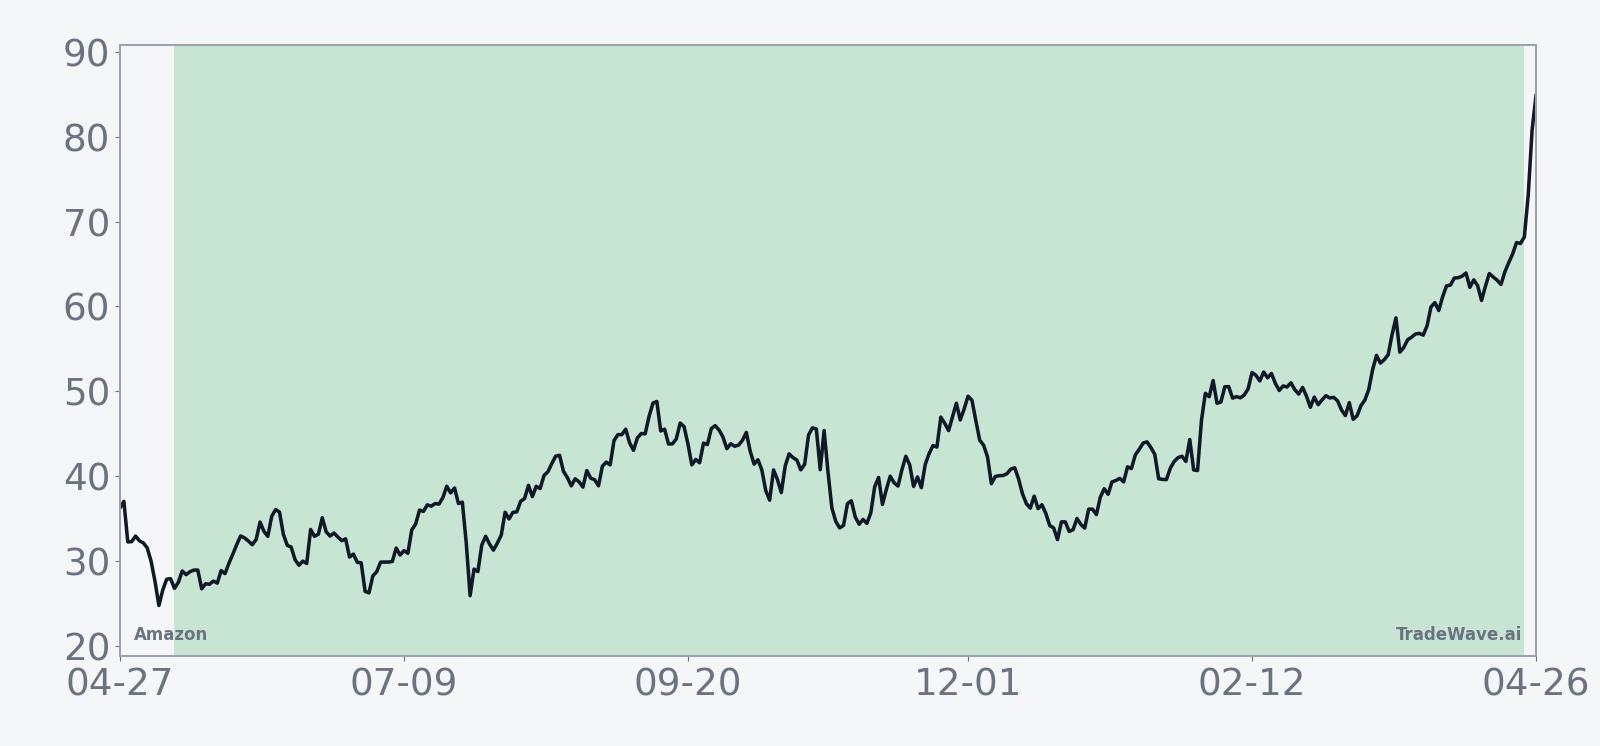
The historical seasonal trend line slopes higher for most of the 348-day window, with the bulk of gains clustering after the midpoint as the calendar transitions from the midterm year into the year before the presidential election. Early in the window, the pattern shows more back-and-forth trading, which lines up with the larger MAE readings seen in several years before the longer-term uptrend asserts itself.
A combined view of net returns, peak run-ups and worst drawdowns shows how much Amazon has tended to move inside this window before settling at its final result.
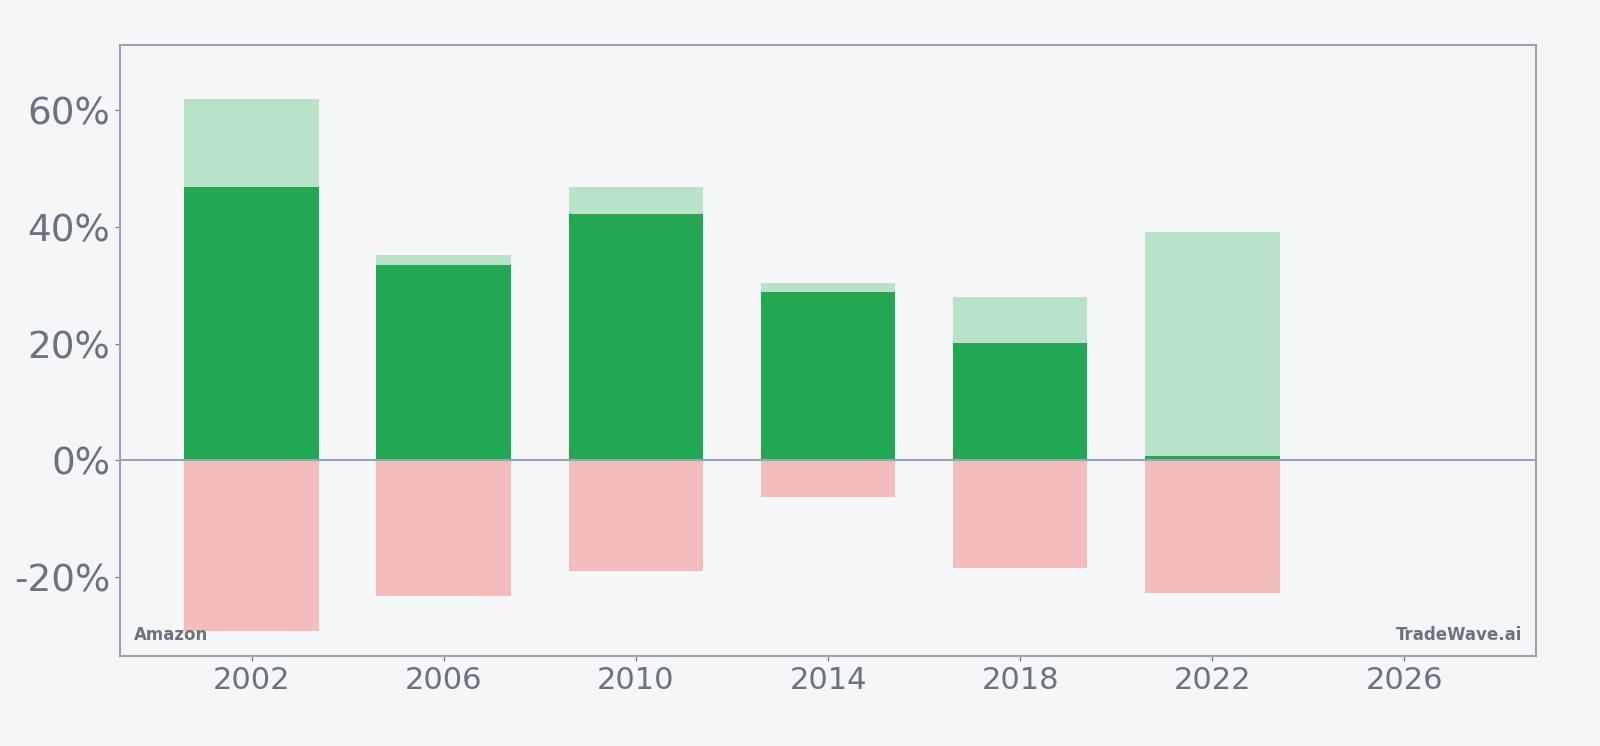
The bar chart highlights a key feature of this Amazon trading window: upside potential has been large, but so have the swings along the way. In several years, the maximum favorable move exceeded 30% while the worst drawdown also pushed beyond 20%, a profile that fits a long trade with strong trend potential but meaningful interim risk. Add it up: six straight winning windows, a 334% cumulative gain and a track record that has favored long exposure in this specific slice of the election cycle.
History does not guarantee future results; adverse excursions can be large even in winning windows, and traders should treat this seasonal pattern as context rather than a forecast.
Why does Amazon (AMZN) follow this seasonal pattern?
One likely driver is the way Amazon’s earnings calendar and guidance cadence line up with the political cycle, with midterm-year uncertainty often giving way to clearer spending and regulation signals as the next presidential race approaches. Analysts have also pointed to institutional portfolio repositioning into large-cap growth during the year before the presidential election, a phase that has historically been strong for risk assets. For Amazon specifically, recurring themes like holiday demand, AWS contract cycles and advertising budgets may reinforce that pattern by concentrating positive news flow in the back half of this 348-day window.
What is driving Amazon (AMZN) today?
Amazon shares finished Thursday at $248.50, down 0.21% on the day, leaving the stock about 3% higher for 2026 and roughly 3.9% below its 52-week high of $258.60. The move comes after a stretch where investors have focused on the balance between AWS growth, advertising momentum and retail margins, themes that dominated discussions around the company’s 2025 earnings cycle.[1][3][4][7]
The chart below shows how that recent drift fits into Amazon’s 12-month path, along with a short-term seasonal projection.
In Oct 2025, Amazon’s Q3 report showed revenue of $167.7 billion and earnings per share of $1.68, beating estimates and underscoring strength in AWS and online stores even as tariffs and labor costs remained in focus.[1][4][7] Earlier in Aug 2025, AWS growth that underwhelmed some investors triggered a sharp stock slide, but commentary at the time suggested capacity constraints could ease and set up a stronger AI and cloud growth runway.[2][3][7] Sector-wide, e-commerce and cloud names have leaned on expanding margins, advertising growth and ongoing workforce challenges, themes that continue to shape how investors value Amazon heading into the next leg of the election cycle.[5][6]
Looking ahead, the key tension for traders is that Amazon is already trading near the upper end of its 12-month range while the historical midterm-year seasonal pattern points to a long window that has repeatedly rewarded patience. For a stock that carries significant weight in major indices and in the broader tech and e-commerce narrative, how it behaves inside this 348-day window could influence sentiment well beyond a single ticker.
What should traders watch as this Amazon seasonal window opens?
First, the calendar: the next iteration of this midterm-year Amazon trading window begins on May 11 and runs for 348 trading days, carrying through the midterm election and into the year before the presidential vote. Historically, the strongest part of the pattern has come after the midpoint, so traders will be watching whether any early drawdowns resemble prior years’ maximum adverse moves or whether the stock grinds higher more smoothly this time.
Second, levels: with Amazon sitting just under its 52-week high, how it behaves around the $258 to $260 area as the window opens will matter. A decisive break higher that holds through typical pullbacks would be consistent with the historical long bias, while a failure at those levels followed by a 15% to 20% drawdown would echo the more volatile paths seen in 2002, 2006 and 2022.
Third, catalysts: earnings updates on AWS growth, AI infrastructure spending and advertising demand will be key checkpoints, especially as investors weigh tariff impacts and labor costs against margin expansion in e-commerce and cloud.[1][2][3][4][5][6][7] Stronger-than-expected cloud and ad trends during the back half of the window would line up with the historical pattern of gains clustering later in the cycle, while repeated disappointments could break a six-for-six streak.
Finally, volatility: the historical MFE and MAE profile shows that even winning years have featured deep swings, so traders may focus less on whether Amazon ticks higher every month and more on how it behaves after sharp moves. If big intraperiod selloffs are met with renewed buying that keeps the window net positive, that would echo the prior midterm-year playbook. A sustained break that fails to recover would mark a clear departure from the pattern and could signal a different election-cycle script for one of the market’s most important stocks.
Sources
- Business Insider: Amazon Q3 earnings updates (Oct 30, 2025)
- CNBC: UBS lifts Amazon price target (Oct 28, 2025)
- Yahoo Finance: Amazon stock slides after AWS results (Aug 1, 2025)
- Seeking Alpha: Amazon surges after Q3 beat (Oct 30, 2025)
- Seeking Alpha: Amazon: Workforce Related Challenges (Nov 3, 2025)
- Reuters: Amazon slumps after cloud computing growth underwhelms investors (Aug 1, 2025)
About this seasonal analysis
Seasonal pattern data is sourced from TradeWave.ai, which analyzes historical price behavior across annual calendar windows going back up to 30 years. Read the full data methodology or the book The 100-Year Pattern by Afshin Moshrefi (2026 edition). Past performance of seasonal patterns does not guarantee future results. This article is for informational purposes only and does not constitute investment advice.