Micron Technology (MU) Has Dropped in 10 of 10 Midterm Windows Starting May 10
Micron Technology is heading toward a midterm-year seasonal window that has been consistently bearish even as the stock trades near record highs on AI momentum.

What is the seasonal pattern for Micron Technology (MU)?
Micron Technology has fallen in 10 of 10 midterm-year windows starting around May 10, with an average 21.15% gain for short positions in winning years.
- 10 for 10 in this window, with short trades averaging 21.15% profit in winning years across the last 10 midterm election cycles.
- Seasonal setup is bearish for the stock price, running 156 trading days from May 10 in midterm election years.
- Percent Profitable is 100%, with 10 winners and 0 losers for the short-side pattern in this Micron Technology trading window.
- Average winner profit of 21.15% comes alongside individual years where short trades captured moves as large as 50.0%.
- The TradeWave Ratio of 1.82 signals that price has typically traveled meaningfully in the trade direction within the window, not just at the close.
- Several years featured deep intraperiod drawdowns before ultimately resolving lower, underscoring that volatility has been part of this MU seasonal trend.
According to historical data from TradeWave.ai, Micron’s behavior around midterm election years has followed a distinct seasonal script that differs from its performance in other parts of the cycle. The next section walks through how that script has played out in prior midterm years and what that backdrop means for the coming window.
How has Micron Technology (MU) traded in past midterm-year windows starting in May?
Micron Technology has fallen in every single midterm-year window starting around May 10 for the last 10 cycles, with short trades averaging 21.15% profits over 156 trading days. Today the stock closed at 456.23, up about 598.3% from its 52-week low and only about 3.1% below its 52-week high, after a powerful AI-driven run that has already delivered roughly 58% gains year to date.[1][3][5][9]
Because this pattern is grouped by the presidential election cycle, it reflects how Micron has behaved specifically in midterm election years rather than across consecutive calendar years. That matters in 2026 because markets are in the midterm election year phase, a stretch that often brings policy uncertainty, shifting fiscal expectations and more tactical sector rotation than the pre-election year that follows.
In this framework, the upcoming Micron Technology trading window begins on May 10 and runs for 156 trading days, covering much of the midterm year and brushing up against the transition into the year before the presidential election. The trade direction for this pattern is short, meaning the historical “wins” are years when Micron’s stock price trended lower over the window and short positions benefited from that decline.
Across the last 10 midterm election years in this specific window, the Percent Profitable metric is 100%, with 10 winners and 0 losers for the short side. Average profit for those winning short trades is 21.15%, while the median profit is 17.05%, suggesting that the typical outcome has been a sizable but not extreme decline, with a few very large down years pulling the average higher.
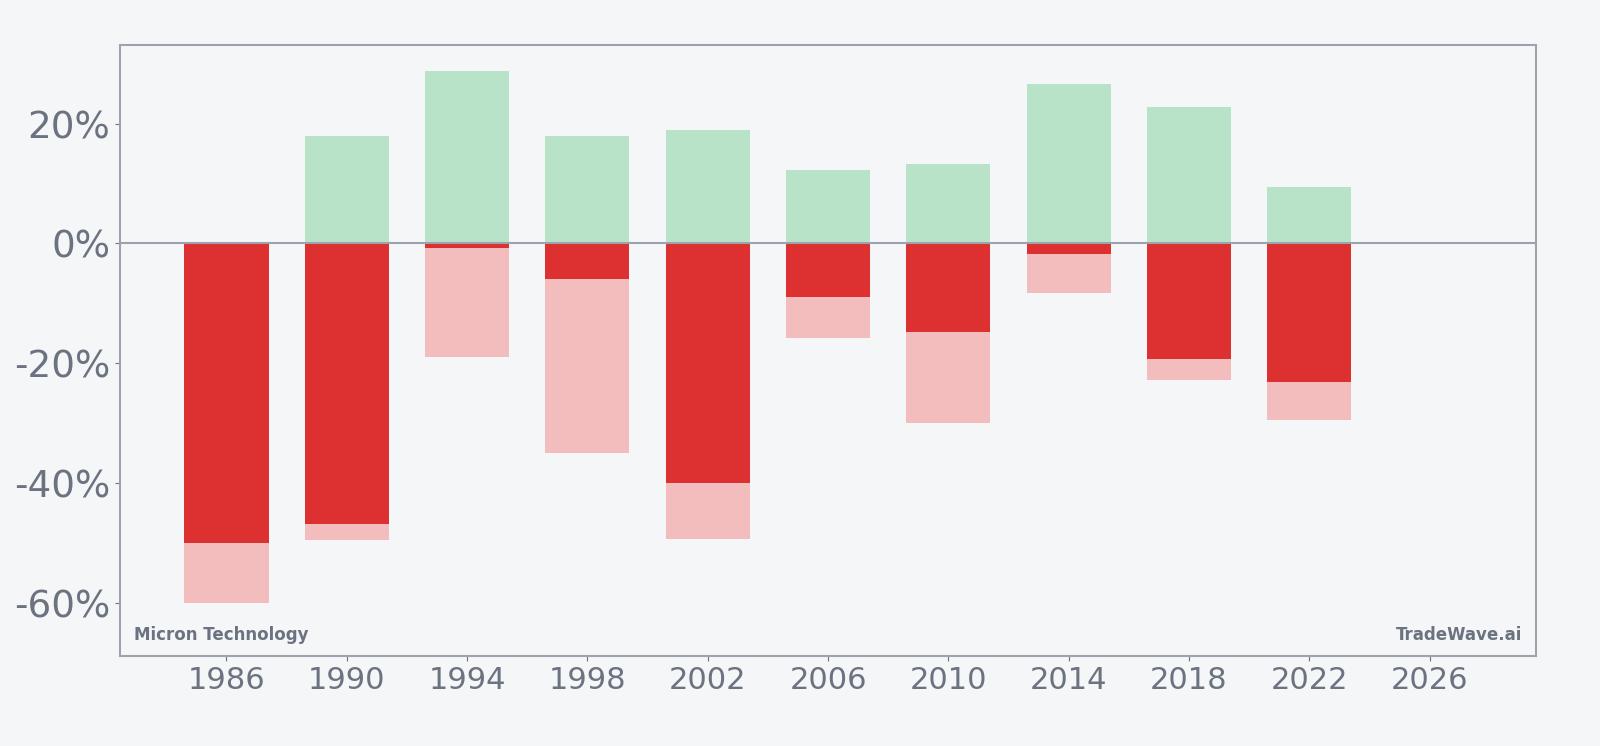
The per-year table shows how wide that range has been. In 1986, a short trade in this window captured a 50.0% net return as Micron’s stock slid from an entry price of 1.4345 to 0.7172, while in 1990 the net return was 46.85% as the stock fell from 1.3269 to 0.7053. At the other end of the spectrum, 1994 and 2014 were marginal years for the pattern, with net returns of just 0.81% and 1.75% respectively, even though both still counted as winners for shorts.
Maximum favorable excursion and maximum adverse excursion numbers help explain how bumpy those rides have been. Maximum favorable excursion, or MFE, is the best intraperiod move in the trade direction from the entry, while maximum adverse excursion, or MAE, is the worst drawdown against the position before the window ends. In 1994, for example, the short trade’s MFE was 28.85% even though the final net return was only 0.81%, while MAE reached 19.0%, showing that the stock rallied sharply at points before ultimately drifting lower.
Several other years show a similar pattern of large swings. In 1998, the short trade’s MFE was 18.02% and MAE was 35.02%, and in 2010 the MFE was 13.2% with MAE of 30.03%. Those profiles suggest that even in winning years for the short pattern, Micron has often staged sizable countertrend rallies inside the window before resuming its downward path, a reminder that timing and risk management have mattered as much as direction.
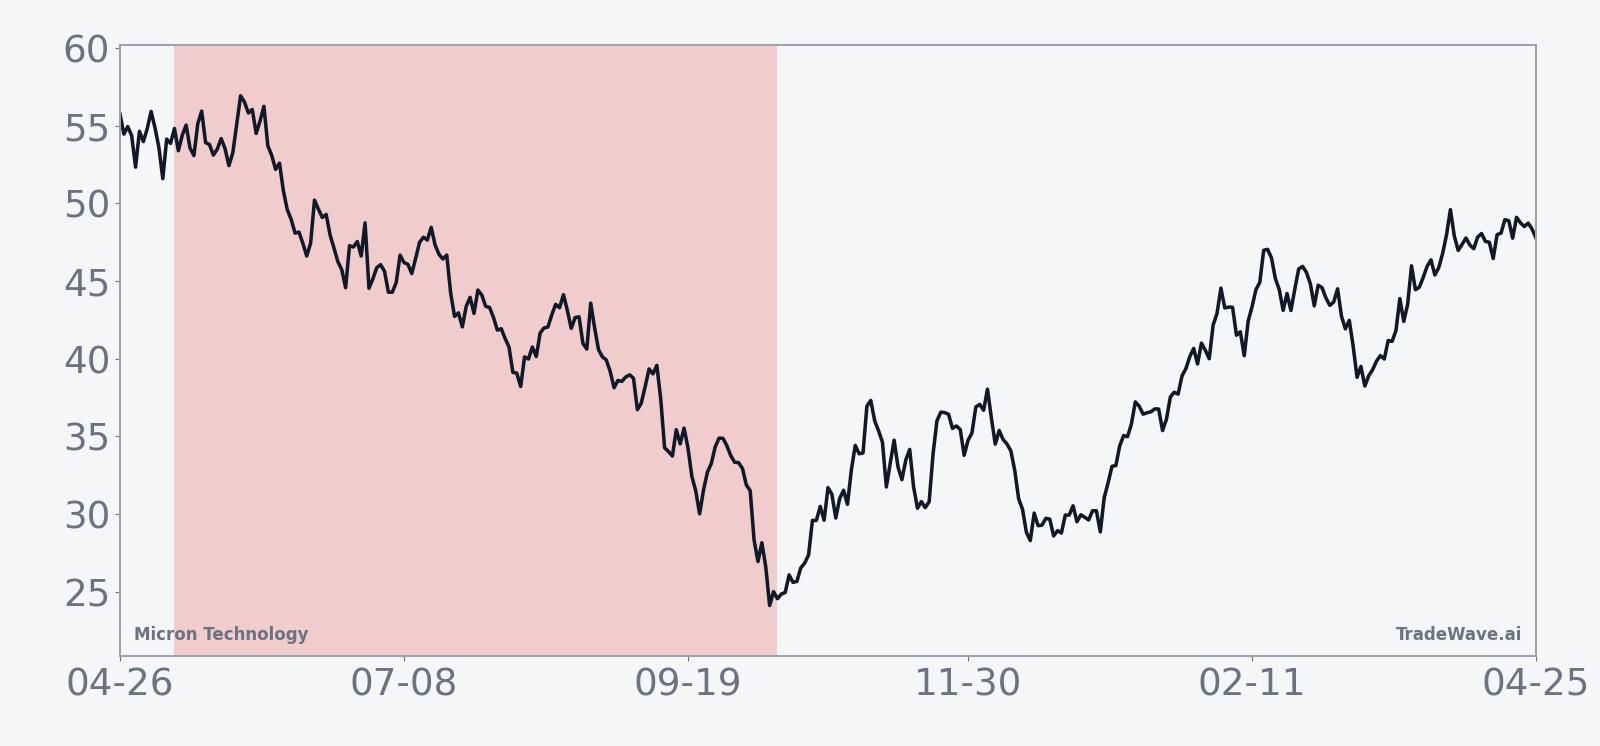
The historical seasonal trend chart for this window smooths those individual years into an average path. It shows Micron typically starting to weaken early in the window, with the bulk of the downside accruing over the middle portion of the 156 trading days and then flattening out toward the end. That shape lines up with the idea that midterm-year policy and macro uncertainty often peaks in the middle of the year before easing as the political calendar becomes clearer.
The cumulative return view across all 10 midterm-year windows reinforces how persistent this pattern has been. Cumulative short-side returns climb steadily over the sample, reaching a total of 515%, which means that a hypothetical strategy that repeated this short window every midterm year would have compounded meaningfully over time, even with the choppy intraperiod swings seen in several cycles.
A second view stacks yearly net results with their best and worst intraperiod swings to show how far Micron has tended to move in both directions during this window.
History does not guarantee future results; adverse excursions can be large even in winning windows, and Micron’s future path may differ from its historical seasonal pattern.
Why does Micron Technology (MU) follow this seasonal pattern?
One likely driver is the way Micron’s earnings calendar and capital spending plans line up with the midterm-year policy cycle, which can amplify swings in demand expectations for memory tied to data centers and AI projects.[1][3][8] Analysts have also pointed to institutional portfolio repositioning around midyear, when big funds reassess exposure to high-beta semiconductor names after early-year moves.[9] The pattern may also reflect how investors handicap regulatory and fiscal outcomes in Washington during midterm seasons, which can influence risk appetite for cyclical tech stocks like Micron.
What is driving Micron Technology (MU) today?
Micron shares finished Thursday at 456.23, down 2.0% on the day but still roughly 58% higher year to date and trading just about 3.1% below their 52-week high of 470.94.[1][3][5][9] The stock has been one of the clearest beneficiaries of the AI infrastructure build-out, with recent quarterly results showing revenue up 196% year over year to 23.86 billion and earnings per share of 12.20, both well ahead of expectations as high-bandwidth memory and DRAM demand surged.[1][3][4]
On Mar 18, Micron reported that blowout Q2 fiscal 2026 print and guided for Q3 revenue of 33.5 billion with EPS of 19.15 and gross margins around 81%, reinforcing the view that AI-related demand is still ramping rather than peaking.[1][4] The following day, however, the stock slid as much as 7% in premarket trading and finished lower as investors took profits after what one analyst called a “historic run,” even as Wall Street broadly praised the guidance and reiterated bullish views on the AI memory cycle.[3][5]
Options traders had already been leaning bullish into that report, with contracts pricing in roughly an 8% move and positioning skewed toward upside bets, a sign that speculative interest had built alongside the fundamental story.[13] At the same time, short interest sat at just 2.61%, leaving relatively little outright bearish positioning in the name despite its sharp rally and the looming seasonal window that has historically favored short trades.[1]
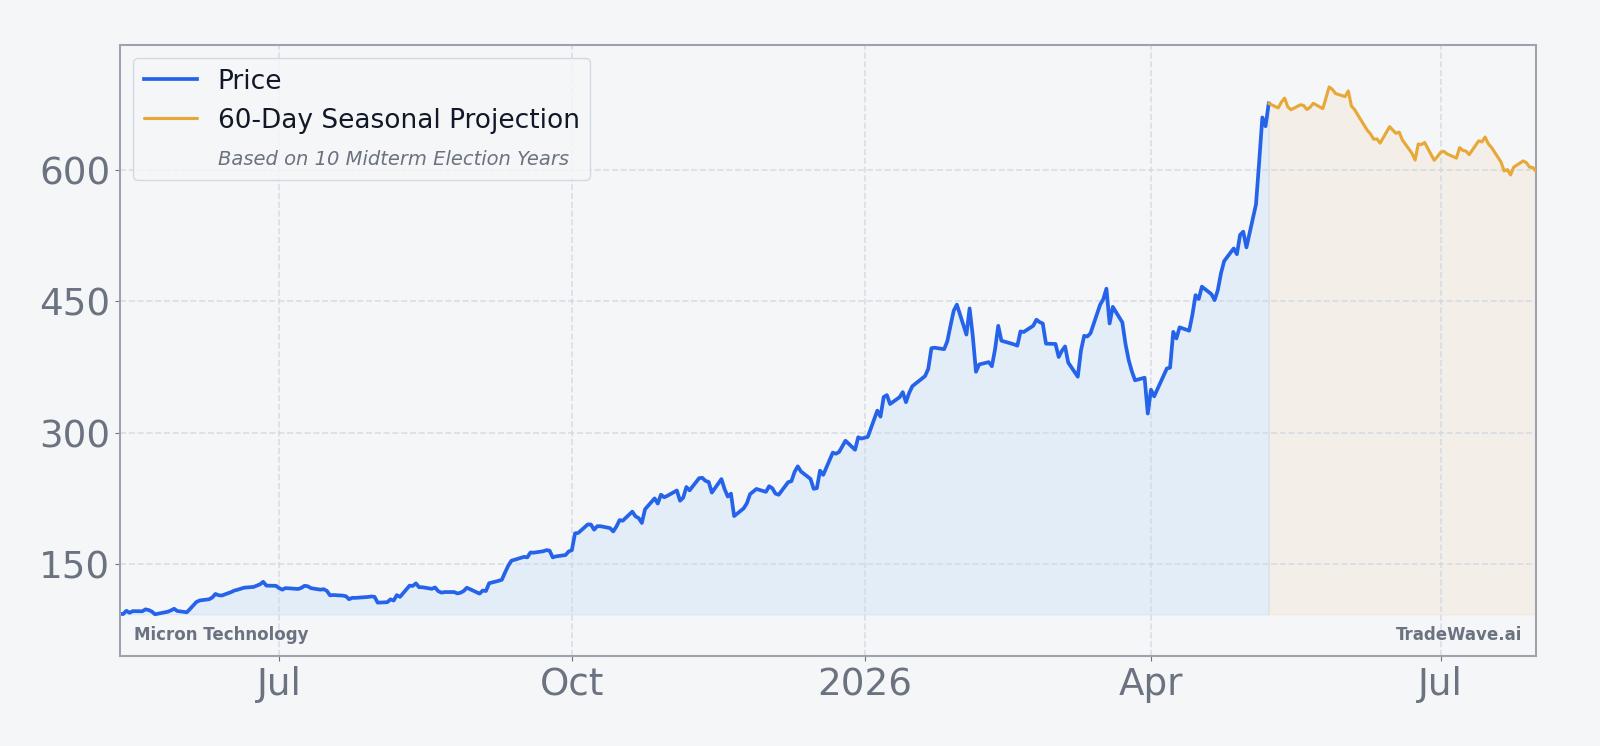
The chart below situates the latest pullback against Micron’s powerful multi-month uptrend and a 60-day seasonal projection.
What should traders watch as Micron enters this midterm-year window?
First, the calendar: the 156-day midterm-year window starting May 10 has historically been a weak stretch for Micron’s share price, so traders will be watching how the stock behaves as that date approaches and whether any early selling pressure appears ahead of the pattern. Second, levels matter: with the stock sitting just below its 52-week high, how Micron trades around that zone and any subsequent breaks of recent support will help confirm or contradict the historical seasonality.[1][3][5]
Third, the AI demand narrative will stay front and center. Any signs that hyperscaler or data center customers are moderating orders, or that pricing for high-bandwidth memory is flattening, could interact with the historically bearish seasonal window to produce sharper swings than investors have seen so far in 2026.[1][3][8][11] Finally, traders should keep an eye on options flow and short interest: if bullish options positioning fades or reverses and short interest begins to climb from its low base, that shift in positioning would align more closely with the midterm-year pattern that has historically rewarded short exposure in Micron.[1][3][13]
Sources
- Seeking Alpha: Micron Q2 Earnings Preview: Expect Another Monster Quarter (Mar 14, 2026)
- Yahoo Finance: Analysts Lift Micron Price Targets Ahead of Quarterly Earnings (Dec 17, 2025)
- Seeking Alpha: Micron slides as investors take profits after historic run; analysts praise guidance (Mar 19, 2026)
- Seeking Alpha: Micron Just Smashed Estimates - Buy The Dip (Mar 18, 2026)
- Yahoo Finance: Micron stock falls more than 4% despite Q2 earnings beat amid growth concerns (Mar 19, 2026)
- Seeking Alpha: Micron stock jumps after raising Q4 guidance (Aug 11, 2025)
- Seeking Alpha: Micron: Memory Downcycle Sooner Than Expected (Mar 16, 2026)
- Seeking Alpha: Micron Technology: I'm Buying And Not Looking Back (Apr 12, 2026)
- Zacks Investment Research: The Surge in Micron Technology Stock Looks Poised to Continue (Feb 13, 2026)
- Seeking Alpha: Micron options lean bullish ahead of earnings with ~8% move priced in (Mar 18, 2026)
About this seasonal analysis
Seasonal pattern data is sourced from TradeWave.ai, which analyzes historical price behavior across annual calendar windows going back up to 30 years. Read the full data methodology or the book The 100-Year Pattern by Afshin Moshrefi (2026 edition). Past performance of seasonal patterns does not guarantee future results. This article is for informational purposes only and does not constitute investment advice.