Tariff Hit and Soft Guidance Clash With 100% Win Rate Window for Nike, Inc. (NKE)
Nike, Inc. is limping near multi‑year lows just weeks before a historically powerful midterm-year seasonal window, setting up a sharp clash between bearish sentiment and a long-running bullish pattern.

What is the seasonal pattern for Nike, Inc. (NKE)?
Nike, Inc. has risen in 9 of 9 midterm-election-year windows starting in early May, with an average gain of 26.82% in winning years.
- 9 for 9 in this window, averaging 26.82% gains in winning years across the last nine midterm election cycles.
- Seasonal window begins May 6 and runs 358 trading days, covering late midterm year into the following pre-election year.
- Percent Profitable is 100%, with 9 winners and 0 losers in the historical sample.
- Annualized return of 26.07% and a Sharpe ratio of 1.6 point to unusually strong risk-adjusted performance.
- TradeWave Ratio of 2.0 signals that price has typically traveled meaningfully in the long direction within the window.
- Individual years have still seen sizable drawdowns inside the window, with adverse moves as deep as roughly 28% before recovering.
According to historical data from TradeWave.ai, this upcoming stretch for Nike has behaved very differently from an average year, with a distinct midterm-election-year signature that most traders never see on a standard chart.
How has Nike, Inc. (NKE) traded in past midterm-year windows starting in May?
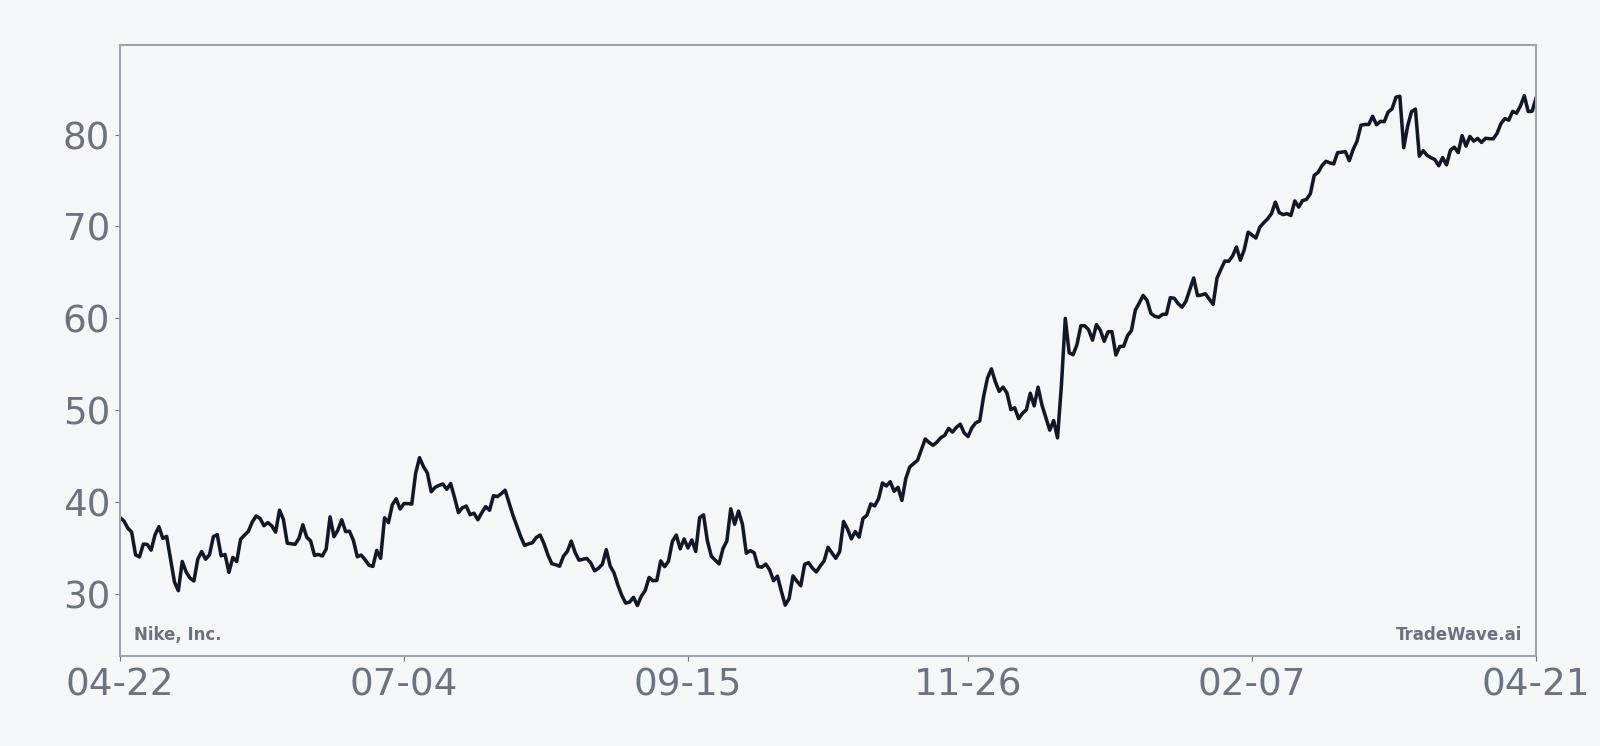
Nike, Inc. has risen in all nine midterm-election-year windows that began around May 6, averaging 26.82% gains and delivering a cumulative 704% return across those cycles. Today the stock closed at 44.19, leaving it about 43.6% below its 52-week high of 78.31 and only slightly above its 52-week low of 43.17, a backdrop that makes any historically strong window especially interesting for beaten-down shareholders. Significant insider buying, including a reported $2.9 million purchase by Apple CEO Tim Cook in late 2025, has added a rare vote of confidence from the C-suite crowd even as the stock has struggled.[1]
Grouping the data by the presidential election cycle matters here because this window always lands in the midterm election year and then runs deep into the year before the presidential election, a phase that has often coincided with shifting policy expectations and renewed risk appetite in equities. For a consumer brand tied to discretionary spending and global trade, that policy backdrop can be just as important as sneaker launches or sponsorship deals.
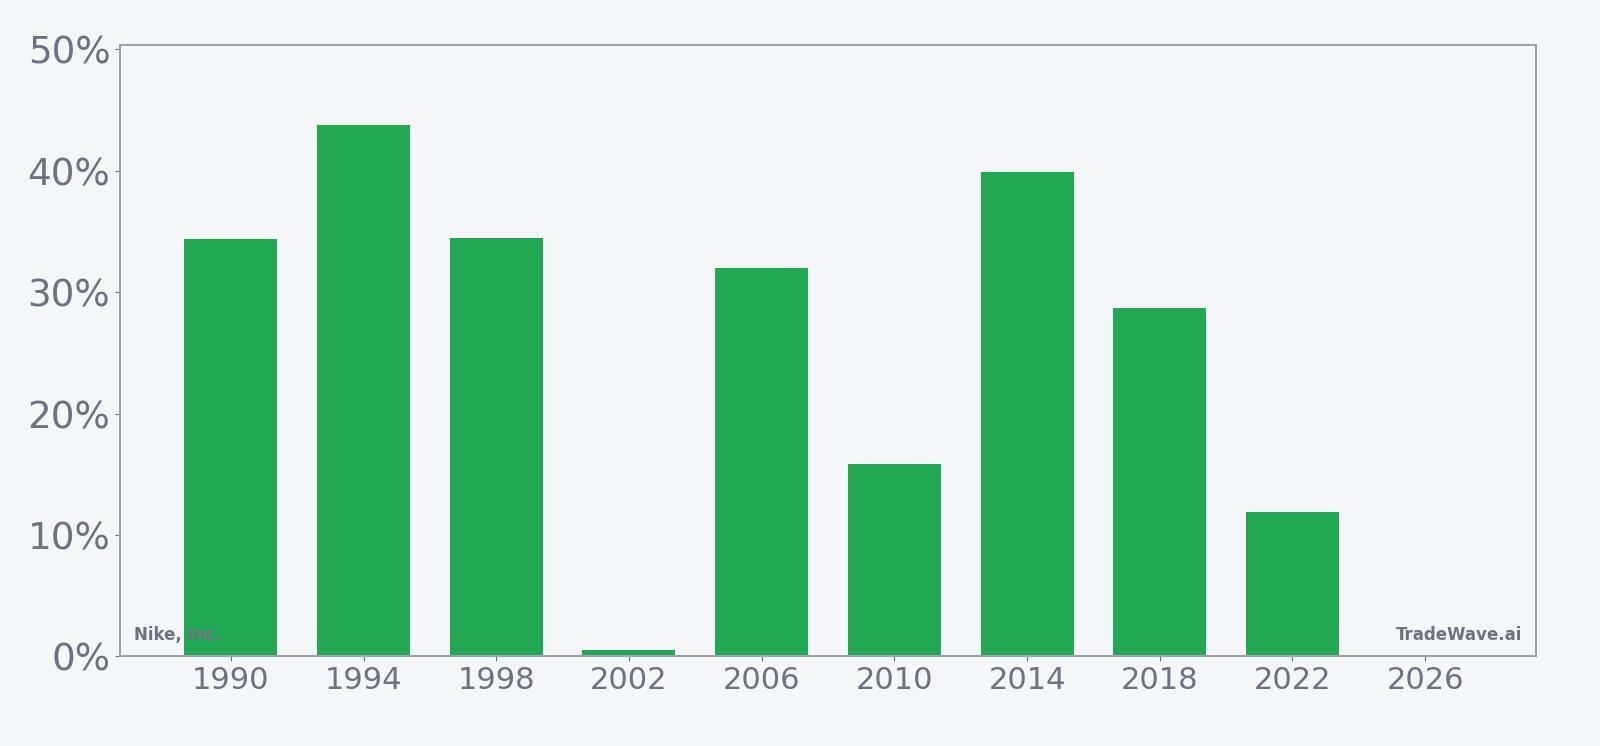
This seasonal window begins on May 6 and spans 358 trading days, carrying Nike from the early part of the midterm election year into the heart of the year before the presidential election. Historically, during this period, Nike has shown a strong long-side bias, with every one of the nine past windows finishing higher. The average gain of 26.82% masks a wide range of outcomes, from a modest 0.51% advance in 2002 to a 43.8% surge in 1994, but the direction has been consistently positive for long exposure.
For a long pattern, the key question is how much upside has been available and how painful the path has been. In the strongest years, Nike’s maximum favorable move inside the window has reached between roughly 30% and more than 50%, as seen in 1990, 1994, 2014 and 2018. On the downside, the worst intraperiod drawdowns have been meaningful in several cycles, with maximum adverse moves of about 27% in 1990, 33.6% in 1998, 28.46% in 2002 and 27.8% in 2022 before the stock ultimately finished the window in the green.
That mix of large positive excursions and sizable temporary hits is what the TradeWave Ratio of 2.0 is flagging. TradeWave Ratio is defined as how far price typically travels in the trade direction within the window, independent of the final close, and a value of 2.0 suggests Nike has often covered substantial ground for longs during this stretch. The Sharpe ratio of 1.6, based on end-of-window outcomes, indicates that those gains have come with risk-adjusted consistency rather than a single lucky outlier year.
The historical seasonal trend line for this window slopes upward in a relatively steady fashion, with gains tending to accrue over the full 358-day span rather than in a single burst. Earlier portions of the window have sometimes been choppy, but the typical pattern shows Nike grinding higher as the midterm year gives way to the year before the presidential election, when broader equity risk appetite has often improved.
A stacked view of net returns alongside best and worst intraperiod moves shows how upside and drawdowns have coexisted in this pattern.
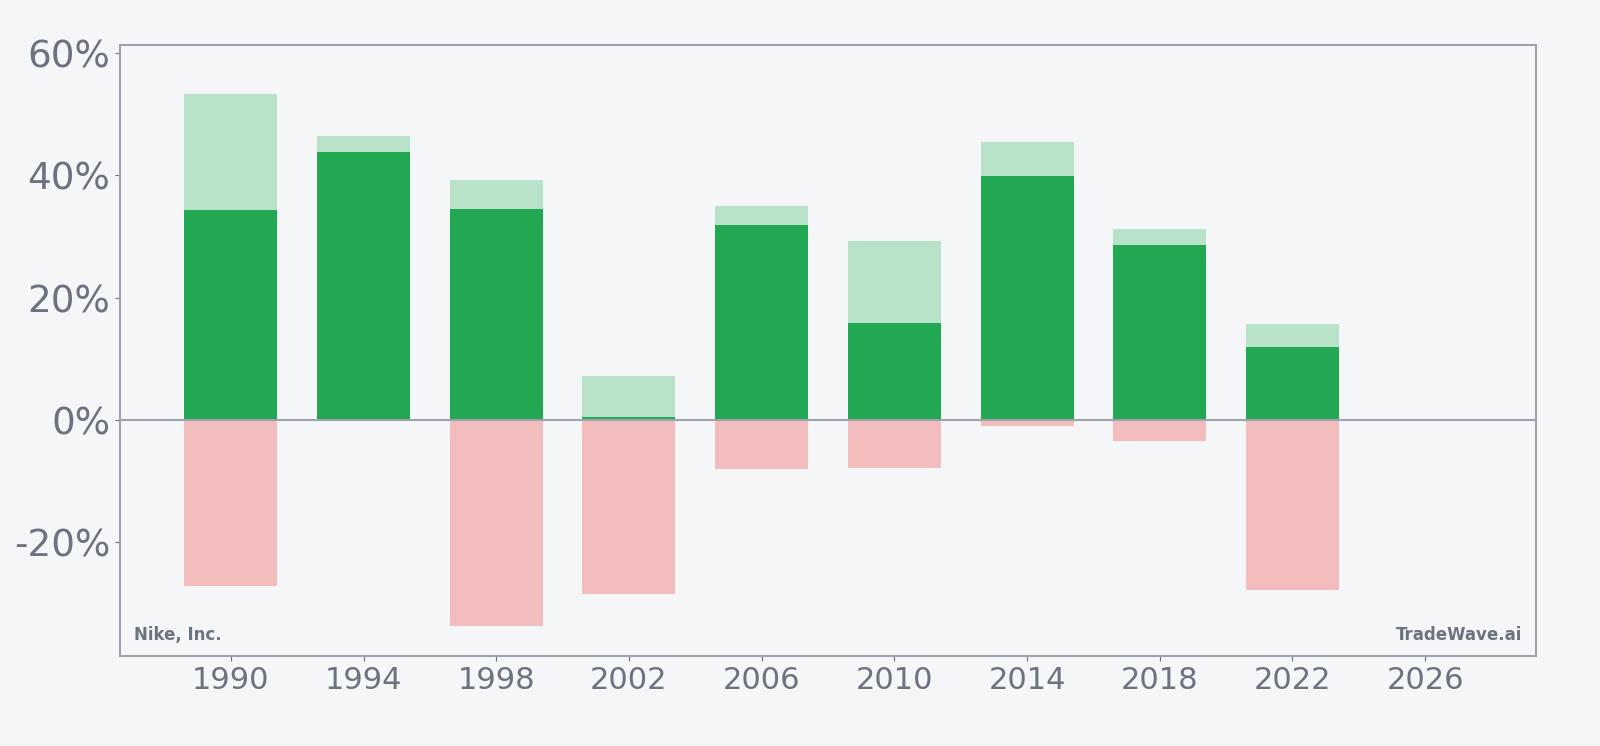
Looking across individual years, the bars that combine net results with maximum favorable and adverse excursions tell a clear story: Nike has usually offered substantial upside for longs in this window, but several cycles required investors to sit through double-digit drawdowns before those gains materialized. Years like 2014 and 1994 show powerful rallies with relatively contained downside, while 1990, 1998, 2002 and 2022 underline that even winning windows can feel uncomfortable along the way.
History does not guarantee future results; adverse excursions can be large even in winning windows, and past seasonal strength does not ensure similar outcomes in 2026–2027.
Why does Nike, Inc. (NKE) follow this seasonal pattern?
One likely driver is the way Nike’s fiscal calendar and product cycle line up with the broader presidential election cycle. Analysts have often pointed to midterm and pre-election years as periods when fiscal and monetary policy visibility improves, supporting discretionary spending and brand-heavy consumer names. For Nike specifically, the May-start window captures back-to-school, holiday and early spring product flows across two fiscal years, which may amplify the impact of portfolio rebalancing and sector rotation into consumer and growth stocks during historically friendlier parts of the election cycle.
What is driving Nike, Inc. (NKE) today?
Nike shares finished Monday at 44.19, down 0.99% on the day, extending a rough stretch that has left the stock about 43.6% below its 52-week high and only a dollar above its 52-week low. The one-month return sits at a steep -23.84%, with trading volume over the latest session, at roughly 63.2 million shares, running well above the 20-day average of about 22.3 million as investors digest softer guidance and a bruising reset in expectations.
On Mar 31, 2026, Nike used its latest earnings call to guide for fourth-quarter revenue down 2–4%, citing tariffs, inventory clean-up and persistent demand challenges in China as key headwinds.[1] Management framed these pressures as part of its “Win Now” turnaround plan, which aims to work through aging inventory and refocus the brand, but the guidance reinforced concerns that the reset could take longer and cut deeper than bulls had hoped.[1] A separate macro-focused note in late March highlighted that the stock had fallen to roughly nine-year lows, with investors openly questioning whether the turnaround is on track or still in its early innings.[1]
Those worries sit awkwardly beside a wave of insider buying that emerged late last year. In December 2025, Apple CEO Tim Cook disclosed a $2.9 million purchase of Nike shares, a move that helped spark a short-lived 4.6% rally and was widely read as a high-profile vote of confidence in the brand’s long-term prospects.[1] Additional insider purchases by Nike executives around the turn of the year reinforced that message, even as the stock’s fundamental narrative remained challenged by tariffs and China softness.[1]
The chart below situates the latest slide against Nike’s past year of trading and a short-term seasonal projection.
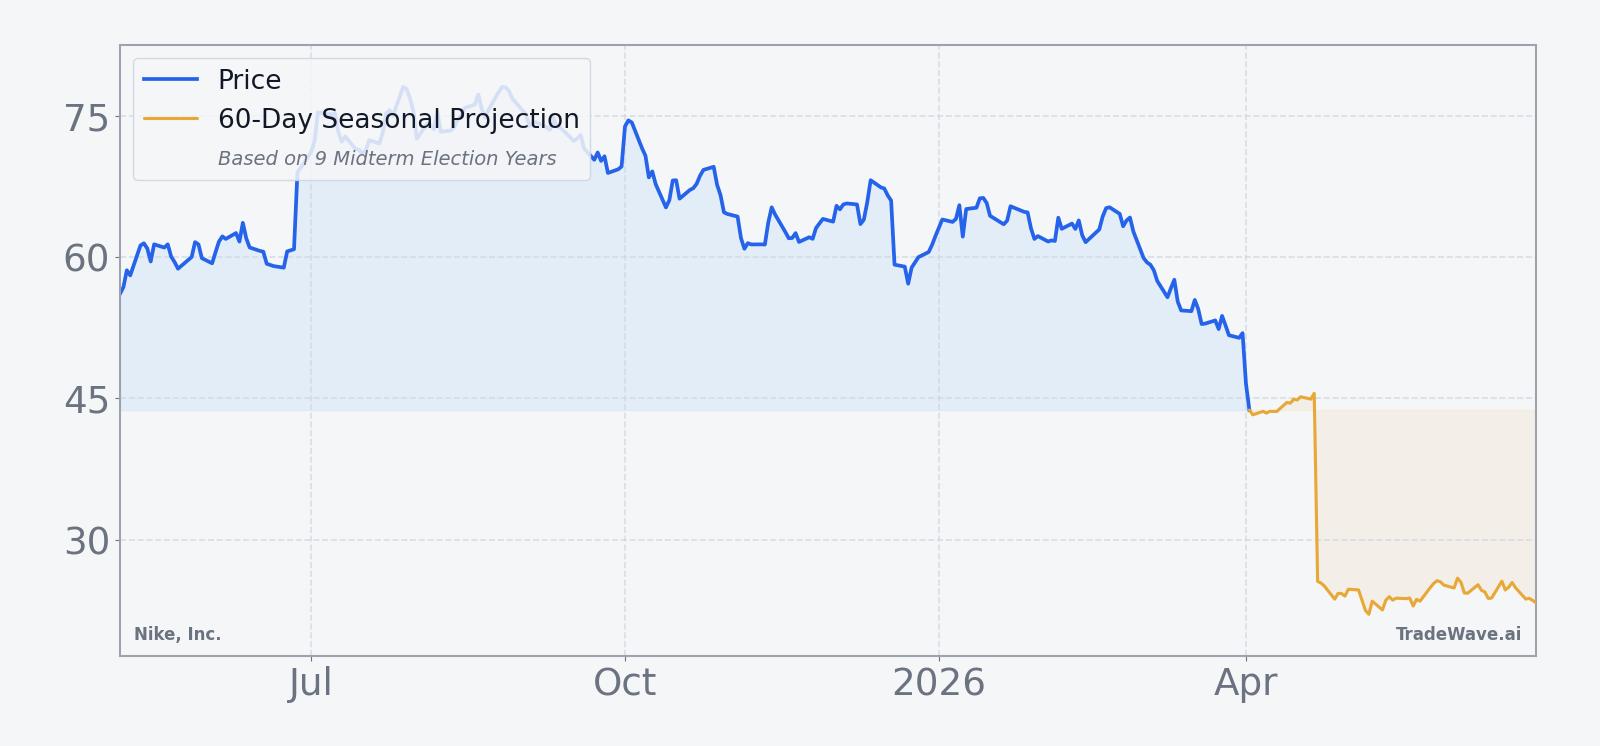
Technically, Nike is trading well below its 50-day simple moving average of 58.89, underscoring how far sentiment has swung against the stock in recent weeks. The gap between price and that intermediate trend line, combined with elevated volume, suggests a market that has already repriced aggressively to the downside. Against that backdrop, the looming seasonal window and the insider buying signal form a sharp contrast with the current tape.
Sources
About this seasonal analysis
Seasonal pattern data is sourced from TradeWave.ai, which analyzes historical price behavior across annual calendar windows going back up to 30 years. Read the full data methodology or the book The 100-Year Pattern by Afshin Moshrefi (2026 edition). Past performance of seasonal patterns does not guarantee future results. This article is for informational purposes only and does not constitute investment advice.