Starbucks (SBUX) Has Risen in 7 of 7 Midterm Windows Starting Apr 28, Averaging 9.83% Gains
Starbucks is heading toward a historically strong midterm-year seasonal window even as the stock trades well below its 52-week high and investors weigh the durability of its turnaround.

What is the seasonal pattern for Starbucks (SBUX)?
Starbucks has risen in 7 of 7 midterm-election-year windows starting on Apr 28 and lasting 192 trading days, with an average gain of 9.83% in winning years.
- 7 for 7 in this window, with Starbucks posting gains every time and averaging 9.83% in winning years.
- The upcoming 192-day window begins Apr 28 and runs deep into the year, covering the heart of the midterm election cycle.
- Percent Profitable is 100%, with 7 winners and 0 losers across the last seven midterm-election-year samples.
- The trade direction is long, supported by a TradeWave Ratio of 1.72 and a Sharpe ratio of 1.03 over the window.
- Individual years have seen sharp swings, with some windows experiencing double-digit intraperiod drawdowns before finishing higher.
- Today SBUX trades about 17.2% below its 52-week high, so this historically strong window would open from a discounted base if the pattern repeats.
According to historical data from TradeWave.ai, this specific late-April window has behaved very differently from an average stretch on the Starbucks calendar. The next section walks through how that midterm-election pattern has played out in prior cycles and what it means for the months ahead.
How has Starbucks (SBUX) traded in past midterm-year windows starting in late April?
Starbucks has risen in 7 of 7 midterm-election-year windows that start on Apr 28 and run for 192 trading days, averaging a 9.83% gain in those winning stretches. Today the stock closed at 86.81, down 4.8% on the session and sitting about 17.2% below its 52-week high of 104.82, so this historically strong window is set to open with SBUX already marked down.[6]
Grouping the data by the presidential election cycle matters here because this window only looks at midterm election years, which often feature policy uncertainty, shifting rate expectations and choppy consumer sentiment. For a consumer discretionary name like Starbucks, that backdrop can amplify how investors react to each earnings print and macro headline, so a consistent pattern across seven separate midterm years stands out.
Across those seven midterm-election-year samples, the trade direction is firmly long. Percent Profitable is 100%, with 7 winners and 0 losers, and the cumulative return across all windows is 90%. Average profit in winning years is 9.83%, while the median outcome is 8.32%, which shows that the typical gain has been solid rather than reliant on a single outlier year.
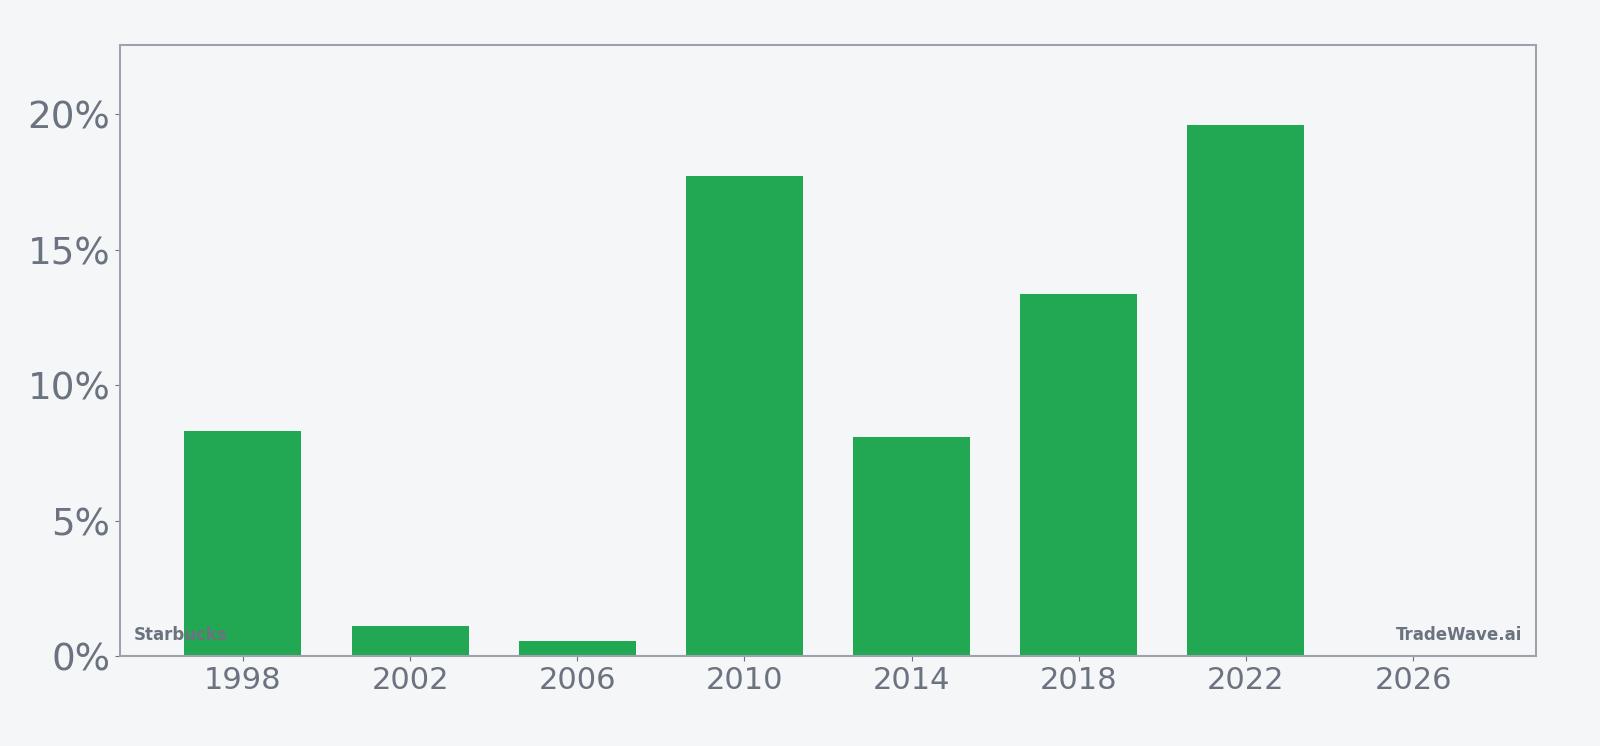
The per-year table shows how that plays out in practice. The weakest net result was 0.56% in 2006, while the strongest was 19.62% in 2022, when Starbucks rallied from an entry price of 69.91 to 83.63 by the end of the window. In between, years like 2010 and 2018 delivered double-digit gains of 17.73% and 13.37% respectively, suggesting that when the pattern works, it can work meaningfully.
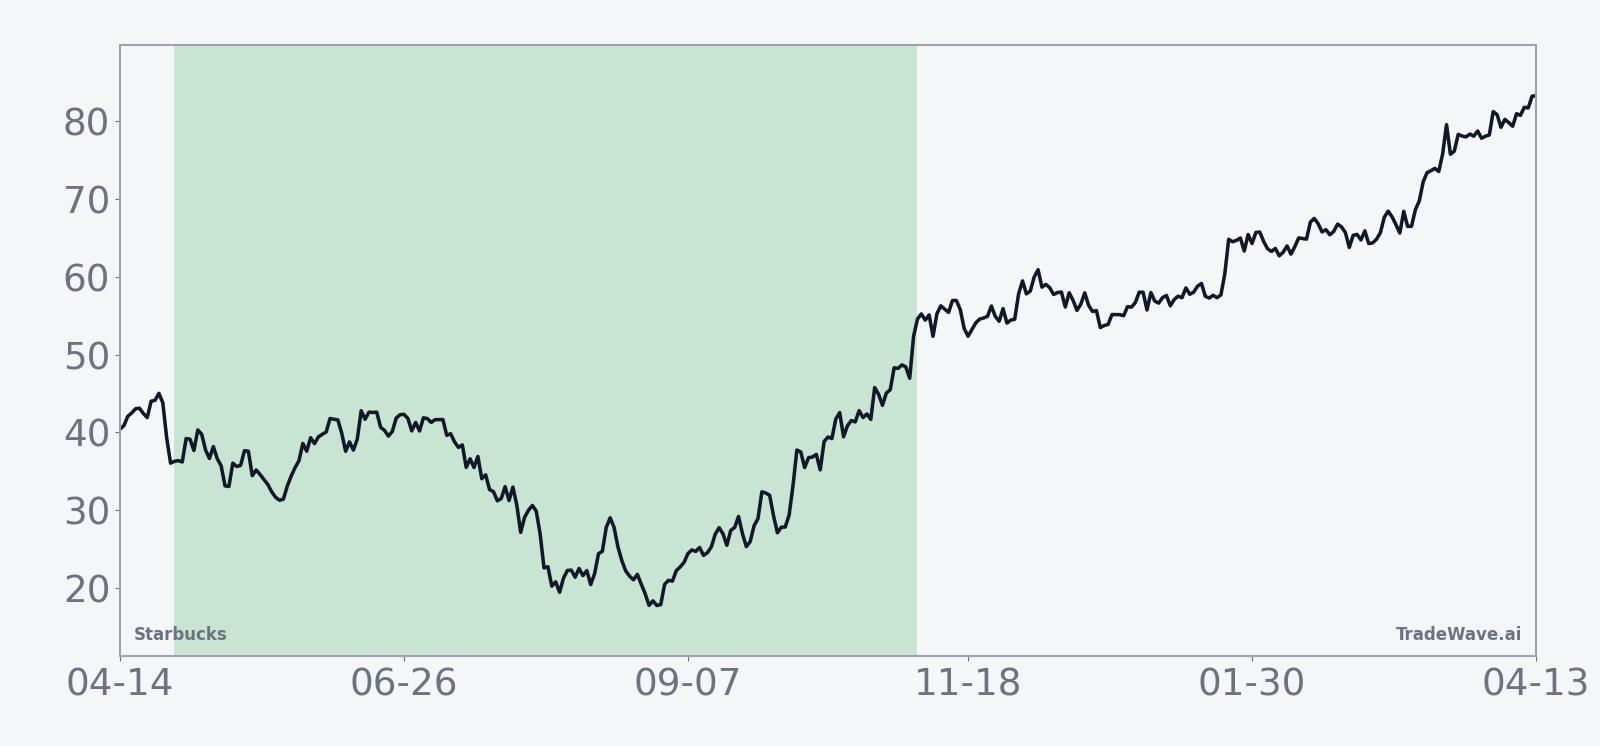
The historical seasonal trend chart shows a fairly steady upward slope rather than a single burst. Gains tend to build over the life of the 192-day window, with some acceleration in the middle portion that often lines up with late-summer and early-fall trading, then a flatter profile into the final weeks.
The next view layers in the best and worst intraperiod swings to show how far SBUX has typically run and how deep it has dipped inside this window.
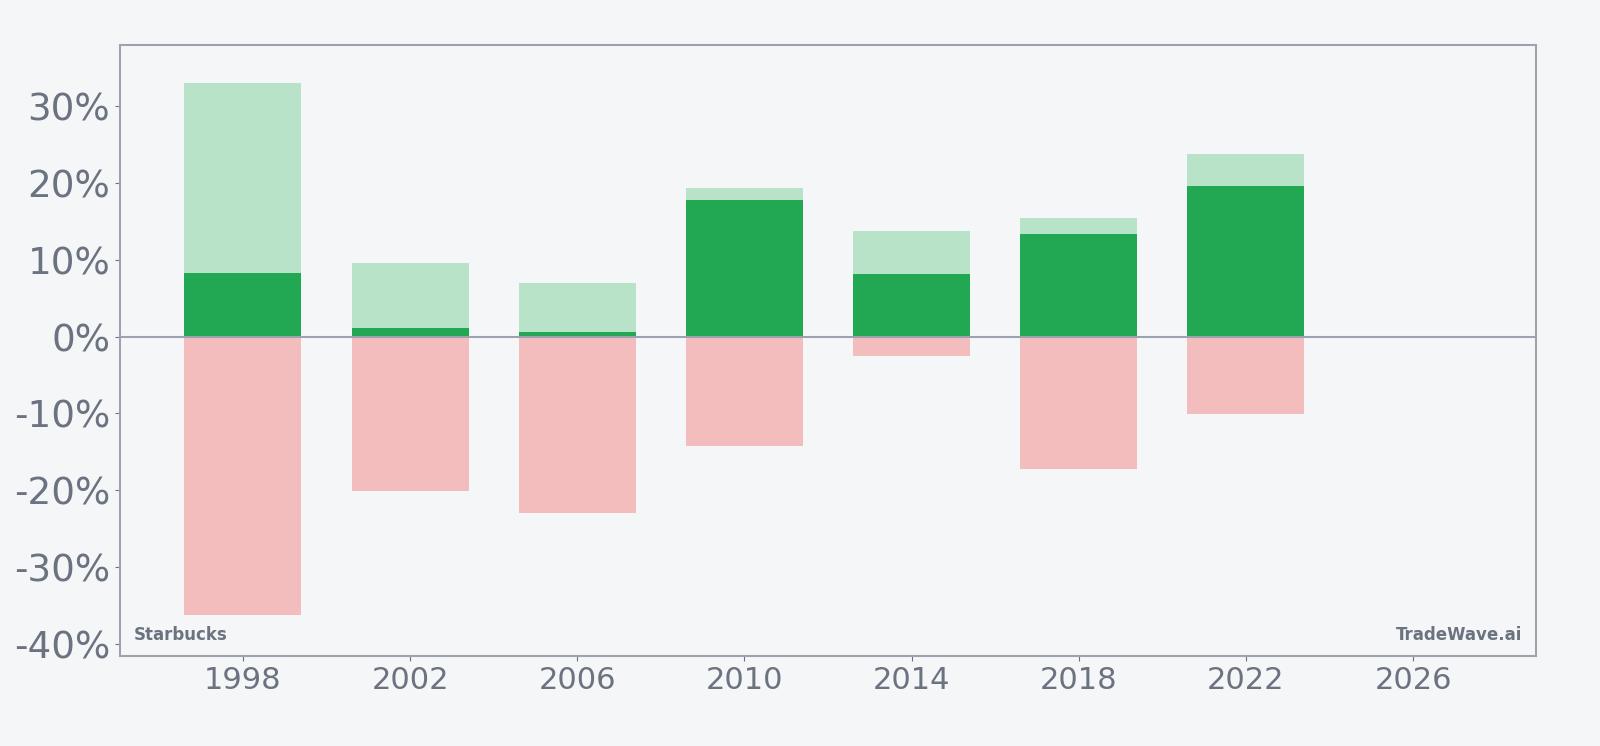
The stacked net, maximum favorable move and maximum adverse move bars show that even winning years have not been smooth. In 1998, for example, Starbucks finished the window up 8.32%, but at one point had rallied more than 33% from the entry and at another point had been down about 36% from that same entry. Other years like 2014 saw a much shallower worst drawdown of roughly 2.5%, which underscores how the volatility profile can vary from cycle to cycle even when the final outcome is positive.
The TradeWave Ratio of 1.72 captures that tendency for price to travel meaningfully in the trade direction within the window, while the Sharpe ratio of 1.03 points to a respectable risk-adjusted profile based on end-of-window results. Add it up: seven midterm-election-year windows, seven gains, and a history of sizable swings along the way.
History does not guarantee future results; adverse excursions can be large even in winning windows, and traders should treat this pattern as context rather than a forecast.
Why does Starbucks (SBUX) follow this seasonal pattern?
One likely driver is the way Starbucks’ fiscal calendar and earnings cadence line up with the midterm election year, clustering key reports and guidance updates inside this late-April to year-end stretch. Analysts have also pointed to consumer spending cycles, with summer travel, back-to-school and early holiday traffic all landing inside the window for a global coffee chain that leans on discretionary footfall.[2] The midterm policy backdrop can add another layer, as shifting expectations on tariffs and rates influence how investors price consumer-facing names like Starbucks.[10]
What is driving Starbucks (SBUX) today?
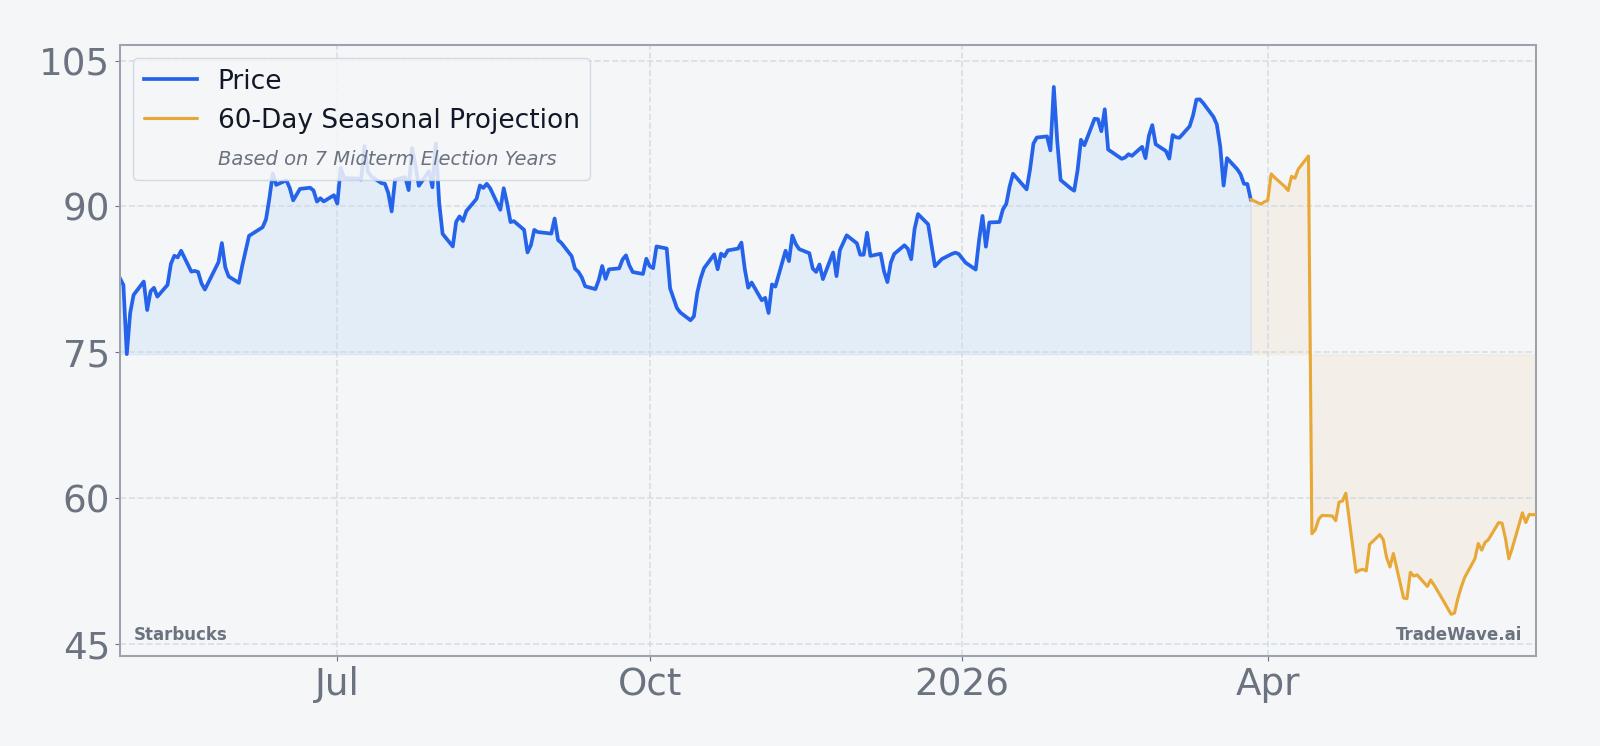
Starbucks closed Monday at 86.81, down 4.8% on the day, leaving the stock about 17.2% below its 52-week high of 104.82 and roughly 19.9% above its 52-week low of 72.43.[6] That pullback comes after a volatile turnaround stretch in which the company has alternated between disappointing and encouraging quarters as new CEO Brian Niccol pushes a “Better Starbucks” plan focused on a simplified menu and heavier investment in stores and staffing.[2][3][4][6][10][12]
The chart below situates the latest move in its recent multi-month context, alongside a short-term seasonal projection.
In Apr 2025, Starbucks delivered earnings that fell short of Wall Street forecasts, which weighed on sentiment and raised questions about domestic traffic and cost pressures.[1][12] By late Jul 2025, the narrative had shifted as the company beat revenue estimates on the back of China strength and early signs that the turnaround strategy was gaining traction, even though same-store sales still slipped 2% and EPS missed estimates due to one-off costs from a leadership conference.[2][4][9] Shares jumped in response, helped by optimism that operational investments and menu changes could restore growth momentum.[3][10]
Competition in China remains a key swing factor, with local rivals such as Luckin Coffee forcing Starbucks to sharpen pricing and promotions to defend share.[2] At the same time, tariffs and inflation have pressured consumer sentiment, pushing management to adjust strategy and messaging around value and experience.[10] Analysts covering the stock through 2025 framed Starbucks as a turnaround story with a Buy-leaning consensus, but with valuation and execution risk still front and center.[2][3][10][11][12]
More recently, in Jan 2026, Starbucks reported that U.S. and global same-store sales rose 4%, a sign that customers were returning and that the operational reset was starting to show up in the numbers.[6] That improvement came even as external pressures such as tariffs lingered, reinforcing the idea that the brand can still pull traffic when execution is tight.[6][10] Against that backdrop, the upcoming midterm-year seasonal window will intersect with a company that is still in the middle of a multi-quarter reset rather than cruising in a mature growth phase.
What should traders watch as this Starbucks seasonal window approaches?
The first marker is timing. The 192-day midterm-year window opens on Apr 28, so any shift in price behavior as that date approaches will be viewed against a backdrop where Starbucks has never posted a losing year in this slice of the calendar. Traders will be watching whether the stock stabilizes above the mid-80s or retests the low-70s band that defined the 52-week floor.[6]
Fundamentally, the next few earnings updates will be critical for confirming or challenging the historical pattern. If same-store sales growth holds near the 4% pace reported in Jan 2026 and China continues to contribute despite fierce competition, the seasonal tailwind could align with improving fundamentals.[2][4][6][9][10] A relapse in traffic or a renewed squeeze from tariffs and inflation would make the window more about volatility than clean upside.[6][10]
On the macro and policy side, midterm election years often bring shifting expectations around fiscal policy, trade and regulation, all of which can affect consumer discretionary names. Any fresh headlines on tariffs or broader consumer spending trends will matter for Starbucks, especially given its exposure to both U.S. and China demand.[2][6][10] Price action that respects the historical pattern by grinding higher through the middle of the window would reinforce the idea that this is a structurally supportive stretch, while a sharp break lower early in the window would be a clear departure from the last seven cycles.
Finally, traders should keep an eye on intraperiod swings, not just closing prices. Past midterm-year windows have seen Starbucks rally strongly at points and then give back large chunks of those gains before finishing higher, which means that drawdowns inside the window can be uncomfortable even when the final result is positive. If volatility spikes but the stock continues to make higher lows over the life of the window, that would be consistent with the historical pattern; a series of lower lows and failed bounces would signal that this cycle is writing a different script.
Sources
- CNBC, "Starbucks delivered earnings that disappointed Wall Street’s forecasts" (Apr 30, 2025).
- Reuters, "Starbucks CEO details brand reset plan as turnaround efforts drive sales beat" (Jul 29, 2025).
- Reuters, "Starbucks shares rise as CEO Niccol's turnaround efforts gain traction" (Jul 30, 2025).
- Reuters, "Starbucks beats revenue estimates on China strength, turnaround strategy" (Jul 29, 2025).
- The Wall Street Journal, "Starbucks Sales Jump as Coffee Customers Return" (Jan 28, 2026).
- CNBC, "Jefferies says sell Starbucks over high valuation" (Jul 17, 2025).
- CNBC, "Starbucks' earnings disappoint, but we're not giving up on the stock" (Apr 29, 2025).
About this seasonal analysis
Seasonal pattern data is sourced from TradeWave.ai, which analyzes historical price behavior across annual calendar windows going back up to 30 years. Read the full data methodology or the book The 100-Year Pattern by Afshin Moshrefi (2026 edition). Past performance of seasonal patterns does not guarantee future results. This article is for informational purposes only and does not constitute investment advice.