Nike, Inc. (NKE) Has Rallied in 9 of 9 Midterm Windows, Averaging 25.55% Gains
Nike, Inc. is reeling after weak guidance and China pressure, but an approaching late-April midterm-year seasonal window with a perfect win record sets up a sharp contrast for traders.

What is the seasonal pattern for Nike, Inc. (NKE)?
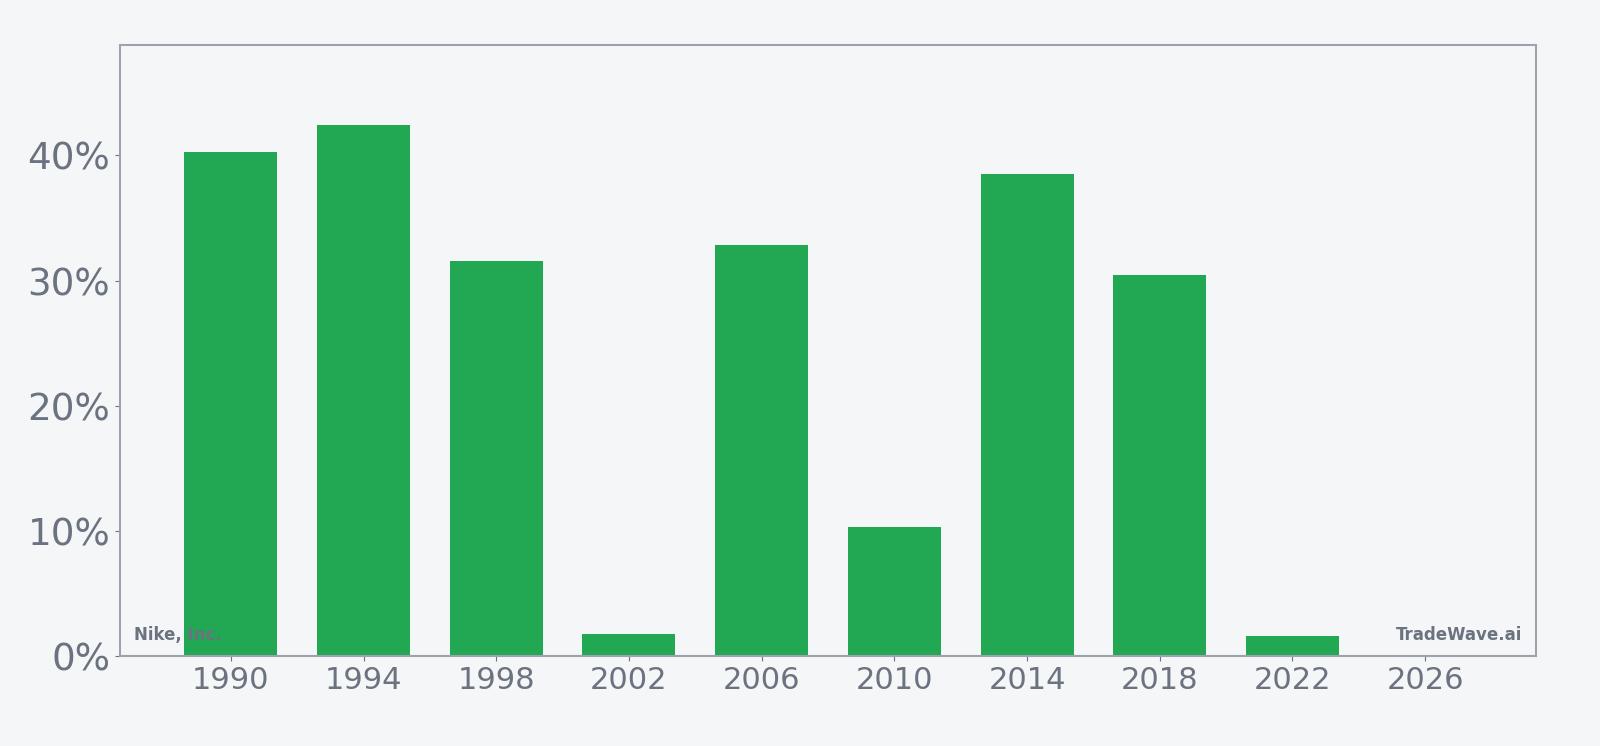
Nike, Inc. has risen in 9 of 9 midterm election years during this late-April-to-April window, with an average gain of 25.55% in winning years.
- 9 for 9 in this window, with Nike, Inc. averaging 25.55% gains in winning years across midterm election cycles.
- Seasonal window begins Apr 30, 2026 and runs 364 trading days, covering the late midterm year into the following pre-election year.
- Percent Profitable is 100%, with 9 winners and 0 losers in the historical sample.
- Trade Direction is long, supported by a TradeWave Ratio of 1.61 and a Sharpe ratio of 1.32 for end-of-window returns.
- Individual years have seen maximum favorable moves as high as 60.03% and adverse drawdowns as deep as -34.99% within the window.
- Cumulative return across the nine midterm-year windows totals 620%, underscoring how powerful this specific Nike, Inc. trading window has been historically.
According to historical data from TradeWave.ai, Nike’s behavior around late April in midterm election years has not looked like an average year. The next section walks through how that election-cycle seasonal pattern lines up with today’s selloff and macro backdrop.
How has Nike, Inc. (NKE) traded in this midterm-year seasonal window?
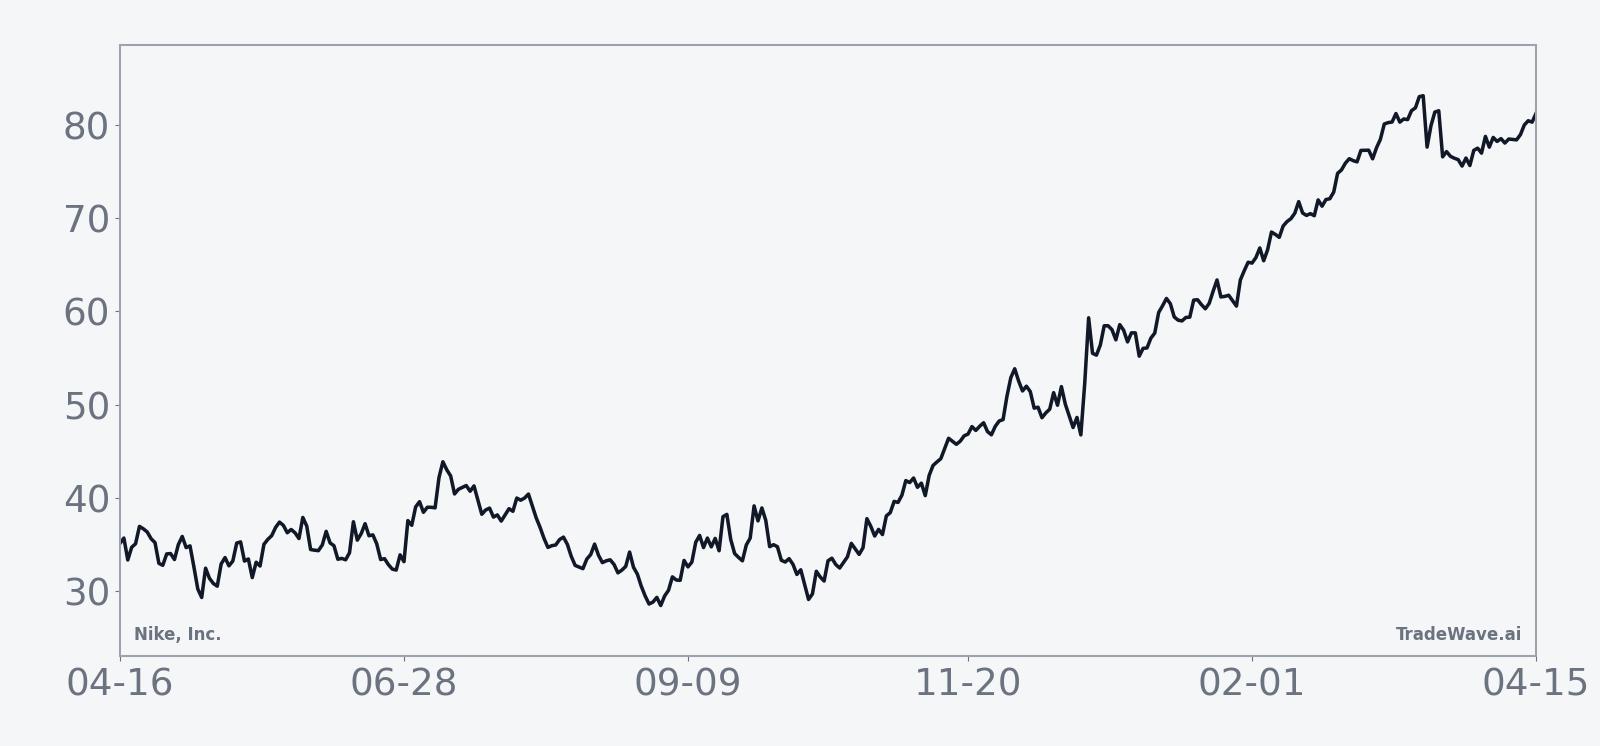
Nike, Inc. has risen in all 9 midterm election years during this 364-day window starting on Apr 30, averaging 25.55% gains and delivering a 620% cumulative return across cycles. The stock closed Thursday at 44.63 after a 15.5% one-day drop, leaving it about 43.0% below its 52-week high of 78.31 and well under its 50-day moving average of 59.69. That clash between a bruised price and a historically strong Nike, Inc. seasonal trend is what has traders’ attention as the next midterm-year window approaches.
Because this pattern is grouped by the presidential election cycle, it focuses only on midterm election years, which often feature tighter fiscal policy debates, tariff noise and choppy consumer sentiment. For a global consumer brand like Nike, that combination has historically lined up with a powerful late-midterm to pre-election-year recovery window rather than a straight-line trend across all years.
A second view layers each year’s best and worst intraperiod swings on top of those net results.
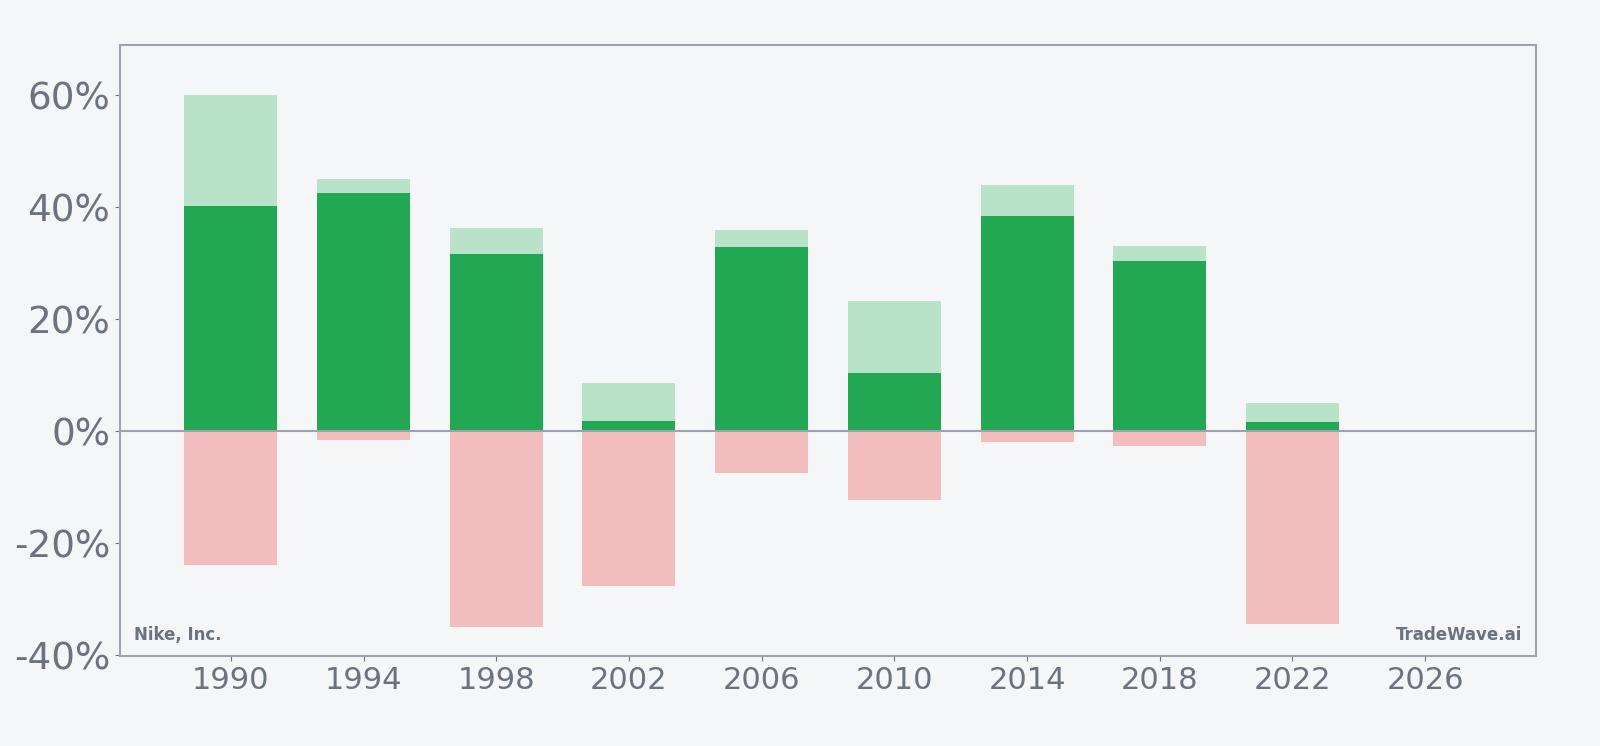
Across the nine midterm-year samples, the strongest years such as 1990, 1994, 2006 and 2014 delivered net gains between roughly 32% and 42%, with maximum favorable moves up to 60.03% before the window closed. Even the softer years like 2002 and 2022 still finished positive, but they came with deep intraperiod drawdowns, including adverse moves of -27.57% and -34.44% from the entry level. That mix of large positive outcomes and sometimes violent downside swings is captured in the 1.61 TradeWave Ratio and a 16.4% standard deviation of returns, which together point to a high-energy but historically rewarding long setup.
The historical seasonal trend line slopes higher across most of the 364-day span, with gains tending to build rather than spike and fade. In several cycles, Nike saw early choppiness or even sharp selloffs inside the window before recovering to finish strongly, which matches the large negative maximum adverse moves in 1990, 1998, 2002 and 2022. Add it up: 9 for 9 with a 25.55% average gain and 620% cumulative return is a rare profile for a mega-cap consumer stock in a single election-cycle slice.
History does not guarantee future results; adverse excursions (MAE) can be large even in winning windows.
Why does Nike, Inc. (NKE) follow this seasonal pattern?
One likely driver is the way Nike’s fiscal calendar and product cycle line up with the broader presidential election cycle, with midterm years often marking reset periods before demand and marketing spend ramp into the following pre-election year. Analysts have also pointed to portfolio rebalancing and sector rotation around midterm volatility, which can leave high-quality consumer brands like Nike as beneficiaries once policy uncertainty eases. The pattern may also reflect recurring back-to-school and holiday demand strength that compounds over a full year starting in late spring, especially when starting from depressed sentiment.
What is driving Nike, Inc. (NKE) today?
Nike shares collapsed 15.5% on Thursday to 44.63 after the company guided for fiscal fourth-quarter revenue to fall 2% to 4%, flagging ongoing weakness in Greater China and the costs of its “Win Now” restructuring push.[1] The stock has slid 11.06% over the past month and now trades well below its 50-day moving average of 59.69, underscoring how quickly sentiment has flipped from hopes of a margin inflection to concern about demand and tariffs.
The latest guidance follows a stretch in which Nike’s fiscal second-quarter revenue and earnings beat expectations but still showed gross margin pressure and a sixth straight quarter of declining China sales, and fiscal 2026 third-quarter commentary pointed to continued softness in the region.[1] Management’s plan centers on refocusing on core sports franchises, wholesale partners and marketing to clear aging inventory and reignite demand, but the near-term message is one of slower top-line growth while that “Win Now” strategy plays out.[4]
Analysts responded on Apr 1, 2026 by cutting price targets and stressing that the recovery path looks uneven, even as they kept an eye on potential long-term margin improvement if Nike can execute on cost controls and product refreshes.[5] That leaves the stock in a classic tug-of-war: a bruised chart and cautious near-term outlook on one side, and a still-supportive longer-term fundamental story on the other, especially if China stabilizes and global consumer demand firms.
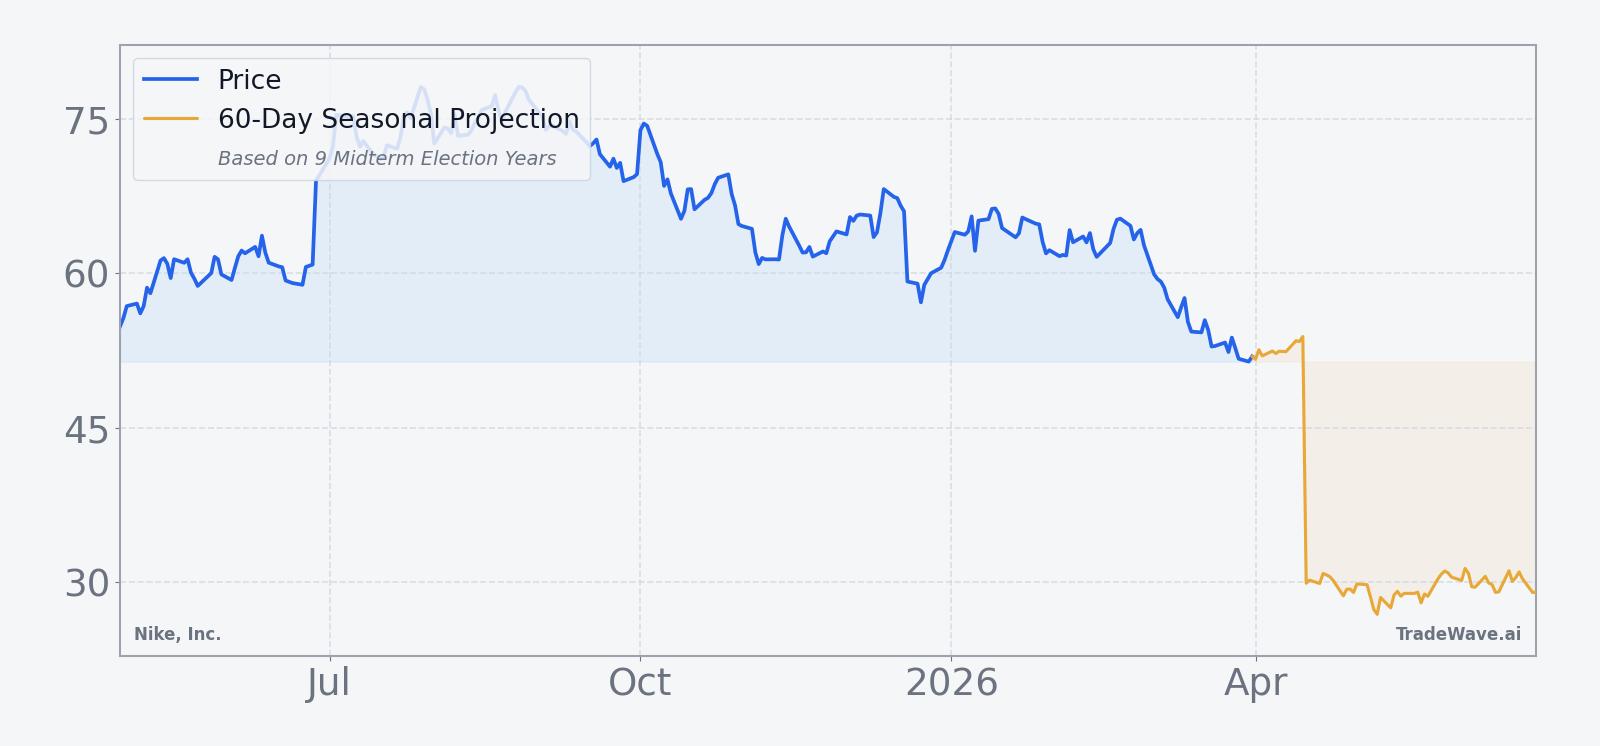
The chart below situates the latest move in its recent multi-month context, alongside a 60-day seasonal projection.
What should traders watch as this Nike, Inc. seasonal window approaches?
First, the calendar: the next iteration of this midterm-year Nike, Inc. trading window opens on Apr 30, 2026 and runs for 364 trading days, carrying through into the following pre-election year. Historically, that span has been one of the strongest on Nike’s seasonal map, but the path has rarely been smooth, with several years showing double-digit drawdowns before finishing higher.
Second, watch how the stock behaves around key fundamental checkpoints, especially any updates on China demand, tariff exposure and the pace of the “Win Now” reset.[1][4] If the stock can stabilize above the post-guidance lows and start to reclaim moving averages as those headlines land, that would rhyme with prior midterm-year windows where Nike shook off early weakness and then trended higher. A failure to hold recent lows, by contrast, would mark a clear break from the historical seasonal pattern and signal that macro and company-specific pressures are overwhelming the usual election-cycle tailwind.
Finally, positioning and sentiment will matter. The last time a high-profile insider stepped in, when Tim Cook increased his Nike stake in late 2025, the stock briefly jumped as investors took the move as a vote of confidence during a slump.[3] Any renewed insider buying, or a visible shift in analyst tone from “wait and see” to “lean in,” would be a sign that the market is starting to treat this selloff as an entry point rather than the start of a new downtrend, which would align more closely with Nike’s historical midterm-year seasonal trend.
Sources
About this seasonal analysis
Seasonal pattern data is sourced from TradeWave.ai, which analyzes historical price behavior across annual calendar windows going back up to 30 years. Read the full data methodology or the book The 100-Year Pattern by Afshin Moshrefi (2026 edition). Past performance of seasonal patterns does not guarantee future results. This article is for informational purposes only and does not constitute investment advice.