Despite Upbeat Outlook, Williams-Sonoma, Inc. (WSM) Near Highs Faces May Downside Risk
Williams-Sonoma, Inc. is heading into a short May seasonal window that has favored the short side in most of the past decade, even as the stock trades near recent highs.

What is the seasonal pattern for Williams-Sonoma, Inc. (WSM)?
Williams-Sonoma, Inc. has fallen in 9 of 10 years during this mid-May 12-day window, with an average gain of 6.45% in winning short years.
- 9 for 10 in this window, with short positions averaging 6.45% gains in winning years.
- The 12-day trading window begins May 10 and has been profitable for shorts in 90% of the past 10 years.
- Percent Profitable stands at 90%, with 9 winning years and just 1 losing year across the sample.
- Average Profit - All years, including the lone loser, is still a strong 6%, pointing to a persistent bearish seasonal bias.
- Intraperiod swings have been meaningful, with some years showing double-digit favorable moves for shorts alongside notable adverse bounces.
- Cumulative return across the decade-long sample is 73% for the short side, highlighting how this specific May window has repeatedly pressured WSM shares.
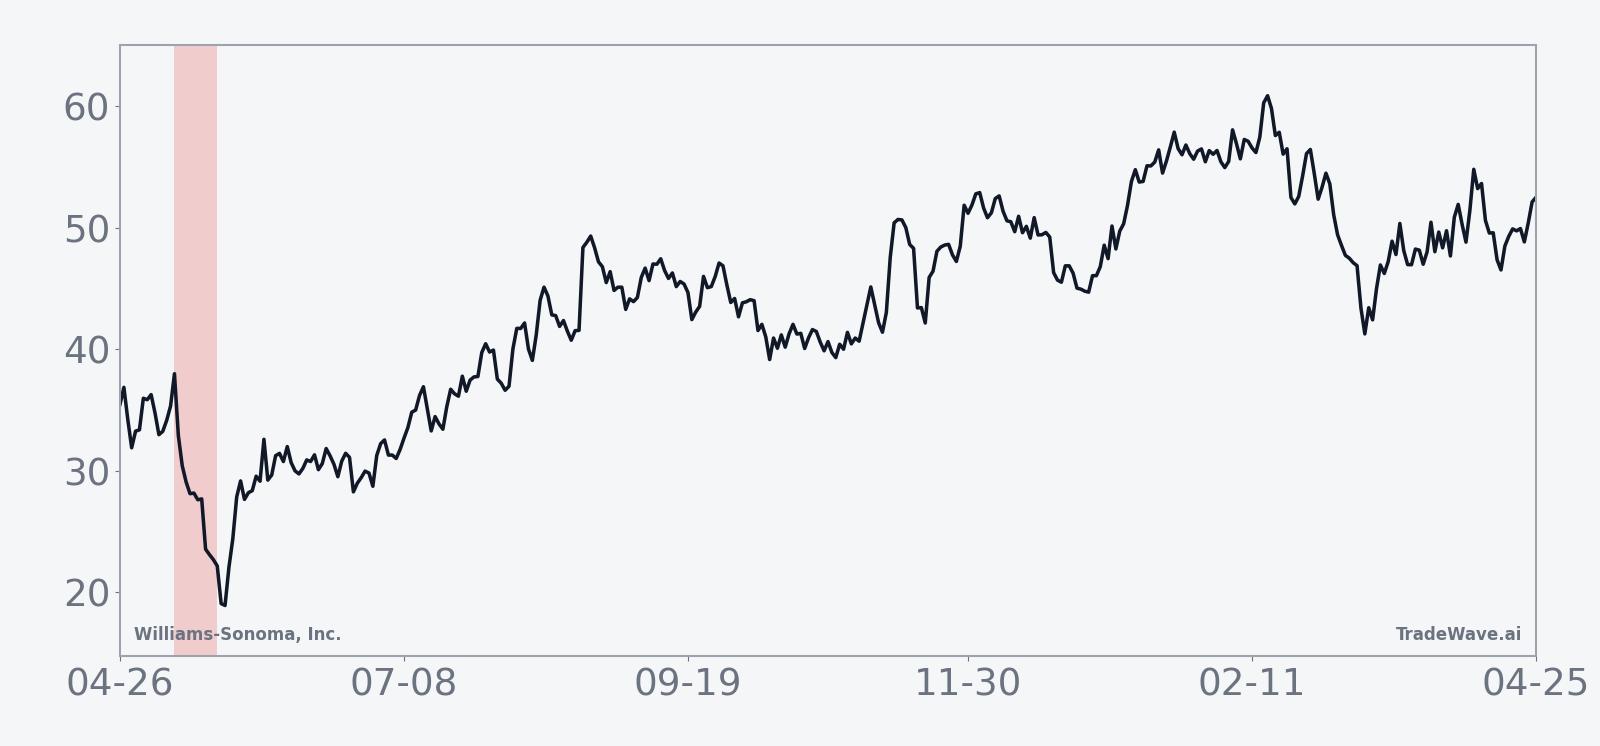
According to historical data from TradeWave.ai, this upcoming stretch in May has behaved very differently from an average month on the calendar for Williams-Sonoma, Inc., and the next iteration of that pattern is just days away.
How has Williams-Sonoma, Inc. (WSM) traded in this May seasonal window?
Williams-Sonoma, Inc. has delivered profitable short-side results in 9 of the past 10 years during the 12-day window that starts on May 10, with winning shorts averaging 6.45% gains and a 6% average across all years. The stock last closed at 187.69, up 4.1% on the day and sitting about 15.5% below its 52-week high of 222.00, after a choppy month that left it roughly flat over the past 30 days.
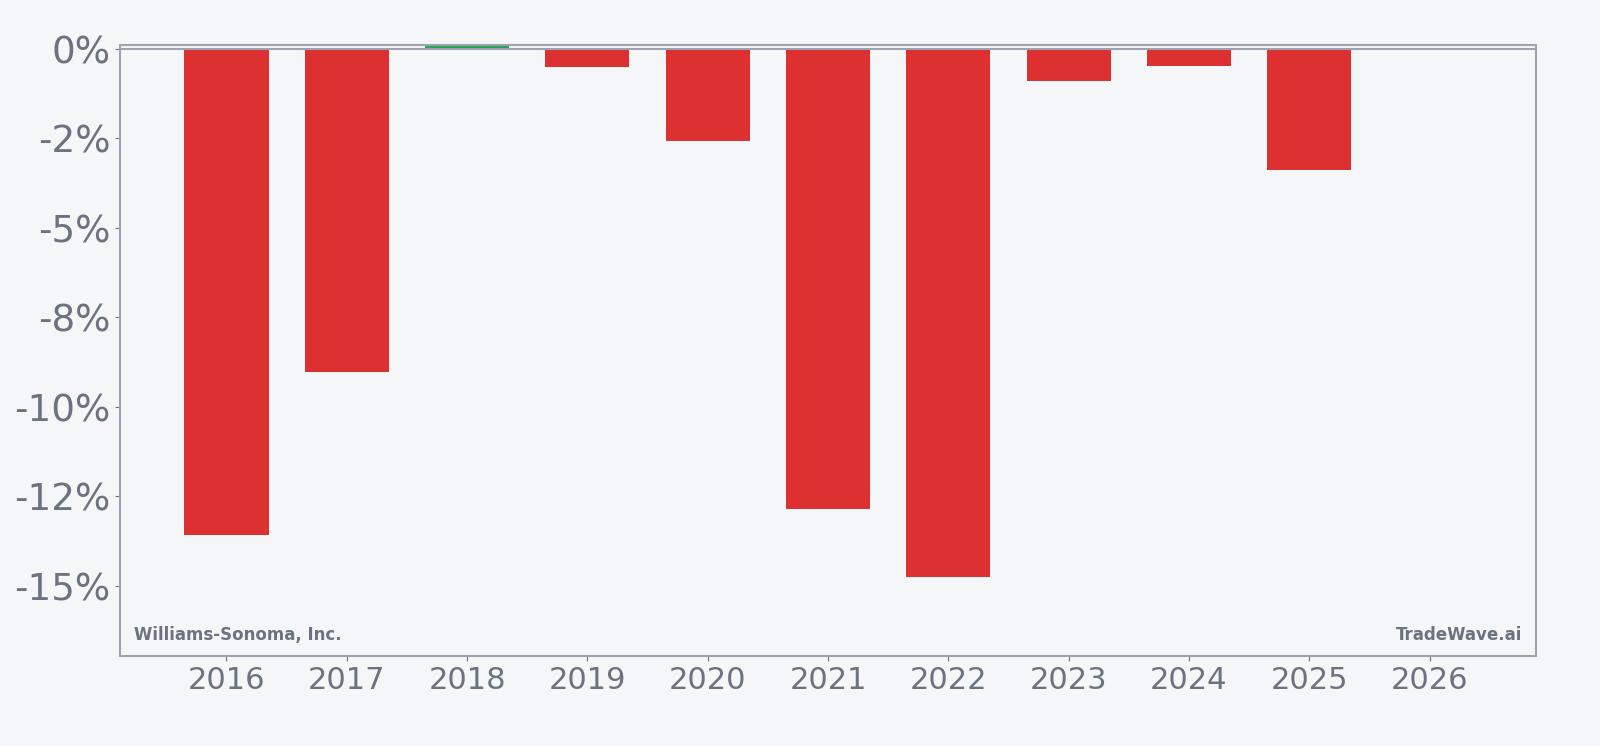
Year-by-year net returns and intraperiod swings show how often this May window has leaned lower for WSM.
The trade direction for this pattern is explicitly short, and the track record is unusually one-sided: 9 winners against just 1 loser over the past decade, for a 90% success rate. In winning years, shorts have captured an average move of 6.45%, while including the lone losing year still leaves a 6% average across all outcomes. That combination of a high hit rate and only modest dilution from the loser is what makes this WSM seasonal trend stand out.
The per-year breakdown shows that the strongest short years were 2016, 2021 and 2022, when net returns in the window ranged from about 12.9% to 14.8% in favor of the short side. The weakest outcome for shorts came in 2018, which finished essentially flat at 0.1% against the trade direction, despite an intraperiod rally that briefly pushed more than 3% against shorts before fading back toward the entry level. That kind of behavior is typical of this window: even in years that end up working for the short side, WSM has often staged countertrend bounces inside the 12-day span.
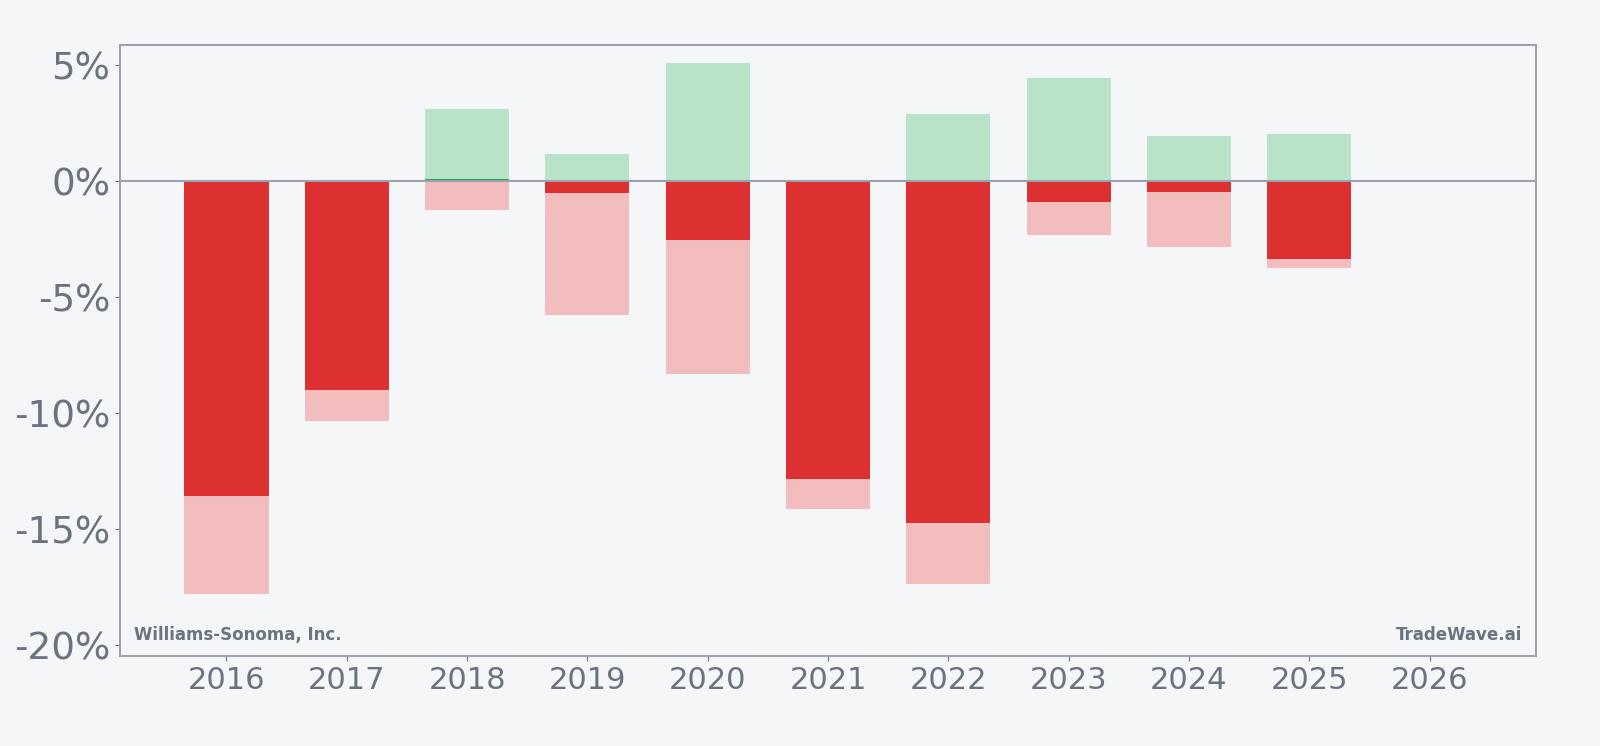
Looking at intraperiod behavior, the maximum favorable move for shorts has at times been dramatic. In 2016 and 2022, for example, the best point-to-trough moves inside the window reached roughly 13% to 15% in the trade direction, while the worst drawdowns from entry (the maximum adverse excursion) stretched to around 17% in those same years. In other words, the window has historically offered both sizable downside follow-through and sharp interim rallies, underscoring that this is a high-variance stretch rather than a slow drift lower.
The ten-year average seasonal trend line suggests that, on balance, the bulk of the short-side gains have tended to accrue in the middle of the window rather than on day one. Early days often show noise or small countertrend moves, followed by a more decisive push lower that has historically driven most of the net return. The cumulative return profile across the decade, which sums each year’s outcome, climbs steadily in favor of the short side and reaches a 73% total gain, signaling that this is not just a one-off anomaly but a recurring pattern in the Williams-Sonoma, Inc. trading window around mid-May.
History does not guarantee future results; adverse excursions can be large even in winning windows, and shorts in this pattern have at times faced double-digit rallies before the trade moved back in their favor.
Why does Williams-Sonoma, Inc. (WSM) follow this seasonal pattern?
This May seasonal pattern for Williams-Sonoma, Inc. may reflect how investors position around the company’s fiscal-year cadence and the broader home-furnishings demand cycle. One likely driver is portfolio managers trimming exposure after strong early-spring runs as they reassess consumer spending on big-ticket home goods heading into summer. The pattern could also tie into sector rotation, with capital shifting from specialty retail into travel, leisure and other warm-weather themes just as this 12-day window opens.
What is driving Williams-Sonoma, Inc. (WSM) today?
Williams-Sonoma, Inc. shares closed at 187.69, up 4.1% on the day, after trading between 182.95 and 188.64 on volume of about 903,000 shares, roughly in line with the 20-day average of 911,774. The stock is about 15.5% below its 52-week high of 222.00 and roughly 30% above its 52-week low near 144.31, while the 50-day moving average sits modestly higher at 191.08, underscoring how the latest bounce comes in the context of a mild pullback from earlier highs.
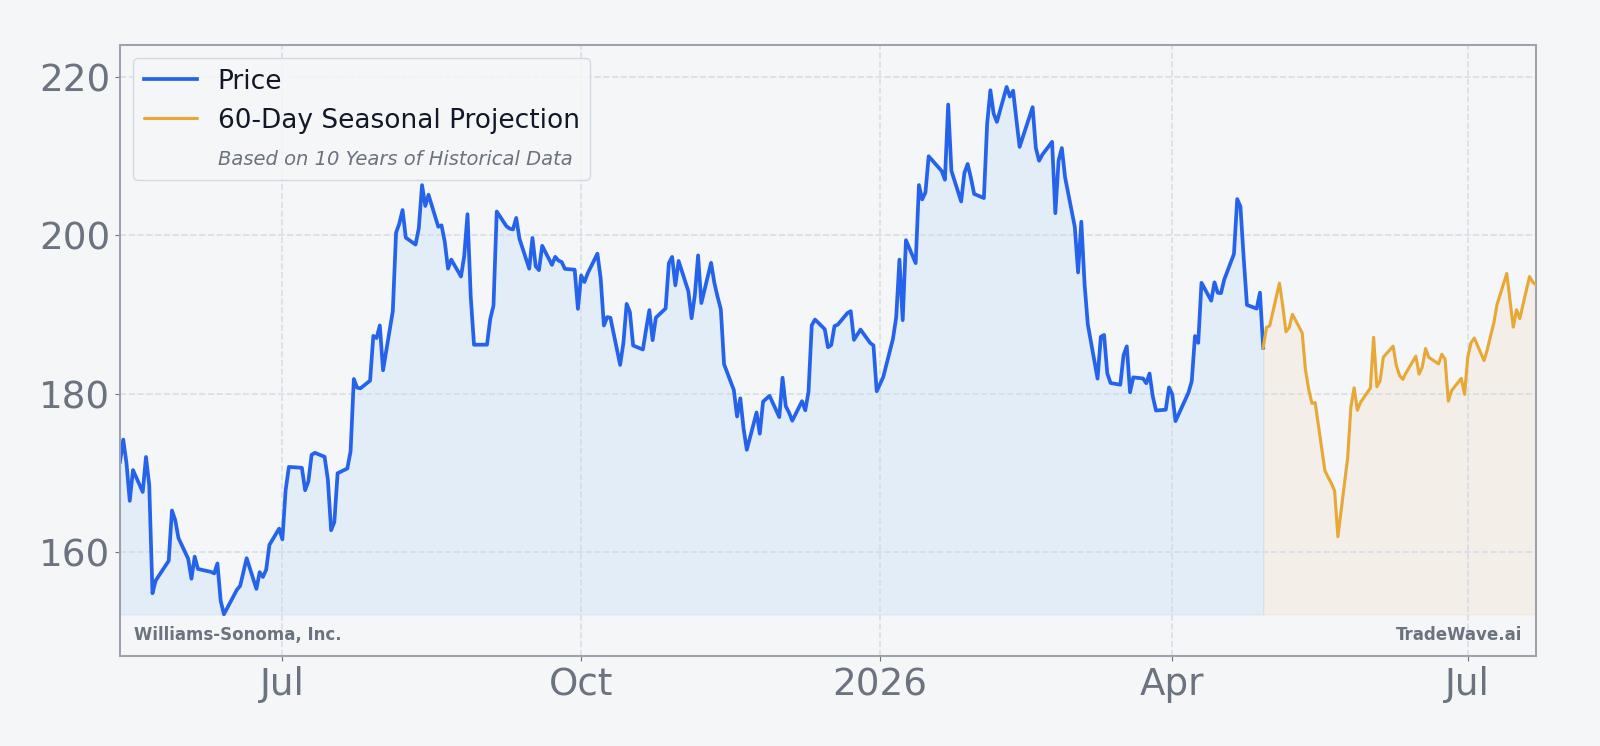
Fundamentally, the company is coming off a year in which comparable sales climbed 3.5%, outpacing the broader home-products industry, and management has guided to comparable sales growth of 2% to 6% in the year ahead amid what it calls a “dynamic” environment.[1] That backdrop helps explain why the stock has held near the upper end of its 12-month range despite a softer housing and furnishings backdrop, and it sets the stage for how traders may interpret any deviation from the historical seasonality as the next May window opens.
The chart below situates the latest move in its recent multi-month context and overlays the upcoming seasonal projection.
What should traders watch as this WSM seasonal window opens?
With Williams-Sonoma, Inc. approaching a historically weak 12-day stretch for the stock, the first thing to watch is how price behaves relative to the 50-day moving average around 191. A failure to reclaim that level as the window opens would be more consistent with the past decade’s bearish seasonal pattern, while a decisive break above it would be an early sign that this year may diverge from history. Intraday, traders will be watching whether early strength in the window tends to fade, as it often has in prior years, or whether dip buyers step in more aggressively than usual.
Second, monitor volatility and the size of intraperiod swings. Historically, some of the best short years in this window have also featured large countertrend rallies before the downside resumed, so a sharp bounce does not automatically invalidate the pattern. Instead, the key tell will be whether those rallies stall below recent highs and roll back over within the 12-day span, echoing the typical WSM seasonal trend, or whether they extend into a sustained breakout that overwhelms the historical bias. Finally, keep an eye on any company commentary or macro data that could shift the home-furnishings sector outlook; a material change in demand expectations could either reinforce the usual May softness or provide the catalyst for a rare upside break against this long-running seasonal record.
Sources
About this seasonal analysis
Seasonal pattern data is sourced from TradeWave.ai, which analyzes historical price behavior across annual calendar windows going back up to 30 years. Read the full data methodology or the book The 100-Year Pattern by Afshin Moshrefi (2026 edition). Past performance of seasonal patterns does not guarantee future results. This article is for informational purposes only and does not constitute investment advice.