Earnings Pop for Intel (INTC) Runs Into Weak Midterm Stretch Where Shorts Have Often Won
Intel is trading near record highs after a blowout earnings beat, but an early midterm-year seasonal window that has historically favored short setups opens in mid-May.
What is the seasonal pattern for Intel (INTC)?
Intel has fallen in 6 of 7 midterm-year May windows during this 7-day stretch, with an average gain of 4.37% in winning years for the short setup.
- 6 for 7 in this window for the short side, with Avg Profit of 4.37% in winning years and 4% when including all years.
- The upcoming Intel trading window runs from May 14 through May 22, covering 7 trading days in early midterm election years.
- Percent Profitable is 86%, with 6 winners and 1 loser for the short-biased pattern across the last 7 midterm election years.
- Avg Profit reflects only the profitable short years, while Avg Profit - All folds in the lone losing year to show the full-seasonal picture.
- Historical intraperiod swings have included sharp adverse moves, with the worst year showing a drawdown of more than 9% before finishing lower.
- The pattern’s TradeWave Ratio of 1.77 and Sharpe ratio of 1.09 point to a historically efficient short window, but with meaningful volatility inside the range.
According to historical data from TradeWave.ai, this specific mid-May stretch in midterm election years has behaved very differently from an average week for Intel, and the next iteration is less than three weeks away.
How has Intel (INTC) traded in this mid-May midterm-year window?
Intel has fallen in 6 of the last 7 midterm election years during the 7 trading days starting May 14, in a pattern that has historically rewarded short positions. Shares closed Monday at 82.54, up about 120% year to date and roughly 3.1% below their 52-week high of 85.22, leaving the stock stretched into the window after a powerful run.[2]
The presidential election cycle matters here because this pattern only looks at midterm election years, a phase that has often brought choppier trading for cyclicals even when the broader pre-election year that follows tends to be stronger. Pattern phase is midterm election year, while the calendar is still in the year after the presidential election, so the upcoming May window is effectively a preview of how Intel has behaved in past midterm springs.
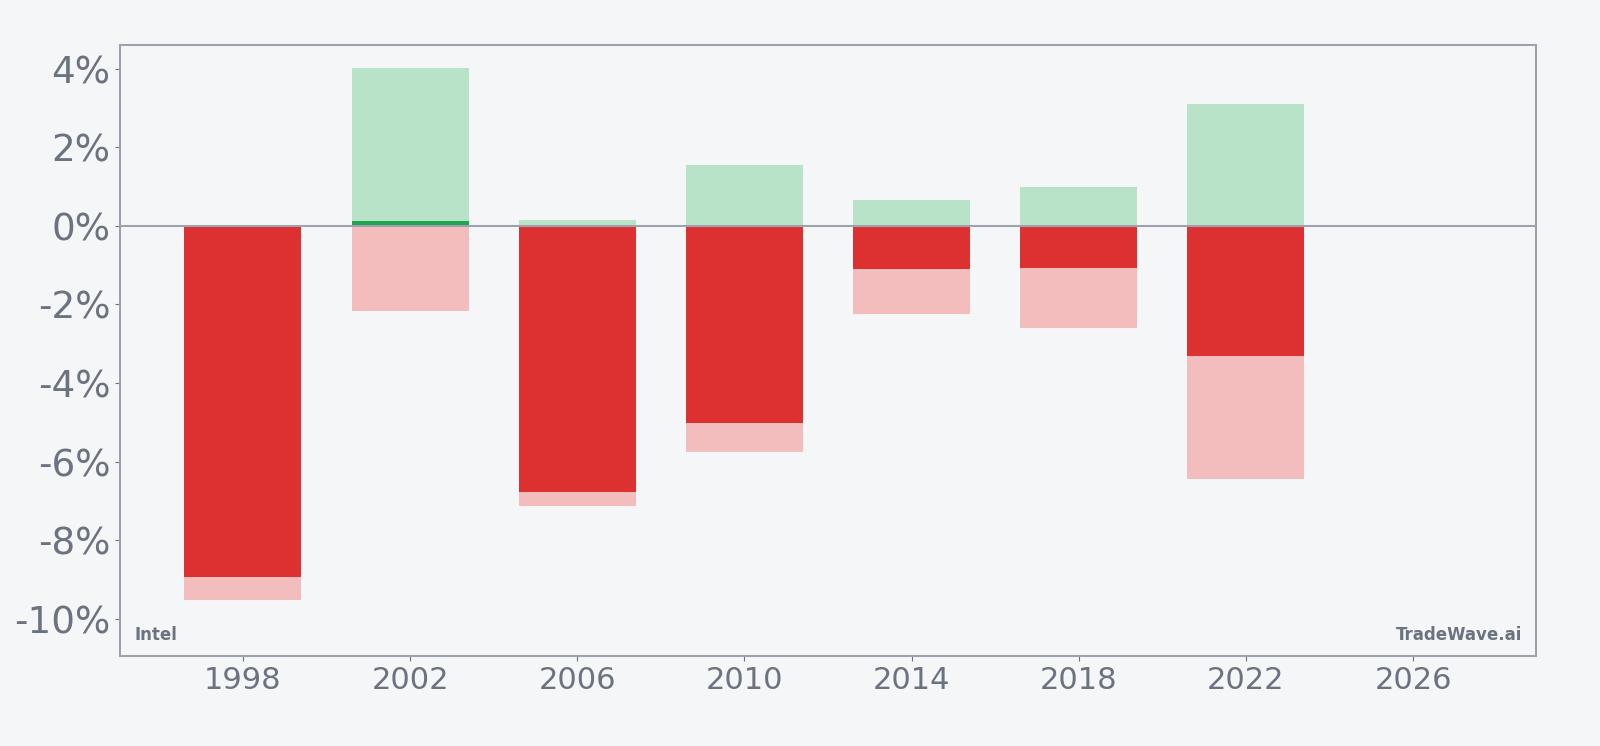
A stacked view of net returns alongside best and worst intraperiod swings shows how far Intel has tended to move inside this short window.
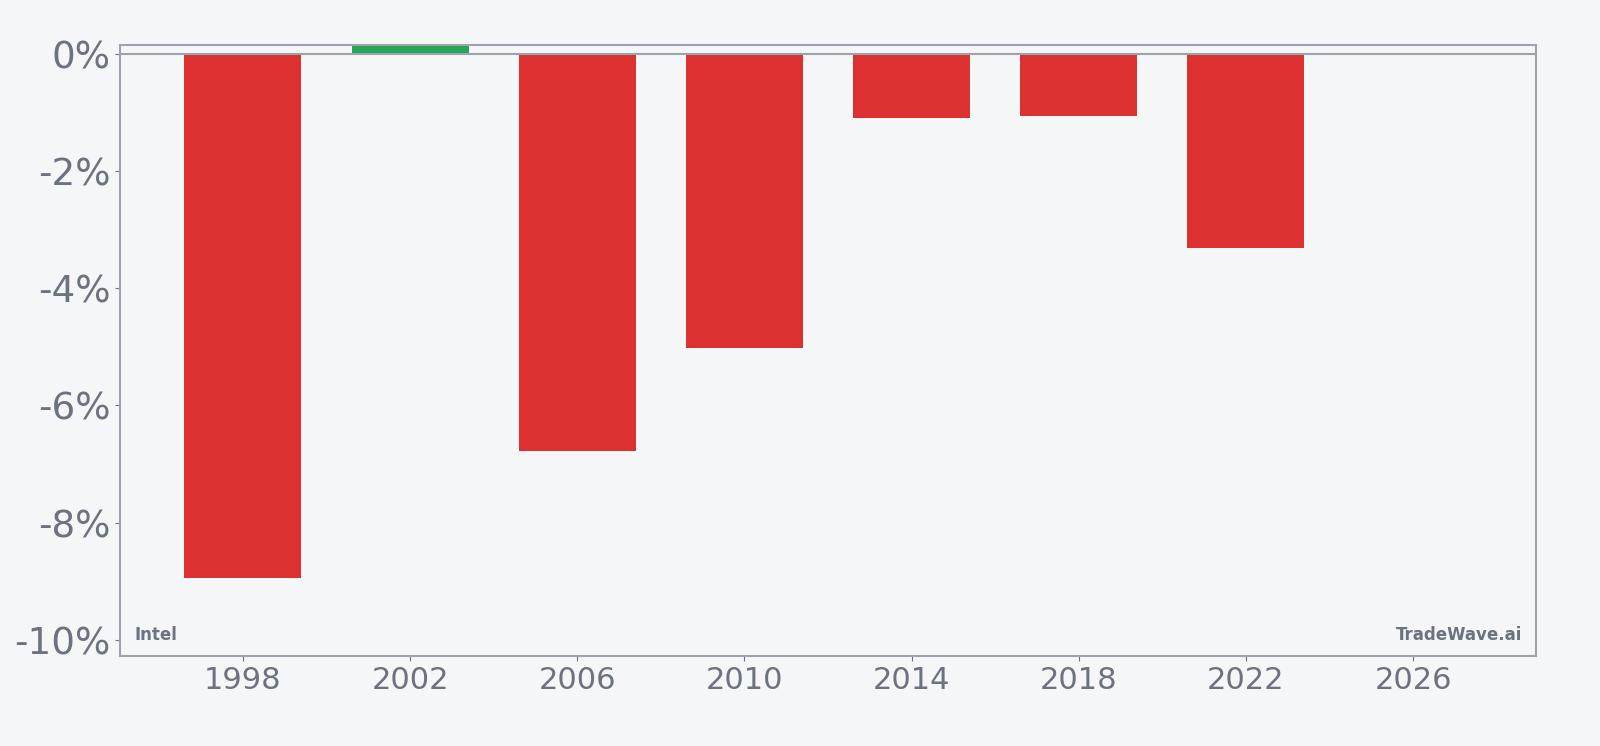
Across the seven midterm-year samples, the short side has been favored: 6 winners and 1 loser, with Percent Profitable at 86% and Avg Profit of 4.37% in the winning years. When the lone losing year is included, Avg Profit - All still comes in at 4%, which is unusually strong for such a tight 7-day Intel trading window. For a short-biased pattern, those numbers mean that in most midterm cycles, the stock has drifted or broken lower during this slice of May rather than squeezing higher.
The per-year table shows 1998 as the toughest year for shorts, with a net return of -8.94% for Intel and a worst intraperiod drawdown of -9.53% from the entry, even though the maximum favorable move during that window was only -1.55%. In other words, that year delivered a deep adverse excursion before the short ultimately finished in the money, a reminder that even “good” years for the pattern have demanded strong risk tolerance. By contrast, 2002 stands out as the weakest iteration for the short setup, with a small 0.13% loss and a maximum favorable move of 4.01%, showing that the stock did briefly move in the trade direction before reversing.
The maximum favorable move and maximum adverse move profile across years underlines the volatility inside this Intel seasonal trend. Several years show maximum adverse moves between roughly -5% and -7% even when the final net result was a profitable short, which means traders leaning into the pattern historically had to sit through sizable rallies before the stock rolled over. At the same time, the TradeWave Ratio of 1.77 indicates that, on average, price has traveled meaningfully in the trade direction within the window, not just drifted sideways.
The historical seasonal trend chart suggests that weakness has often emerged early in the 7-day span, with the average path bending lower rather than grinding flat. The cumulative return line for the window slopes down across the sample, consistent with the 28% cumulative return figure for the short setup over the last seven midterm election years. Add it up: this has been a compact but consistently negative Intel seasonal window for longs, and a favorable one for shorts, in prior midterm cycles.
History does not guarantee future results; adverse excursions can be large even in winning windows, and the worst drawdowns have come in years that ultimately finished profitable for the short side.
Why does Intel (INTC) follow this seasonal pattern?
This mid-May Intel seasonal pattern may reflect a mix of earnings-calendar digestion and institutional portfolio repositioning around midterm-year policy risk. One likely driver is that investors often reassess chip exposure after the first-quarter earnings season, especially when guidance and capital spending plans collide with shifting fiscal and regulatory signals. In midterm election years, that reassessment has sometimes translated into short-term profit taking in high-profile semiconductor names like Intel, which shows up as a short-friendly window in the historical data.
What is driving Intel (INTC) today?
Intel’s seasonal setup is colliding with a stock that has already gone vertical. Shares closed at 82.54 after a 23.6% single-session jump on Apr 24, leaving the stock up about 120% year to date and just about 3.1% below a new 52-week high of 85.22 after a blowout first-quarter earnings beat and bullish AI commentary.[2][4] The move came on a 28% surge in trading volume as investors rushed into the name following results that topped expectations on both earnings and revenue and highlighted 22% growth in data center revenue tied to AI demand for CPUs.[4]
On Apr 24, Intel reported first-quarter EPS of 29 cents versus a 1 cent estimate and revenue of 13.58 billion dollars versus expectations of 12.42 billion dollars, with management pointing to strength in data center and AI businesses and guiding second-quarter revenue to a range of 13.8 billion to 14.8 billion dollars and EPS of 9 cents.[2][4] The beat and guidance prompted at least two Wall Street firms to reiterate or initiate buy ratings, even as the broader analyst community remains at a Hold consensus with a legacy price target of 45 dollars from LSEG that now sits far below the current share price and reflects an earlier price regime.[1][2][7] The options market has also been leaning bullish, with prior options data pointing to potential upside toward and beyond the 45 dollar area, a level Intel has now decisively cleared.[8]
Macro and policy context are adding fuel. Intel is benefiting from its status as the only U.S.-based leading-edge chip maker, a position that has attracted federal alliances and strategic investment interest from peers like Nvidia, reinforcing the narrative that the company sits at the center of U.S. semiconductor and AI industrial policy.[2][3][9] That backdrop has helped the stock become a key sentiment driver for both the semiconductor sector and the broader market, with recent rallies in Intel contributing to index futures strength around major macro data releases.[11]
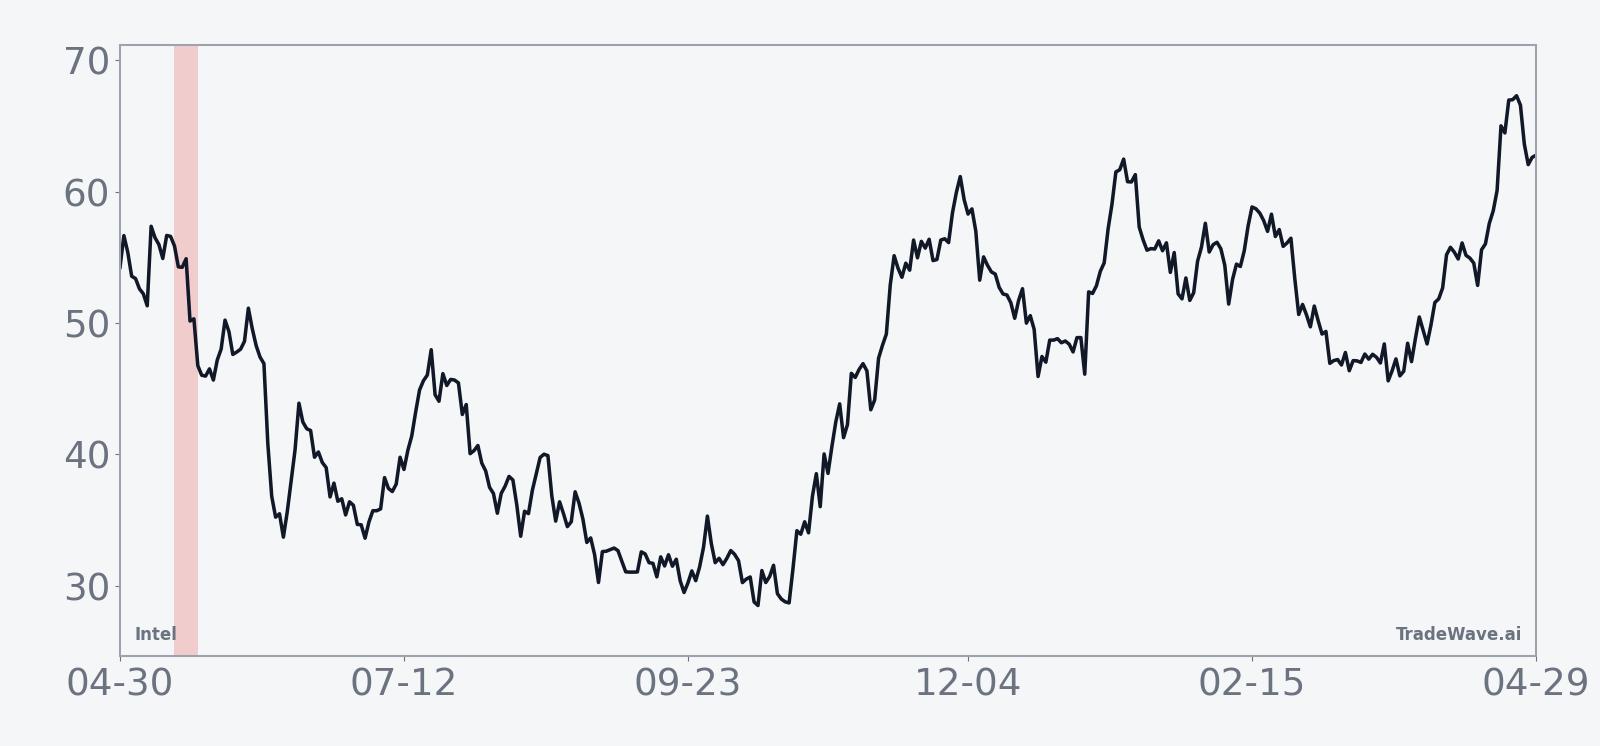
The chart below situates the latest move in its recent multi-month context and overlays a 60-day seasonal projection.
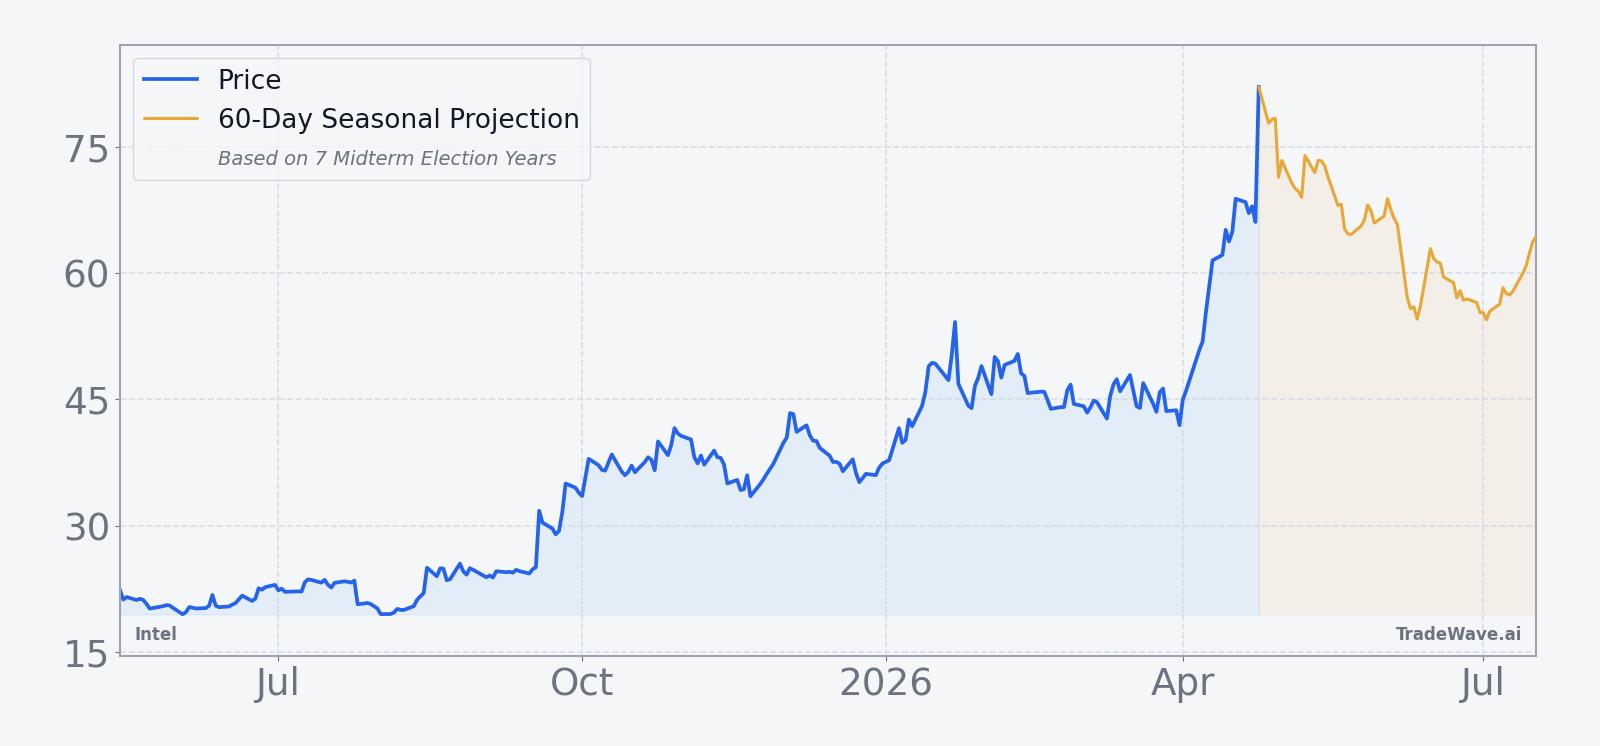
Intel remains in a powerful bullish trend and is once again a major swing factor for semiconductor indices and the broader S&P 500. Even so, the historical midterm-year seasonal pattern flags a short-biased window in mid-May that has repeatedly seen the stock give back some ground. Because Intel is a high-profile AI and data center play, any volatility during that period has the potential to ripple through related chip names and AI-linked ETFs, especially if intraperiod drawdowns resemble the deeper adverse moves seen in years like 1998.
What should traders watch as the Intel (INTC) seasonal window opens?
Three things will matter as the May 14 seasonal window approaches. First, watch whether Intel can hold above the 80 to 85 dollar band that has defined the post-earnings surge; a decisive break lower inside the 7-day window would be consistent with the historical short-friendly pattern, while a squeeze to fresh highs would look more like the lone losing year in the sample.[2][4] Second, monitor options flow and volume: if the elevated post-earnings activity and bullish positioning continue to build into mid-May, any reversal could be sharper as crowded longs unwind, whereas a cooling of options enthusiasm would suggest the market has already digested the move.[4][8]
Third, keep an eye on the policy and macro calendar. Intel’s role in U.S. chip strategy means headlines around subsidies, export controls or AI infrastructure spending can quickly change sentiment, especially in the year after a presidential election as investors start to look ahead to the midterm policy landscape.[2][9] If the stock drifts sideways or grinds higher through the May 14 to May 22 window, it would mark a clear break from the historical Intel seasonal trend. If instead the stock sees a quick air pocket or a series of sharp intraday reversals during that stretch, it would fit the pattern of prior midterm-year windows where shorts have historically had the edge.
Sources
- CNBC, "Intel’s earnings beat couldn’t offset a weaker-than-expected outlook. Here’s what analysts are saying" (Jan 23, 2026)
- CNBC, "Intel is soaring after an earnings beat. These two Wall Street firms call the stock a buy" (Apr 24, 2026)
- Bloomberg, "Intel Faces High Earnings Bar as Stock Soars and Cash Pours In" (Oct 23, 2025)
- Business Insider, "Intel soars 28% to surpass dot-com record highs after blowout sales forecast" (Apr 24, 2026)
- Barron's, "Intel Stock Surges to 4-Year High Ahead of Earnings. Why Optimism Is Growing." (Jan 21, 2026)
- CNBC, "Intel stock pops double digits on Q1 earnings" (Apr 23, 2026)
- Barron's, "Intel Stock Can Gain Another 20%, Analyst Says. Here’s Why." (Apr 13, 2026)
- Barchart, "Intel Stock Pops on Estimate-Beating Q3. Options Data Tells Us INTC Could Be Headed Here Next." (Oct 24, 2025)
- Yahoo Finance, "Intel (INTC) Draws Strategic Nvidia Investment as Chip Testing Plans Shift" (Jan 03, 2026)
- Yahoo Finance, "Why Is Intel (INTC) Stock Soaring Today" (Jan 02, 2026)
- Reuters, "Wall St futures rise on Intel boost ahead of inflation data" (Oct 24, 2025)
- Seeking Alpha, "Intel looks to Apple as Tan seeks to bring shine back to chipmaker: report" (Sep 24, 2025)
- Seeking Alpha, "Intel, Nvidia deal may have implications for Astera Labs, Morgan Stanley says" (Sep 19, 2025)
About this seasonal analysis
Seasonal pattern data is sourced from TradeWave.ai, which analyzes historical price behavior across annual calendar windows going back up to 30 years. Read the full data methodology or the book The 100-Year Pattern by Afshin Moshrefi (2026 edition). Past performance of seasonal patterns does not guarantee future results. This article is for informational purposes only and does not constitute investment advice.