Graphic Packaging (GPK) Enters 8-Day Late-May Stretch With 88% Win Rate and 5.76% Average Gains
Graphic Packaging is heading toward a historically strong late-May trading window even as shares jump more than 18% over the past month, raising the stakes for this short seasonal stretch.
What is the seasonal pattern for Graphic Packaging (GPK)?
Graphic Packaging has risen in 7 of 8 midterm-year late-May windows during this 8-day pattern, with an average gain of 5.76% in winning years.
- 7 wins out of 8 midterm-year windows, with winning years averaging 5.76% gains over the 8 trading days.
- The upcoming window runs from May 26, 2026, for 8 trading days and has historically favored long positions in GPK.
- Percent Profitable stands at 88%, with 7 winners and just 1 loser across the last 8 midterm election years.
- Including all years, the average outcome is a 5% gain, showing that the lone losing year did not erase the broader upside bias.
- Historical intraperiod swings have been meaningful, with both strong maximum favorable moves and notable adverse drawdowns inside the window.
- The pattern’s TradeWave Ratio of 1.42 and Sharpe ratio of 1.19 point to a historically attractive risk-reward profile for this specific slice of the calendar.
According to historical data from TradeWave.ai, this late-May stretch has behaved differently from an average month for Graphic Packaging in past midterm election years. The next section looks at how that pattern has played out and what it means for the approaching 2026 window.
How has Graphic Packaging (GPK) traded in this late-May midterm window?
In the last eight midterm election years, this late-May 8-day window has been a sweet spot for Graphic Packaging, with the stock finishing higher in seven of those cycles and posting a 45% cumulative gain across them. Shares last closed at 11.24, up 4.7% on the day and about 51.6% below their 52-week high of 23.18, after a sharp 18.02% rebound over the past month.[1]
The presidential election cycle matters here because this pattern only looks at midterm election years, a phase that often brings policy uncertainty, rate debates and sector rotation in cyclical names like packaging. Grouping by the cycle strips out noise from other years and focuses on how GPK has behaved when Washington is in the same part of the four-year rhythm as it is today.
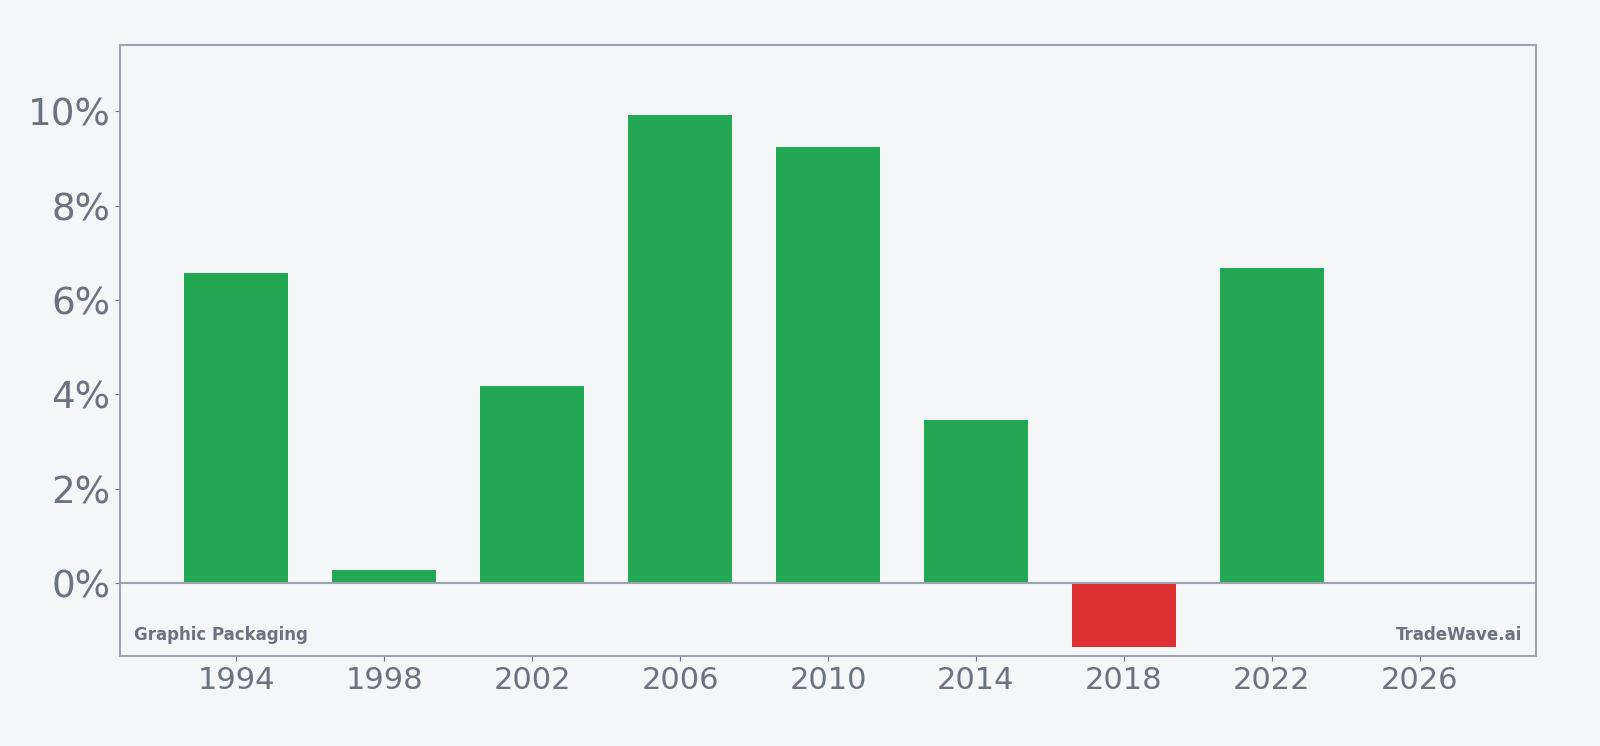
This seasonal window begins on May 26, 2026, and spans 8 trading days. Historically, during this period, Graphic Packaging has shown a strong bullish tendency for long trades, with an 88% hit rate and a 5% average gain when all years are included. The trade direction is explicitly long, so the positive years are those where the stock climbed over the window, while the single losing year in 2018 saw a modest 1.35% decline.
Looking at individual years, the strongest midterm showing came in 2006, when GPK gained 9.92% over the window, with a maximum favorable move of 12.67% from entry and a worst intraperiod drawdown of 5.51%. At the other end of the spectrum, 2018 delivered the only loss, down 1.35%, and featured a maximum adverse move of 4.04% even though the best intraperiod rally still reached 0.88%. Those two bookends capture the range of what this window has delivered in practice.
The historical seasonal average trend for this window shows gains tending to build steadily rather than in a single spike, with more of the upside accruing in the middle and later days of the period. That profile suggests that in winning years, traders who were long GPK often saw the stock grind higher across the window instead of relying on one outsized session.
The next chart layers net results with peak rallies and worst drawdowns to show how far GPK has typically swung inside the window.
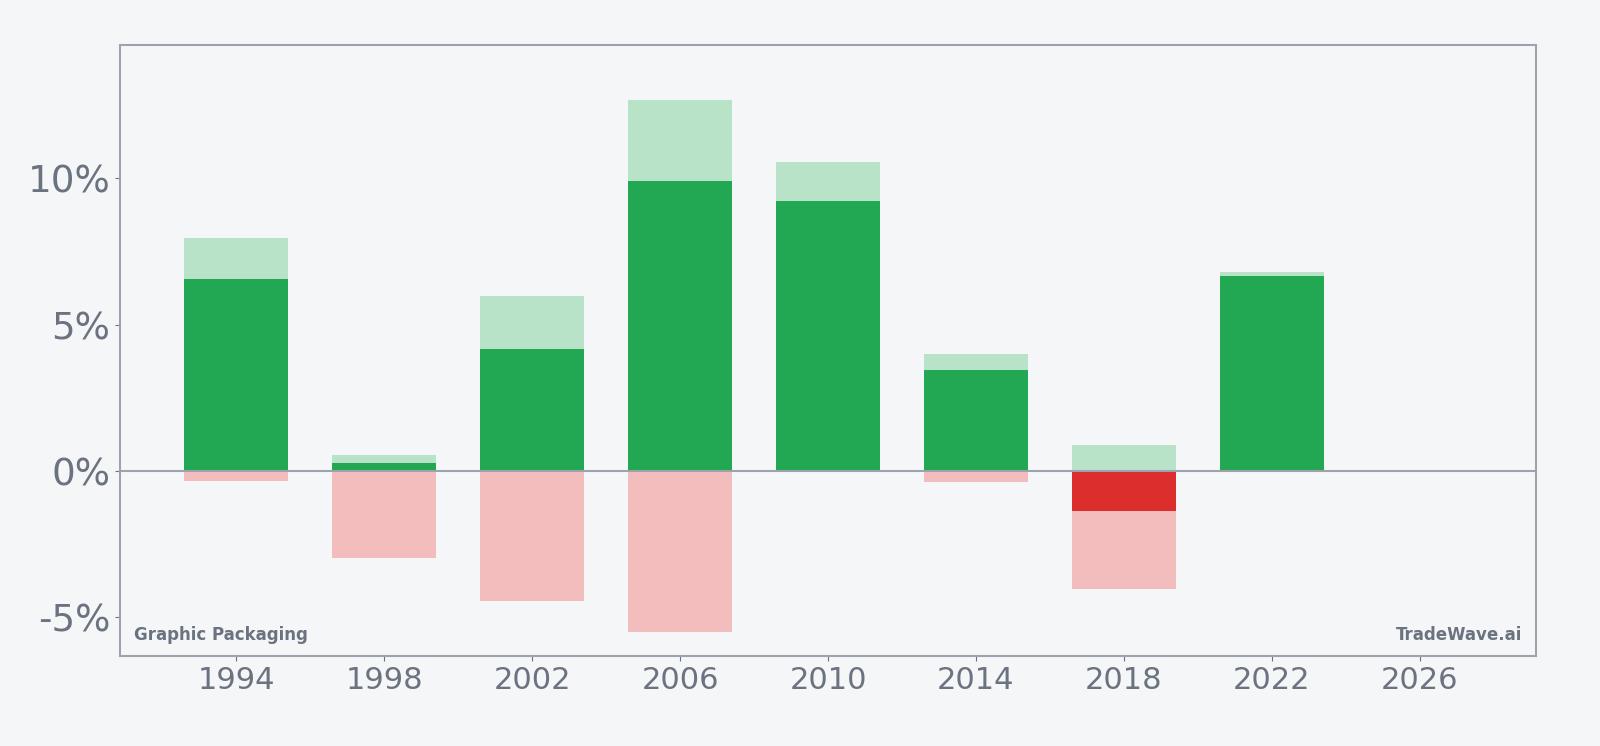
The stacked net, MFE and MAE bars show that in most years GPK has enjoyed solid peak rallies inside the window, often larger than the final net gain, while adverse moves have generally been contained but not trivial. In 2002 and 2006, for example, the stock saw intraperiod drawdowns of more than 4% before finishing the window with gains above 4%, underscoring that even historically favorable stretches have required sitting through some volatility.
History does not guarantee future results; adverse excursions (MAE) can be large even in winning windows.
Why does Graphic Packaging (GPK) follow this seasonal pattern?
This pattern may reflect how investors position around midyear for cyclical, packaging-linked demand as consumer and industrial spending data firm up. One likely driver is institutional portfolio rebalancing in midterm election years, when managers reassess exposure to economically sensitive names ahead of the second half. Analysts have also pointed to cost and capacity planning cycles in packaging and paper that tend to cluster around this time of year, which can influence expectations for margins and earnings trajectories.
What is driving Graphic Packaging (GPK) today?
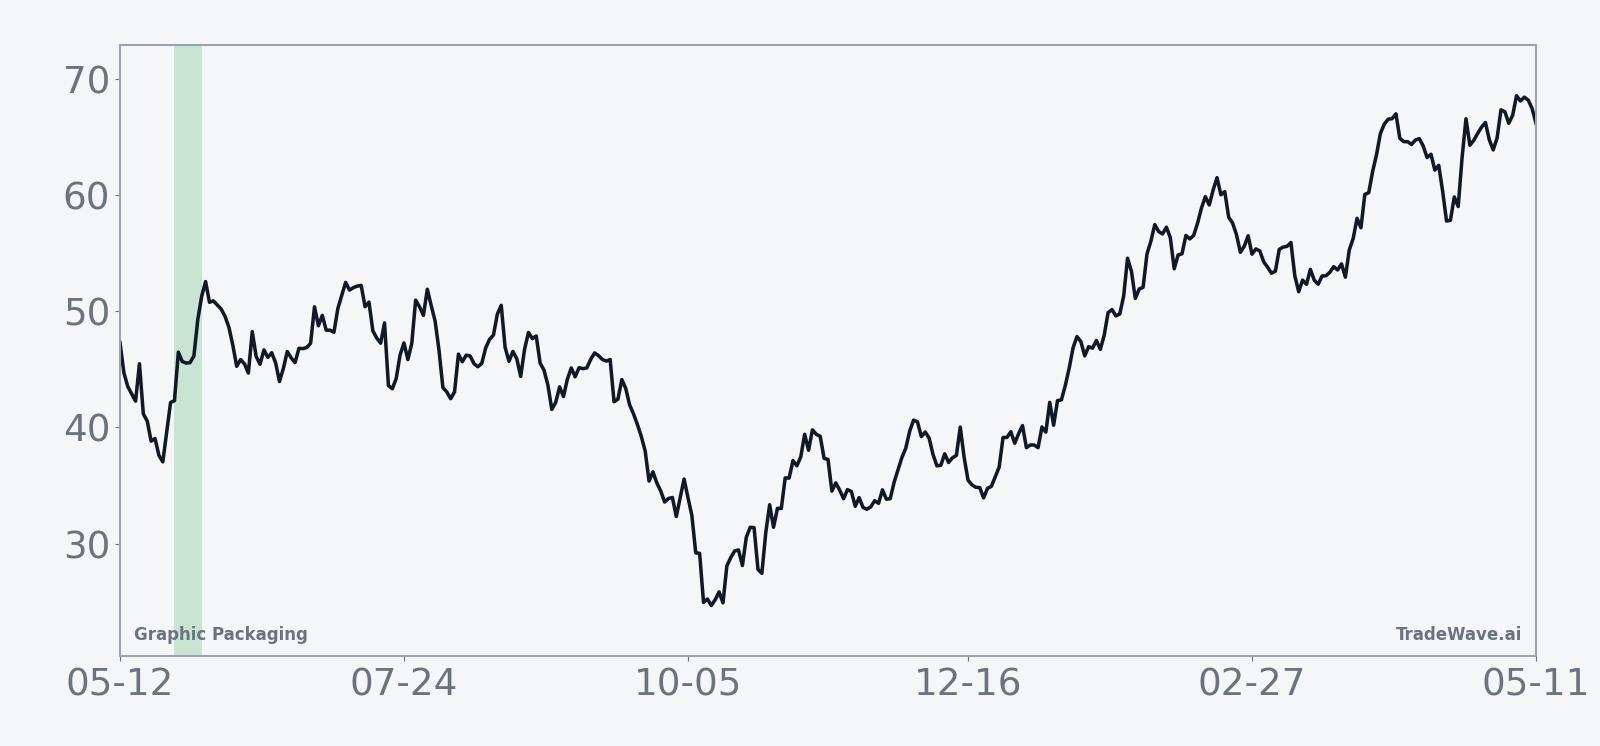
Graphic Packaging closed at 11.24 on May 7, up 0.51 on the day for a 4.7% gain, extending a 18.02% one-month rally that has pulled the stock back above its 50-day moving average of 10.00 on heavy volume of about 13.5 million shares versus a 20-day average of roughly 6.4 million.[1] Even after that rebound, GPK trades about 51.6% below its 52-week high of 23.18 and roughly 27.9% above its 52-week low of 8.79, leaving plenty of room on both sides of the recent range.[1]
Fundamentally, the story is still anchored in execution on cost and margin plans rather than fresh headlines. In Dec 2025, the company outlined cost and production optimization initiatives aimed at improving efficiency and profitability after a Q3 2025 earnings beat that came with trimmed guidance due to margin pressures.[1] Those efforts, combined with a 2026 free cash flow target of $700 million to $800 million, frame how investors are thinking about the balance between cyclical demand, pricing power and capital returns as the stock approaches this historically strong late-May trading window.
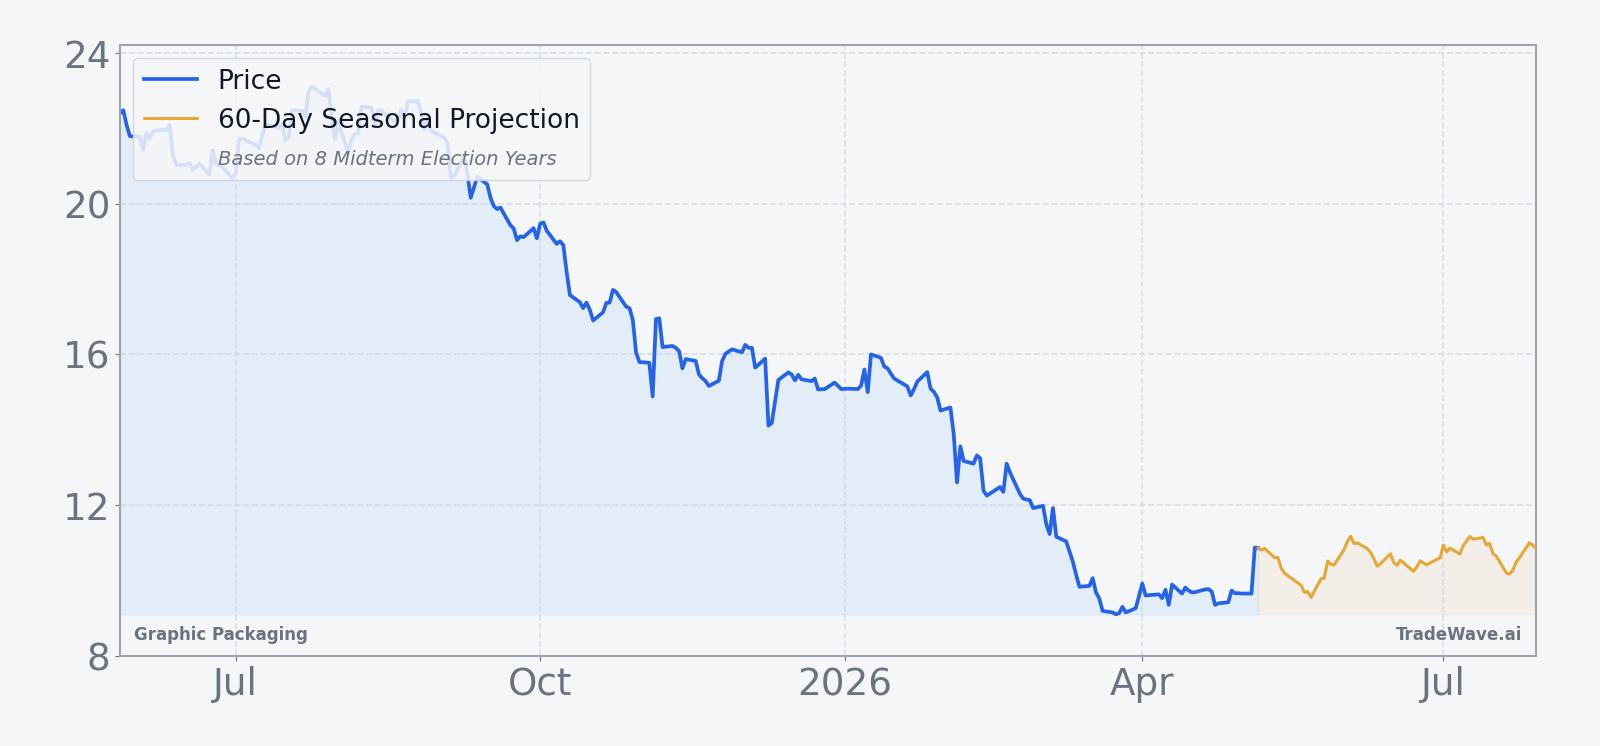
The chart below situates the latest move in its recent multi-month context alongside a 60-day seasonal projection.
What should traders watch as the late-May window approaches?
With GPK already bouncing hard off its recent lows, the key question for this year’s midterm window is whether the stock can extend that momentum into the historically favorable 8-day stretch starting May 26. Traders will be watching how the stock behaves around the 11 to 12 range, where recent resistance has formed, and whether volume stays elevated or fades back toward its 20-day average as the window opens.[1]
On the macro side, any shifts in rate expectations or signs of slowing consumer and industrial demand could matter more than usual for a packaging name that sits squarely in the cyclical camp. If GPK can hold above its 50-day moving average and build higher lows into the window, that would be consistent with the historical pattern of steady gains across the period. A sharp reversal that slices back toward the 9 to 10 area, especially on rising volume, would run counter to the typical late-May seasonal trend and signal that this midterm year may be one of the rare exceptions.
Sources
About this seasonal analysis
Seasonal pattern data is sourced from TradeWave.ai, which analyzes historical price behavior across annual calendar windows going back up to 30 years. Read the full data methodology or the book The 100-Year Pattern by Afshin Moshrefi (2026 edition). Past performance of seasonal patterns does not guarantee future results. This article is for informational purposes only and does not constitute investment advice.