Simpson Manufacturing Company (SSD) Has Fallen in All 7 Midterm 140-Day Windows Since 1998
Simpson Manufacturing Company is heading toward a midterm-year seasonal window that has never produced a gain for the stock, even as shares trade just below their 52-week high after a strong post-earnings jump.

What is the seasonal pattern for Simpson Manufacturing Company (SSD)?
Simpson Manufacturing Company has fallen in 7 of 7 midterm-year windows during this 140-day stretch since 1998, with an average gain of 14.82% for traders positioned short in winning years.
- 7 for 7 in this window for short setups, with an average profit of 14.82% in winning years.
- The upcoming 140-day midterm-year window starts on May 27, 2026 and has historically favored downside in SSD.
- Percent Profitable is 100%, with 7 winners and 0 losers across the last seven midterm election years.
- Average losses for SSD in those years translate into a 155% cumulative return for the short pattern since 1998.
- Intraperiod swings have been large, with some years showing adverse moves near 30% before the trade finished in profit.
- TradeWave Ratio of 2.23 and a Sharpe ratio of 1.16 point to a historically strong but volatile short-biased window.
According to historical data from TradeWave.ai, this midterm-year stretch has behaved very differently from an average quarter for Simpson Manufacturing Company, with a consistent downside bias that most investors never see in standard charts.
How has Simpson Manufacturing Company (SSD) traded in past midterm-year windows?
Simpson Manufacturing Company has fallen in all seven midterm election years during this 140-day window since 1998, delivering a 155% cumulative gain for traders who were short in those cycles. Shares finished Monday at $186.51, up 2.7% on the day and about 12.0% below the 52-week high of $211.98, leaving the stock elevated heading into a historically weak stretch for longs.[8]
Grouping the data by the presidential election cycle matters here because this window only looks at midterm election years, a phase that often brings policy uncertainty, shifting infrastructure priorities and tighter financial conditions compared with the pre-election year that follows. For a construction-linked name like Simpson Manufacturing Company, that mid-cycle backdrop has historically lined up with softer stock performance even when the broader economy was not in recession.
This seasonal window begins on May 27, 2026 and spans 140 trading days, covering late spring through early autumn in the midterm election year. Historically, during this period, Simpson Manufacturing Company has been a strong performer for short positions, with every one of the last seven midterm-year windows finishing in the red for the stock and in profit for traders positioned with the pattern.
The Percent Profitable figure is 100%, with 7 winners and 0 losers, which is rare for a single-stock seasonal pattern over nearly three decades. Average profit for the short trades is 14.82%, meaning that in a typical winning year the stock has dropped by roughly that amount from entry to exit, while the all-years average is effectively the same because there were no losing years in the sample.
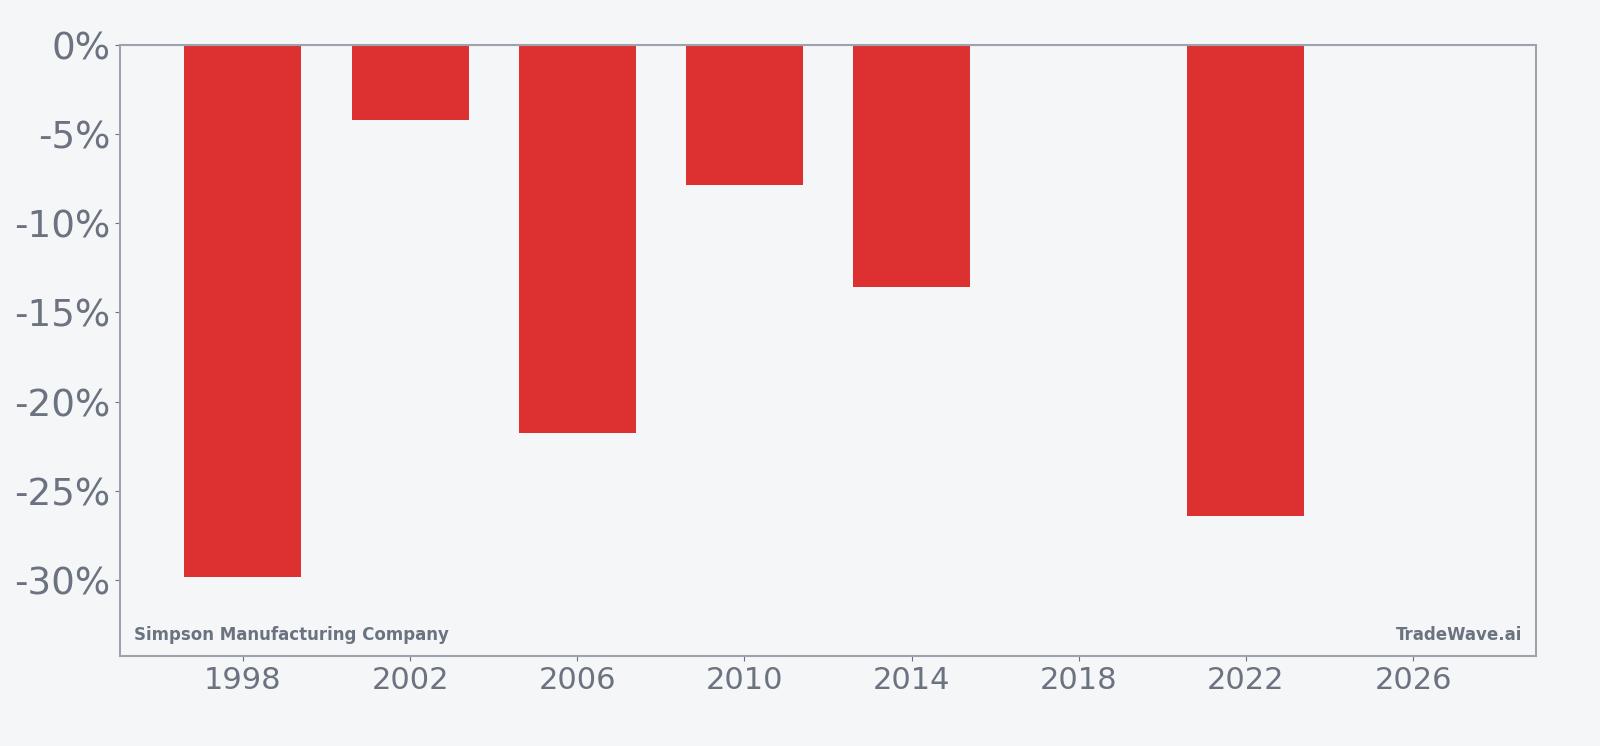
The per-year table shows how uneven those outcomes have been. The strongest year for the short pattern was 1998, when SSD fell 29.81% from entry to exit, while 2018 was the weakest, with the stock essentially flat at a 0.05% decline by the end of the window. In between sit years like 2006 and 2022, where net returns of -21.75% and -26.42% respectively made the window particularly painful for longs.
Intraperiod swings have been large. Maximum favorable moves for the short side, which capture the best point-to-peak decline during the window, reached 23.54% in 2018 even though the trade finished almost flat, and topped 10% in 2014. On the other side, maximum adverse moves, which measure the worst drawdown against the short before it recovered, ran as deep as -30.77% in 2022 and -30.11% in 2006, underscoring that rallies against the pattern can be sharp before the longer window reasserts itself.
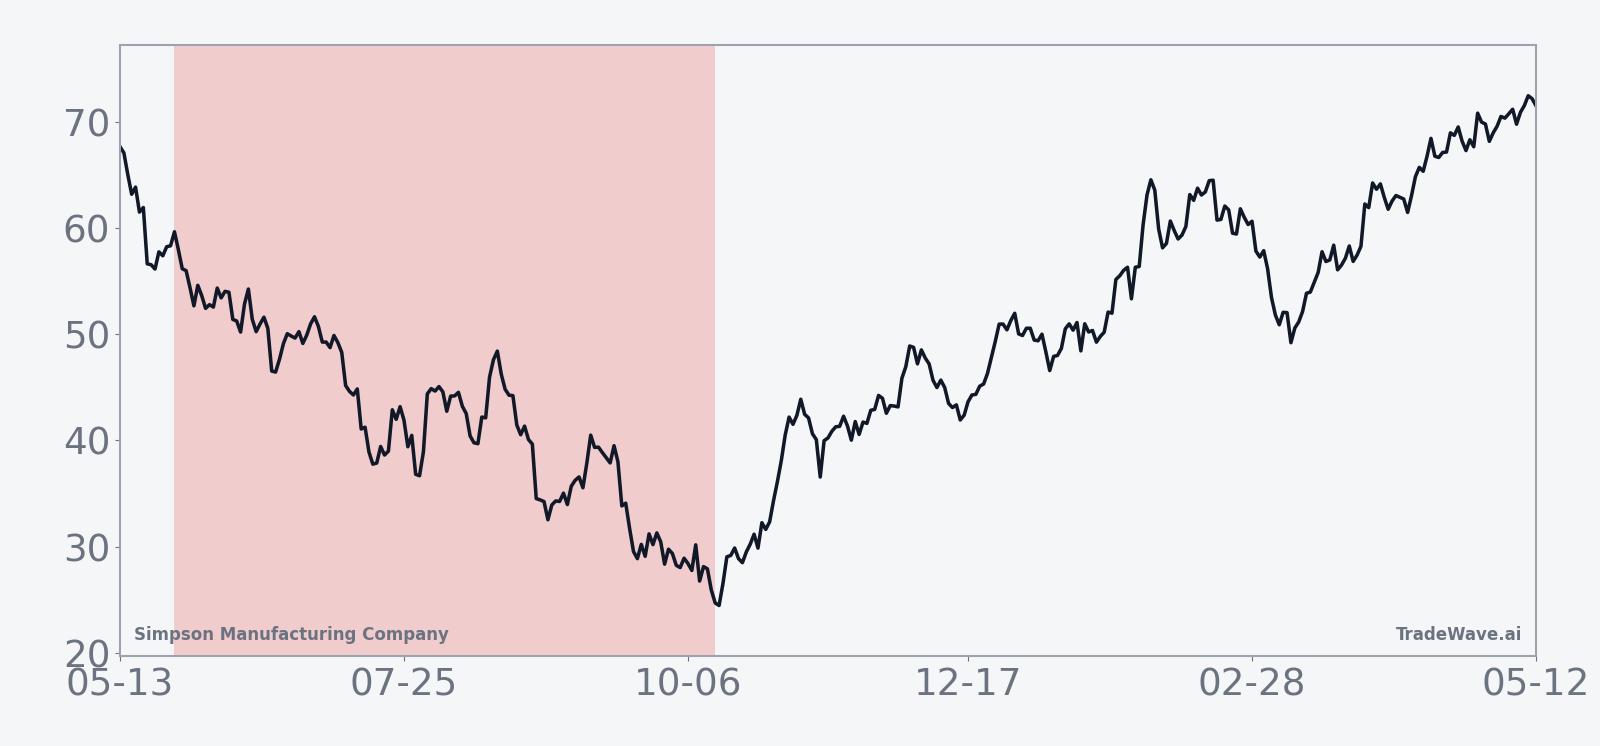
The historical seasonal trend line for this midterm-year window slopes steadily lower, with most of the cumulative decline accruing in the middle third of the period rather than right after entry. That suggests the typical pattern has been a choppy or even slightly positive start, followed by a more persistent downtrend as the window matures.
A second view combines net results with the best and worst intraperiod swings to show how far SSD has tended to move inside the window.
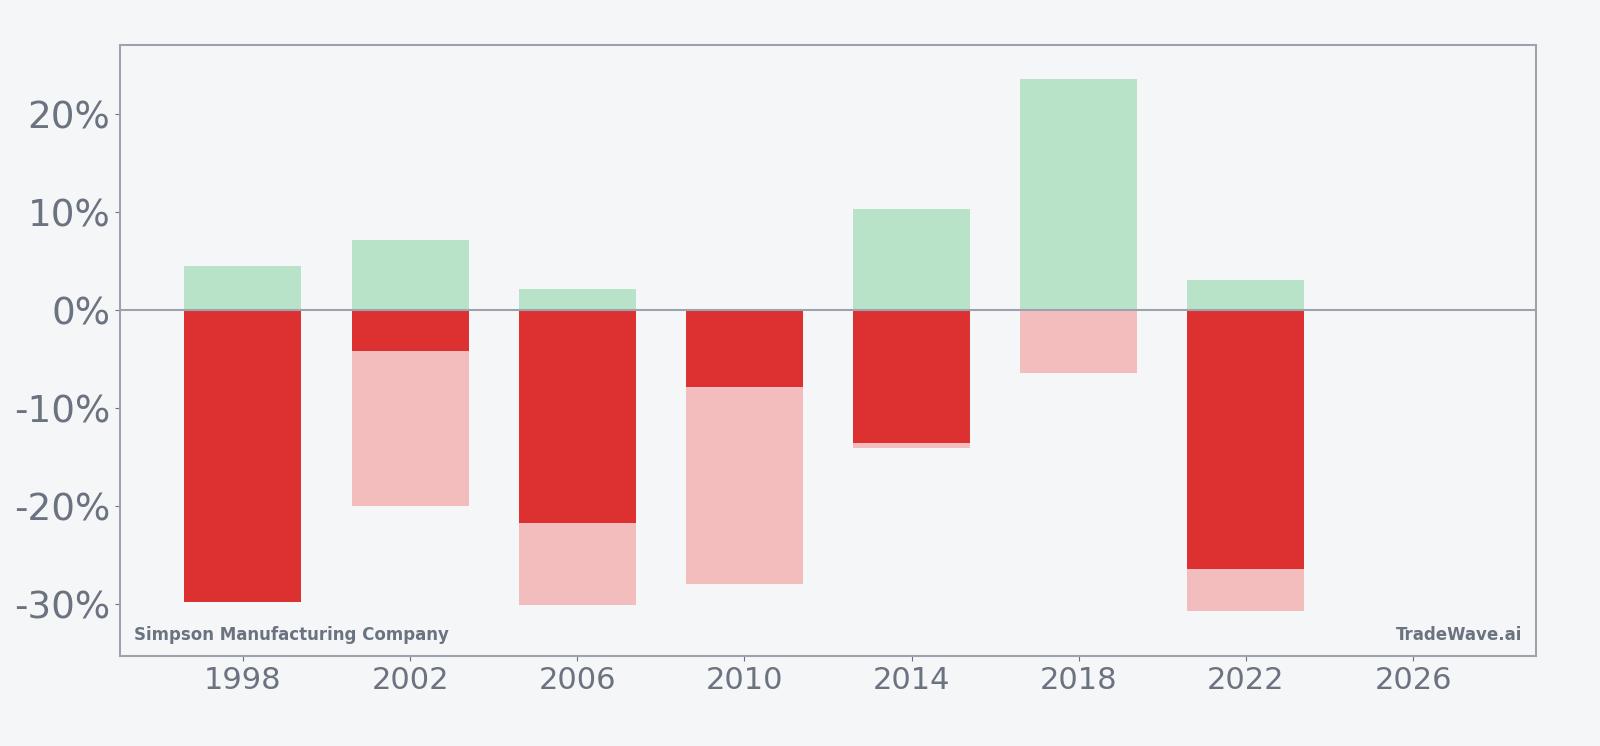
The combined net, maximum favorable and maximum adverse bars show a pattern of sizable downside potential for shorts alongside meaningful risk of sharp countertrend rallies. Add it up: seven midterm-year windows, seven profitable short trades, and several episodes where SSD first squeezed higher by double digits before rolling over.
History does not guarantee future results, and adverse excursions can be large even in windows that have always finished in profit for the historical short setup.
Why does Simpson Manufacturing Company (SSD) follow this seasonal pattern?
This pattern may reflect how construction and building-products stocks trade around midterm election years, when public infrastructure spending, housing policy and rate expectations are often in flux. One likely driver is institutional portfolio repositioning as investors reassess exposure to cyclical names ahead of potential policy shifts, which can pressure shares over several months. Analysts have also pointed to the timing of earnings and guidance resets in this part of the cycle, which can cluster disappointments into the same stretch of the calendar.
What is driving Simpson Manufacturing Company (SSD) today?
Simpson Manufacturing Company closed at $186.51 on Apr 27, up 2.7% on the session and roughly 12.0% below its 52-week high of $211.98, with the move coming on volume of 294,869 shares versus a 20-day average of 291,235.1.[8] The stock has been supported by a string of earnings beats, including Q3 2025 results that topped expectations on both EPS and revenue and Q1 2025 numbers that showed revenue growth despite economic headwinds, helping keep sentiment constructive into 2026.[3][4]
In Apr 2026, Simpson Manufacturing Company reported quarterly earnings that again beat consensus by $0.31 per share, reinforcing the narrative of steady execution in a choppy construction backdrop and drawing fresh attention from institutional investors.[8] In 2025, the company also raised its profile with a quarterly dividend and attracted new capital from long-only funds, while at least one director trimmed holdings, moves that collectively point to an actively managed shareholder base rather than a sleepy small cap.[5][6][8]
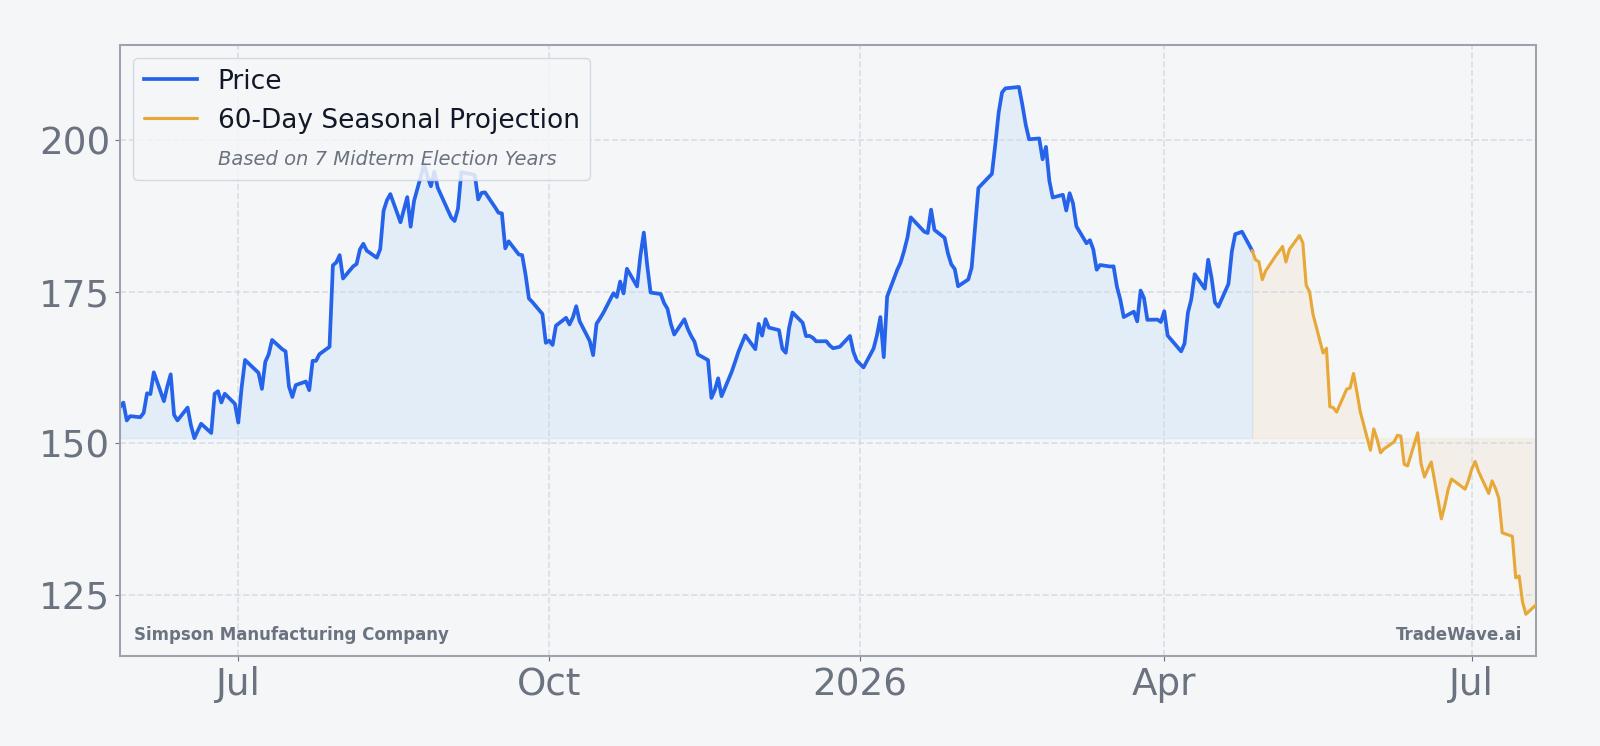
The chart below situates the latest move against the past year of trading, with a 60-day seasonal projection overlay.
What should traders watch as this midterm-year window approaches?
First, the calendar: the 140-day midterm-year window starts on May 27, 2026, so any shift from the current post-earnings strength into a more labored tape would line up closely with the historical pattern. Second, price levels matter; how SSD behaves between the current $186 area and the 52-week high near $212 will shape the risk-reward for anyone thinking about the seasonal trend.[8]
Third, watch the construction-sector backdrop and any policy headlines tied to infrastructure, housing incentives or building codes, since those have historically influenced earnings expectations for Simpson Manufacturing Company and its peers.[7] Finally, monitor whether the stock’s recent tendency to rally on earnings beats persists into the window or fades; a break in that behavior during the midterm-year stretch would be consistent with the long-run seasonal record, while another strong upside reaction could signal that this cycle is diverging from history.[3][4][8]
Sources
- MarketBeat: Robert W. Baird Issues Positive Forecast for Simpson Manufacturing (NYSE:SSD) Stock Price (Oct 29, 2025)
- MarketBeat: Simpson Manufacturing (NYSE:SSD) Hits New 12-Month High on Strong Earnings (Feb 10, 2026)
- MarketBeat: Simpson Manufacturing (NYSE:SSD) Issues Earnings Results (Oct 28, 2025)
- MarketBeat: Royce & Associates LP Sells 21,362 Shares of Simpson Manufacturing Company, Inc. (NYSE:SSD) (Jul 25, 2025)
- MarketBeat: Simpson Manufacturing Company, Inc. Declares Quarterly Dividend of $0.29 (NYSE:SSD) (Jul 26, 2025)
- MarketBeat: Rivulet Capital LLC Invests $40.93 Million in Simpson Manufacturing Company, Inc. (SSD) (Dec 8, 2025)
- GuruFocus: Simpson Manufacturing (SSD) Exceeds Q1 Revenue Expectations Amid Economic Challenges (Apr 29, 2025)
- MarketBeat: Simpson Manufacturing (NYSE:SSD) Releases Earnings Results, Beats Expectations By $0.31 EPS (Apr 27, 2026)
About this seasonal analysis
Seasonal pattern data is sourced from TradeWave.ai, which analyzes historical price behavior across annual calendar windows going back up to 30 years. Read the full data methodology or the book The 100-Year Pattern by Afshin Moshrefi (2026 edition). Past performance of seasonal patterns does not guarantee future results. This article is for informational purposes only and does not constitute investment advice.