Simpson Manufacturing Company (SSD) Has Rallied in 15 of 15 Late-Spring 55-Day Windows
Simpson Manufacturing Company is heading toward a historically strong 55-day late-spring trading window even as the stock trades well below its 52-week high and investors weigh construction demand and earnings power.

What is the seasonal pattern for Simpson Manufacturing Company (SSD)?
Simpson Manufacturing Company has risen in 15 of 15 years during this late-spring 55-day window, with an average gain of 5.01% in winning years.
- 15 for 15 in this window, averaging 5.01% gains in winning years across the past 15 seasons.
- The upcoming 55-day trading window begins on May 18, 2026 and has historically favored long positions in SSD.
- Percent Profitable is 100%, with 15 winners and 0 losers over the lookback period.
- Cumulative return across all 15 windows totals 106%, with a Sharpe ratio of 1.21 for end-of-window outcomes.
- The TradeWave Ratio of 1.39 signals that SSD typically travels meaningfully in the trade direction within the window.
- Individual years have still seen notable intraperiod drawdowns even when finishing higher, so risk management has mattered inside the window.
According to historical data from TradeWave.ai, this late-spring stretch has behaved very differently from an average month on the SSD calendar. The next section looks at how that pattern has played out and what it could mean for the coming window.
How has Simpson Manufacturing Company (SSD) traded in this late-spring window?
Simpson Manufacturing Company has posted gains in every one of the past 15 late-spring windows starting around May 18, averaging a 5.01% rise over each 55-day stretch. The stock finished Thursday at $185.47, up 1.9% on the day and about 12.5% below its 52-week high of $211.98, leaving room above if the historical pattern repeats. That combination of a clean seasonal track record and a pullback from the highs is what has SSD’s upcoming trading window on many radar screens.
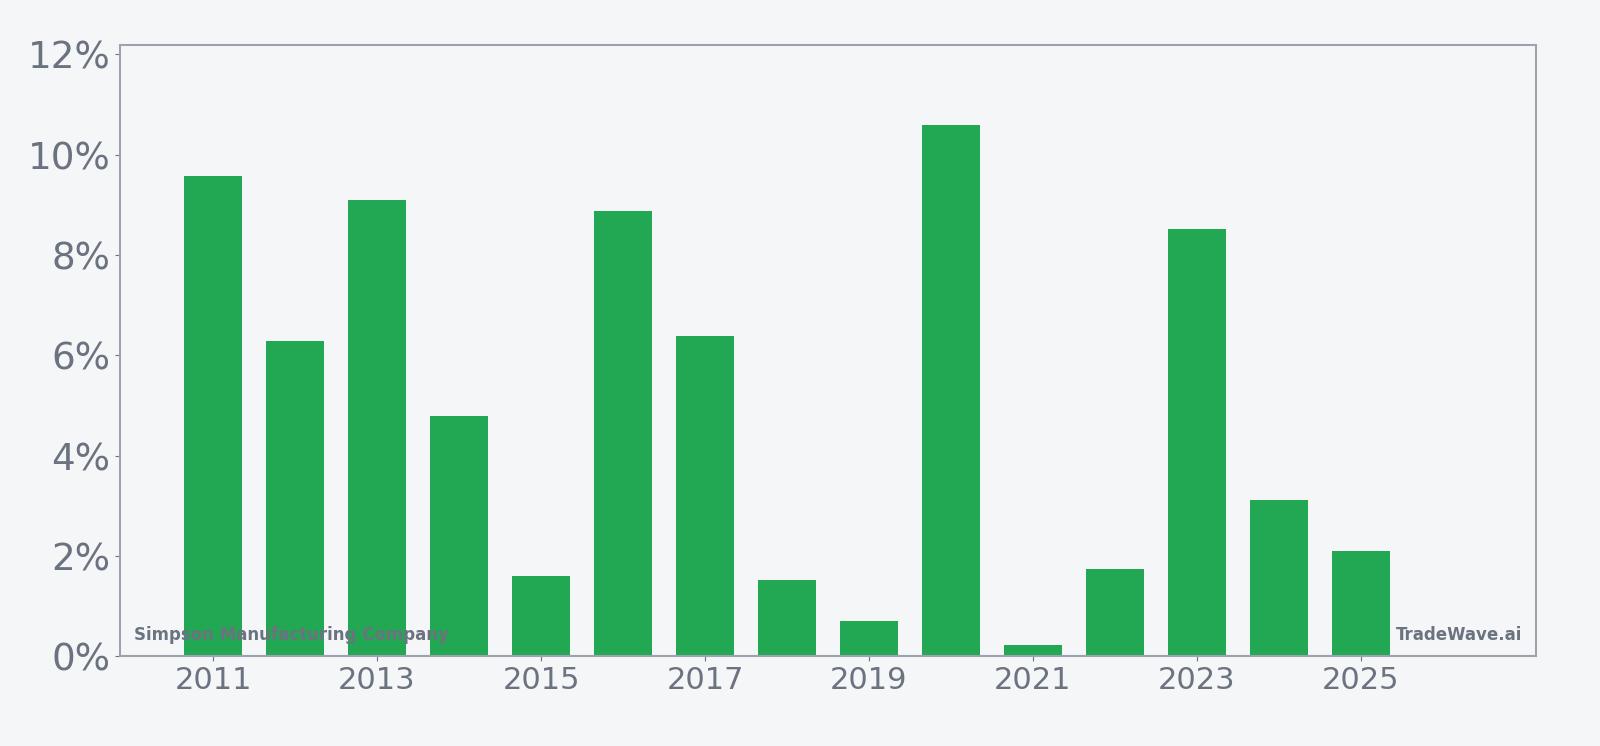
Across the 15-year sample, the strongest late-spring season came in 2020, when SSD gained 10.6% in the window and at one point was up 30.31% from the entry before giving back part of the move by the close. The softest year was 2021, which still finished positive but only by 0.23%, after a modest 4.04% peak run-up and a 4.41% intraperiod drawdown. Even the more muted years like 2019 and 2018 ended higher, with net gains of 0.71% and 1.53% respectively.
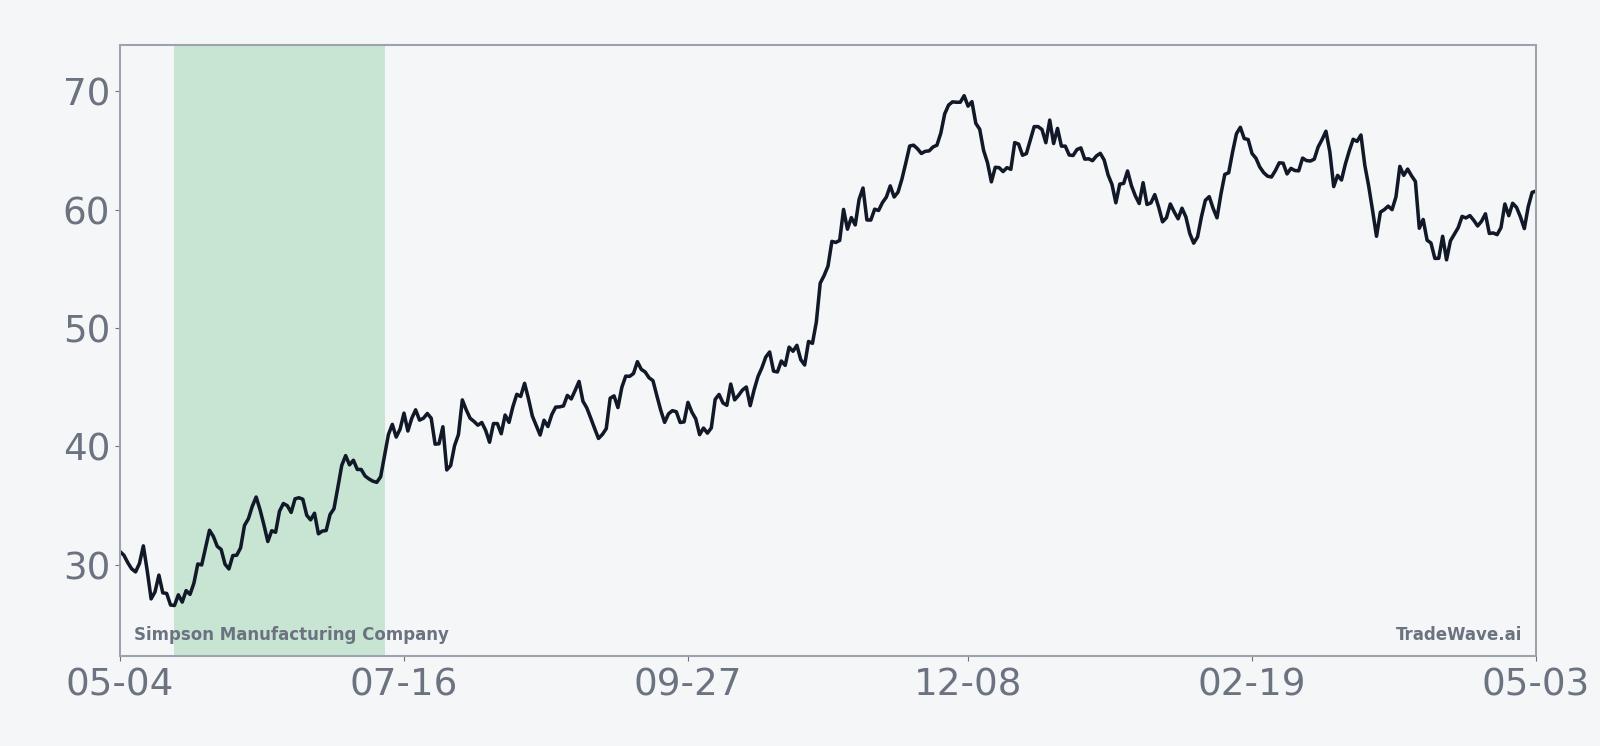
The historical seasonal trend line for this 55-day slice shows a steady upward bias rather than a single explosive burst. Returns tend to build gradually through the middle of the window, with some choppiness late as earlier gains consolidate. That profile fits a construction-sector name where news flow is often tied to project pipelines and macro data rather than one-off binary events.
A closer look at yearly net returns alongside peak run-ups and worst drawdowns shows how upside and downside have traded off inside the window.
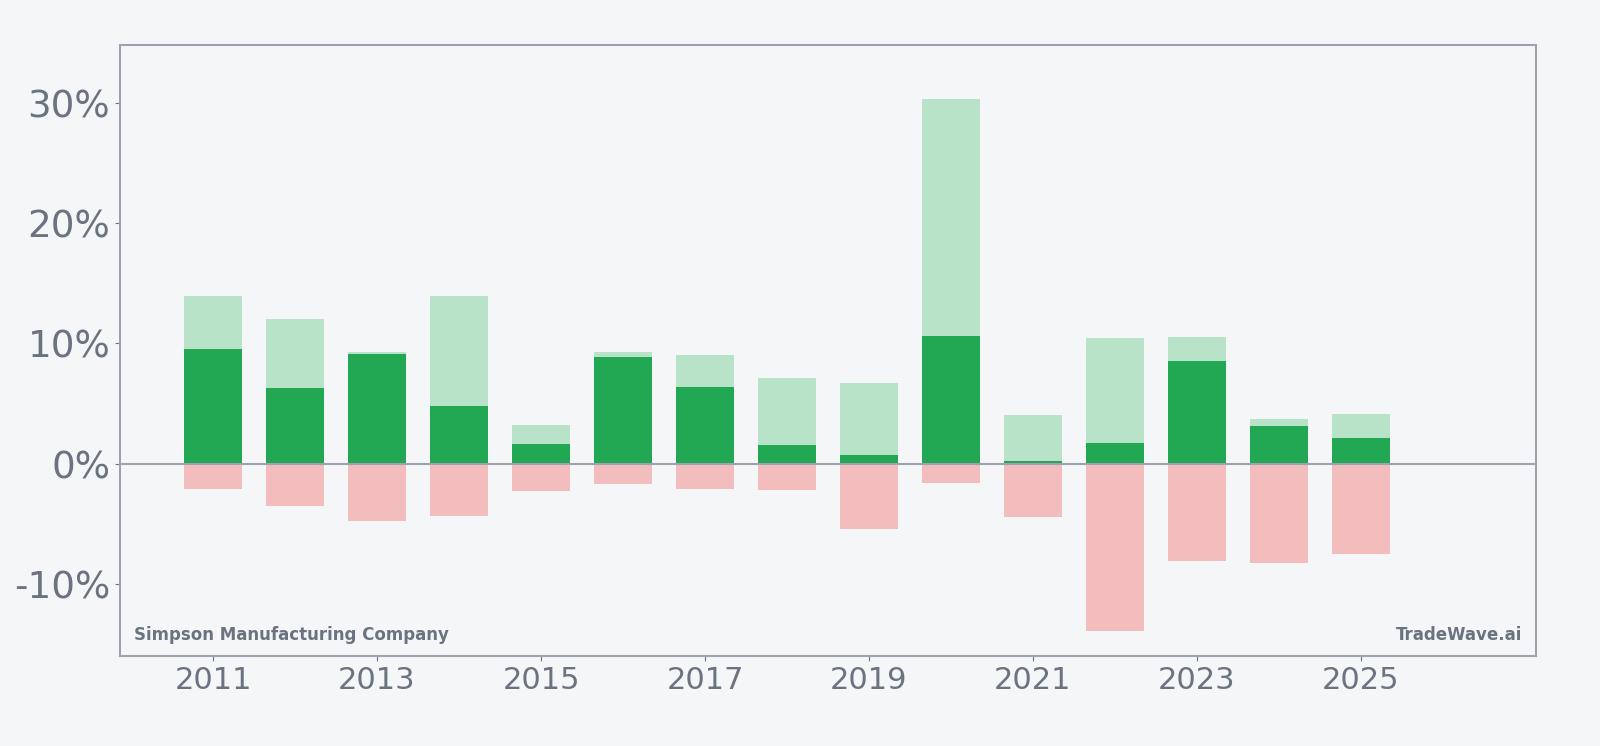
Maximum favorable moves inside the window have been sizable in several years, with SSD at times running more than 10% above the entry before settling back by the close. At the same time, maximum adverse excursions have occasionally been deep, such as a roughly 13.95% intraperiod drawdown in 2022 even though that season still finished with a 1.74% gain. The pattern has rewarded patience historically, but it has not been a straight line.
History does not guarantee future results; adverse excursions can be large even in winning windows, so traders should treat the seasonal pattern as context rather than a forecast.
Why does Simpson Manufacturing Company (SSD) follow this seasonal pattern?
One likely driver is the way construction activity and building-product orders ramp into the summer building season, which can support sentiment for a structural hardware supplier like Simpson Manufacturing. Analysts have also pointed to the company’s earnings calendar, with results often landing in late April or July, so this May-to-July stretch can capture post-earnings positioning and guidance reactions.[4] The pattern may also reflect institutional portfolio rebalancing into industrial and construction names as visibility on housing and nonresidential projects improves midyear.[1]
What is driving Simpson Manufacturing Company (SSD) today?
Simpson Manufacturing Company shares closed at $185.47 on Apr 23, up 1.9% on the session and sitting about 12.5% below the stock’s 52-week high of $211.98, while remaining well above the 52-week low of $143.09. The stock is trading modestly above its 50-day moving average of $183.13, with 602,767 shares changing hands versus a 20-day average volume of 272,264, signaling elevated interest as investors look ahead to the construction season.
In February 2026, the company reported fourth-quarter earnings per share of $1.35, beating estimates by $0.09, with revenue of $539.35 million up 4.2% year over year, underscoring resilient profitability despite a mixed macro backdrop for building activity.[4] Earlier in 2025, Simpson Manufacturing had also topped expectations in multiple quarters, including a July 2025 report that showed EPS of $2.47 on revenue growth of 5.7%, reinforcing the narrative of steady demand for its structural connectors and related products.[6] Across recent commentary, analysts have penciled in $8.29 in earnings per share for the current fiscal year, reflecting expectations for continued earnings power even as interest-rate uncertainty lingers.[7]
On the positioning side, institutional flows have been active. In July 2025, Royce & Associates trimmed its stake, selling 21,362 shares, while trading volume that day ran at 31,023 shares against an average of 268,071, hinting at portfolio reshuffling rather than a wholesale exit.[5] In February 2026, Envestnet Asset Management disclosed the sale of 17,402 shares, part of a broader pattern of selective profit-taking and insider selling flagged around earnings updates.[3] More recently, on Mar 30, 2026, SG Americas Securities reported acquiring 59,828 shares, suggesting that some institutional investors are still willing to add exposure at current levels.[11]
Sector context has been constructive but not euphoric. In April 2025, coverage of Simpson Manufacturing highlighted how the company continued to exceed revenue expectations despite economic challenges, positioning it as a relatively defensive way to play construction demand.[1] That backdrop, combined with a MarketBeat consensus rating of “Hold” and a price target around $201 that sits modestly above the current quote, frames SSD as a steady compounder rather than a high-beta construction bet.[2]
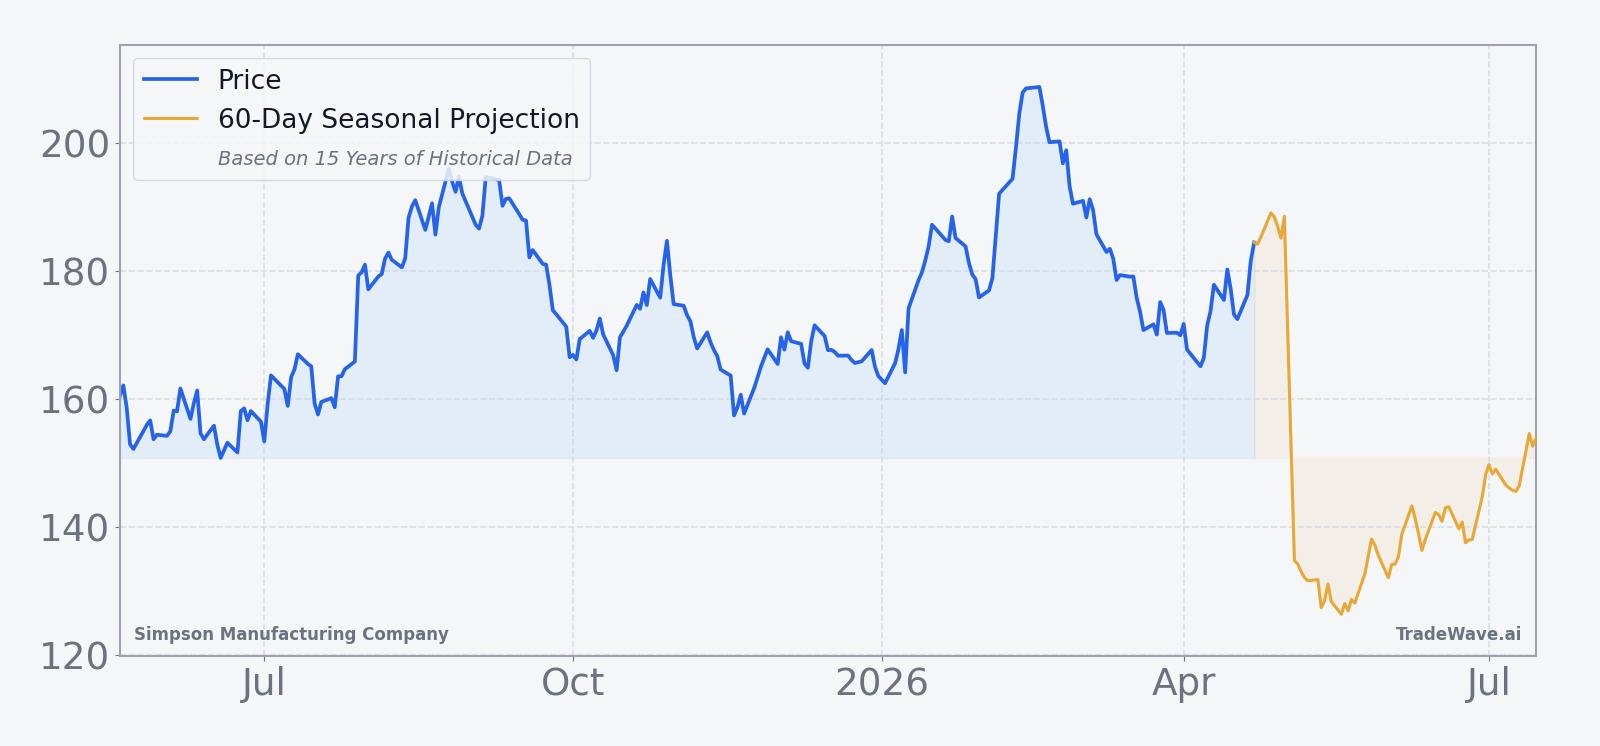
The chart below situates the latest move against SSD’s past year of trading and a 60-day seasonal projection.
What should traders watch as the SSD seasonal window approaches?
First, the calendar. The 55-day late-spring window begins on May 18, 2026, so the next three weeks are about watching how SSD behaves as it approaches that historical inflection point. A firm base above the 50-day moving average and a push back toward the $200 area would fit the typical bullish seasonal setup, while a break back toward the mid-$170s would signal a more cautious tone heading into the window.
Second, earnings and macro data. With no near-term earnings date on the calendar, traders will be leaning on construction spending releases, housing starts, and any commentary from peers to gauge whether the demand backdrop is improving or softening. Stronger-than-expected indicators could reinforce the historical late-spring strength, while weaker prints might test how durable the SSD seasonal trend really is.
Third, institutional flows and volume. The recent mix of stake reductions and fresh buying from firms like Envestnet and SG Americas shows that large holders are still actively adjusting positions.[3][11] If volume remains elevated and block trades skew to the buy side as May 18 approaches, that would suggest investors are leaning into the historical pattern; a fade in liquidity or a tilt toward selling would argue for more caution.
Finally, watch how SSD trades inside the window itself. In prior years, the stock has often seen meaningful intraperiod swings before finishing higher, with some seasons featuring double-digit peak gains and mid-single-digit drawdowns. If the stock quickly extends higher early in the window and then consolidates without breaking key support levels, it would rhyme with the established SSD seasonal trend. A sharp downside break that fails to recover by the end of the 55 days would mark a clear departure from the 15-for-15 record and signal that the late-spring playbook may be changing.
Sources
- GuruFocus: Simpson Manufacturing (SSD) Exceeds Q1 Revenue Expectations Amid Economic Challenges (Apr 29, 2025)
- MarketBeat: Robert W. Baird Issues Positive Forecast for Simpson Manufacturing (NYSE:SSD) Stock Price (Oct 29, 2025)
- MarketBeat: Envestnet Asset Management Inc. Sells 17,402 Shares of Simpson Manufacturing Company, Inc. SSD (Feb 13, 2026)
- MarketBeat: Simpson Manufacturing (NYSE:SSD) Issues Quarterly Earnings Results (Feb 9, 2026)
- MarketBeat: Royce & Associates LP Sells 21,362 Shares of Simpson Manufacturing Company, Inc. (NYSE:SSD) (Jul 25, 2025)
- MarketBeat: 6,901 Shares in Simpson Manufacturing Company, Inc. (NYSE:SSD) Bought by Meridian Wealth Management LLC (Aug 14, 2025)
- MarketBeat: Simpson Manufacturing (NYSE:SSD) Issues Earnings Results (Oct 28, 2025)
- MarketBeat: Simpson Manufacturing (NYSE:SSD) Hits New 12-Month High on Strong Earnings (Feb 10, 2026)
- MarketBeat: Victory Capital Management Inc. Has $4.54 Million Holdings in Simpson Manufacturing Company, Inc. (NYSE:SSD) (Jul 27, 2025)
- MarketBeat: Simpson Manufacturing Company, Inc. Declares Quarterly Dividend of $0.29 (NYSE:SSD) (Jul 26, 2025)
- MarketBeat: SG Americas Securities LLC Acquires 59,828 Shares of Simpson Manufacturing Company, Inc. SSD (Mar 30, 2026)
About this seasonal analysis
Seasonal pattern data is sourced from TradeWave.ai, which analyzes historical price behavior across annual calendar windows going back up to 30 years. Read the full data methodology or the book The 100-Year Pattern by Afshin Moshrefi (2026 edition). Past performance of seasonal patterns does not guarantee future results. This article is for informational purposes only and does not constitute investment advice.