Tesla, Inc. (TSLA) Has Rallied in 12 of 13 Late-May Windows, Averaging 14.59% Gains
Tesla, Inc. is heading toward a historically strong late-May trading window even as shares sit well below their 52-week high and investors weigh margin pressure, AI ambitions, and volatile post-earnings flows.

What is the seasonal pattern for Tesla, Inc. (TSLA)?
Tesla, Inc. has risen in 12 of 13 years during this late-May 30-day window, with an average gain of 14.59% in winning years.
- 12 wins and 1 loss in this window over 13 years, with winning years averaging 14.59% gains.
- The upcoming pattern runs from May 22 for 30 trading days and has been a historically bullish TSLA seasonal trend.
- Percent Profitable is 92%, with 12 winners and just 1 loser across the sample.
- Including every year, Avg Profit - All is 13%, reflecting one sizeable losing year against many strong advances.
- Intraperiod swings have been large, with several years showing double-digit peak run-ups and notable drawdowns before finishing higher.
- The TradeWave Ratio of 1.51 and a Sharpe ratio of 0.9 point to a historically strong but volatile long-side window.
According to historical data from TradeWave.ai, this late-May stretch has behaved very differently from an average month for Tesla, with a clear long-side bias that most traders never see quantified.
How has Tesla, Inc. (TSLA) traded in the late-May seasonal window?
Tesla, Inc. has posted gains in 12 of the past 13 iterations of the 30-day window that begins on May 22, averaging 14.59% in winning years. Shares finished Monday at $386.42, down 1.5% on the day and about 22.6% below the 52-week high of $498.83, leaving room above if the pattern repeats. The lone losing year in the sample came with a 5.54% decline, underscoring that even a strong seasonal edge can occasionally break.
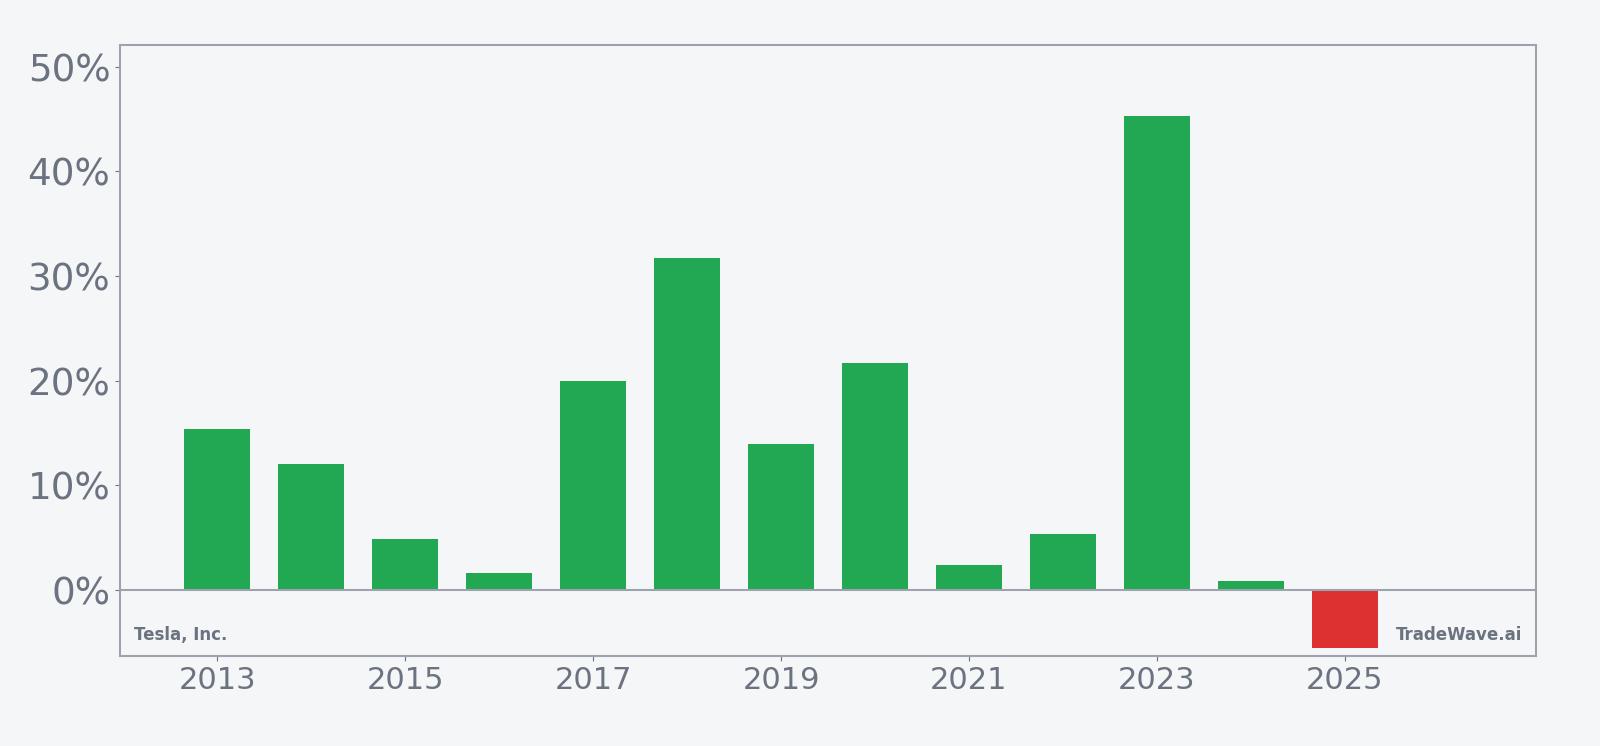
The trade direction for this pattern is explicitly long, and the track record is unusually one-sided for a megacap stock. Percent Profitable sits at 92%, with 12 winners against just 1 loser, and the all-years average outcome of 13% shows that the single down year has not erased the cumulative effect of repeated double-digit advances. The strongest year in the sample was 2023, when TSLA gained 45.31% in the window, while 2016 delivered a modest 1.61% gain that still counted as a win.
Average profit in winning years is 14.59%, but the distribution is wide. Some years, such as 2018 and 2020, saw net returns of 31.71% and 21.72% respectively, while others like 2021 and 2024 barely moved, with gains of 2.37% and 0.81%. Including the 5.54% loss in 2025 pulls the Avg Profit - All down to 13%, which is still a hefty number for a 30-day stock pattern analysis.
Intraperiod behavior has been even more dramatic than the closing stats suggest. Maximum favorable excursions, the best point-to-peak moves within the window, have reached 35.9% in 2018 and 25.78% in 2020, while even quieter years like 2016 still saw an 11.39% peak run-up. On the downside, maximum adverse excursions, the worst drawdowns from entry, have ranged from a shallow 0.37% in 2018 to a sharp 19.89% in 2025, showing that even winning regimes can involve painful dips along the way.
The 2025 window is a useful stress test. TSLA entered that late-May stretch near $341.04 and at one point rallied 7.82% before reversing into a 19.89% intraperiod drawdown and finishing the window down 5.54% at $322.16. That year stands out as the only losing outcome in the series and illustrates how a strong historical seasonality can still be overwhelmed by a negative fundamental tape.
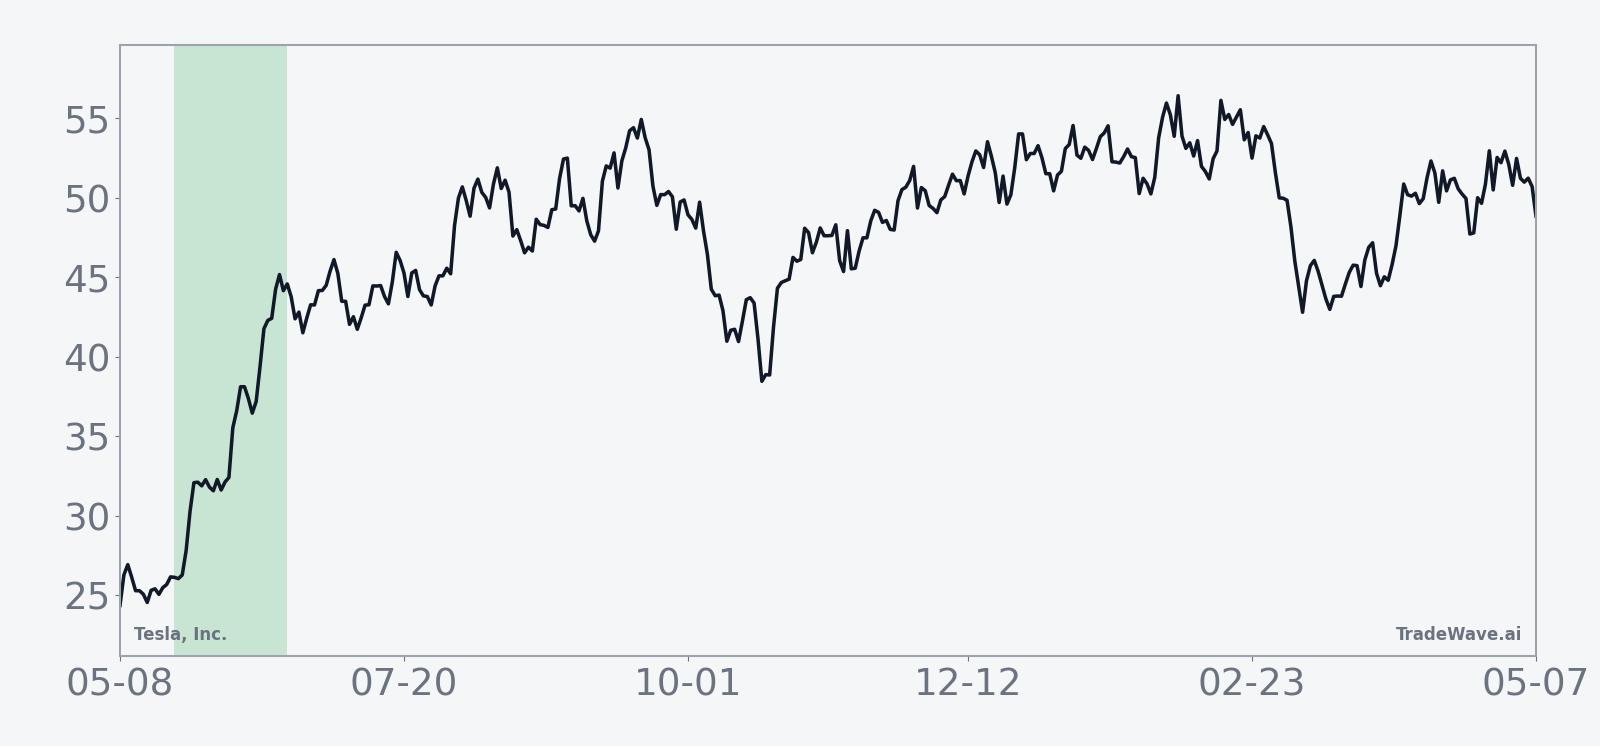
The historical seasonal average trend for this window shows gains building steadily rather than spiking on a single day. The typical pattern has TSLA grinding higher through the middle of the window, with some years front-loading the move and others finishing strong, but the composite line slopes upward across most of the 30-day span.
A closer look at yearly net returns alongside peak rallies and worst drawdowns shows how often TSLA has swung hard inside this window.
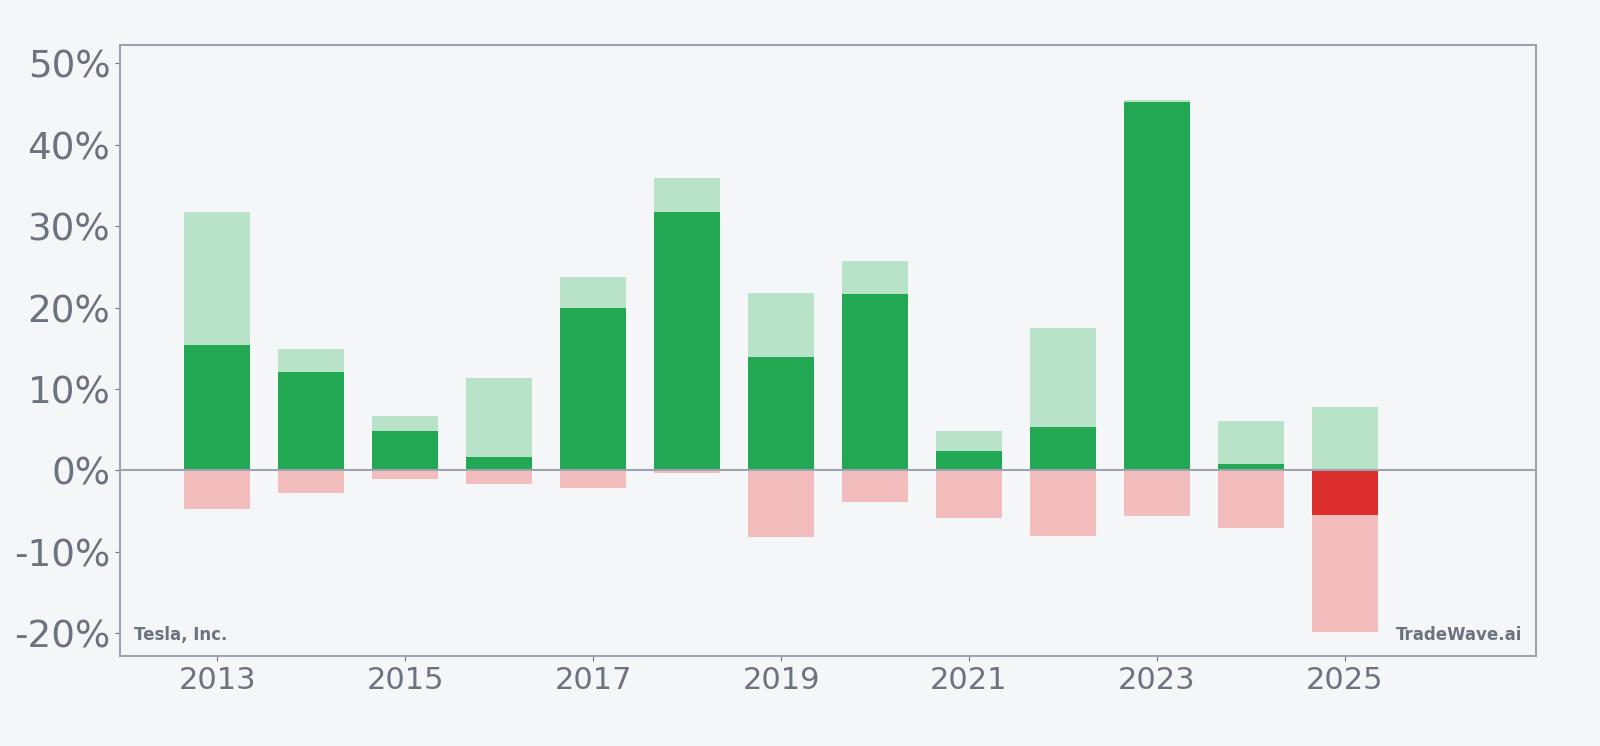
The combined net, peak favorable, and worst adverse bars show a consistent pattern of large upside potential paired with meaningful downside risk. Many years feature double-digit maximum favorable moves that far exceed the final net gain, while several also show mid-teens drawdowns that would have tested conviction even in windows that ultimately finished higher. History does not guarantee future results; adverse excursions (MAE) can be large even in winning windows.
Why does Tesla, Inc. (TSLA) follow this seasonal pattern?
This late-May seasonal pattern may reflect a mix of factors, including Tesla’s typical timing for product updates, investor positioning ahead of mid-year delivery data, and broader growth-stock rotations as funds rebalance into or out of high-beta names. Analysts have also pointed to options activity and retail trading interest clustering around summer months, which can amplify moves once momentum starts. None of these drivers is certain in any given year, but together they offer a plausible backdrop for why this specific Tesla, Inc. trading window has repeatedly skewed to the upside.
What is driving Tesla, Inc. (TSLA) today?
Tesla, Inc. closed at $386.42 on Apr 22, down 1.5% on the session and about 22.6% below its 52-week high of $498.83, after a volatile stretch that has seen the stock climb 6.67% over the past month. The current level comes after a year in which Tesla’s revenue growth has been offset by margin pressure, with Q3 2025 revenue rising to $28.1 billion but earnings per share slipping to $0.39, below expectations, and Q2 2025 revenue falling 12% with operating margin at 4.10%.[1]
In July 2025, Tesla reported that short interest stood at 2.48%, a modest but notable bearish positioning backdrop for a stock that often trades as a proxy for risk appetite.[1] Around the same period, the stock dropped 8.2% in a single post-earnings session on heavy volume, a reminder that even committed bulls can be forced to reassess when growth and profitability diverge.[2] Cathie Wood’s ARK Invest responded to that pullback by buying 143,190 shares, signaling that at least one high-profile investor viewed the weakness as an opportunity rather than a trend break.[2]
Fundamentally, Tesla is trying to pivot the narrative from pure electric-vehicle volume to a broader AI and robotics story. The company has highlighted plans to lean on AI hardware, robotaxis, and its Optimus humanoid robot, with internal targets calling for an oversupply of AI hardware and production of up to 1 million Optimus units by early 2026.[1] That shift is central to the bullish case that sees Tesla as a hybrid of auto, energy, and AI platform rather than a cyclical carmaker.
At the same time, the macro backdrop has turned more complicated. In December 2025, U.S. sales for Tesla dropped to a near three-year low after the expiration of key EV tax credits, underscoring how sensitive demand can be to policy shifts and incentives.[3] Intensifying competition from legacy automakers and new entrants in China and Europe has also pressured pricing and margins, forcing Tesla to balance volume growth against profitability in a way that markets have not always rewarded.
On Wall Street, the stock still carries a consensus Buy rating, with a blended price target around $510 from firms including Mizuho and Cantor Fitzgerald, a level that sits well above the current price and reflects expectations for AI and energy storage to drive the next leg of growth.[2] That target also dates back to late 2025, when the stock traded in a different range, so investors are treating it more as a directional marker than a precise waypoint.
The chart below situates the latest move in its recent multi-month context and overlays the upcoming seasonal projection.
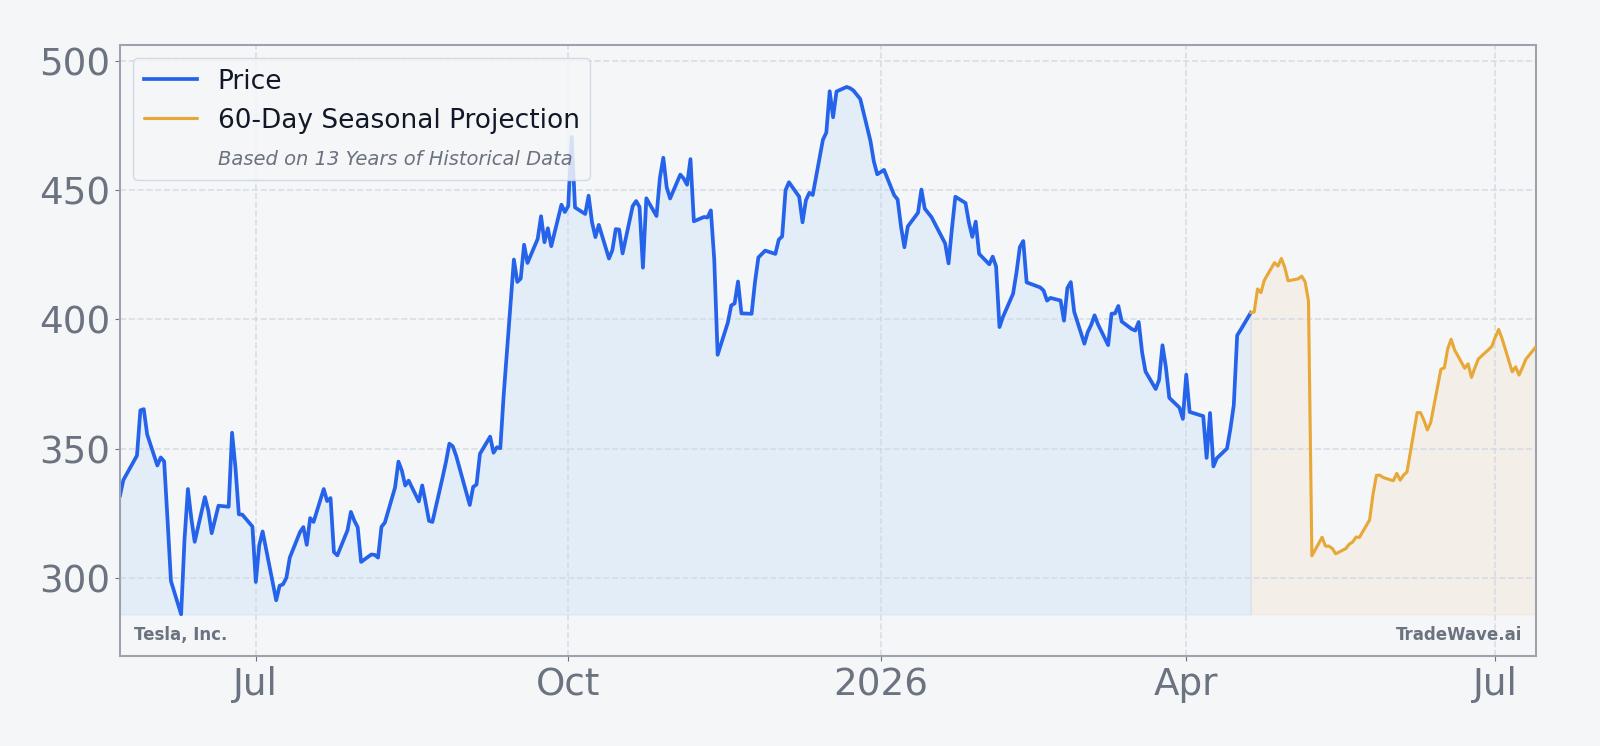
What should traders watch as the late-May window approaches?
For a stock as systemically important as Tesla, the combination of a powerful historical seasonality and a still-fragile fundamental story deserves attention. The late-May window has been one of the most consistently positive slices of the calendar for TSLA, yet the 2025 loss shows that macro and company-specific shocks can override even a strong pattern.
Into this year’s window, the first watchpoint is price behavior around the $386 level and the 50-day moving average near $390.24. Sustained trading above that band would keep the one-month uptrend intact and leave the door open for the kind of double-digit rallies that have defined many prior late-May stretches. A decisive break below the recent low near $385.22 would instead signal that sellers still control the tape heading into the seasonal window.
Second, earnings and guidance will matter more than usual. Tesla’s next scheduled earnings date is Jan 21, 2026, covering Q4 2025, and investors will be looking for signs that margin pressure is stabilizing and that AI, energy storage, and robotaxis are moving from narrative to measurable revenue and profit contribution.[1] Any shift in tone on those fronts could either reinforce or blunt the historical seasonal tailwind.
Third, traders should keep an eye on positioning and flow indicators that have flashed in the past. The July 2025 episode, when TSLA plunged 8.2% on heavy volume and short interest sat at 2.48%, showed how quickly sentiment can swing when expectations are high and results disappoint.[1][2] If another wave of high-volume selling or a renewed build in short interest appears as the window opens, it would suggest that bears are leaning into the period despite the historical pattern.
Finally, the cleanest way to track whether this year is following the script is to watch how TSLA behaves inside the window relative to its own history. In strong years, the stock has often logged early double-digit maximum favorable moves with only mid-single-digit drawdowns. A repeat of that profile would be consistent with the long-biased seasonal regime. A choppy tape with deep intraperiod selloffs and little net progress, or a repeat of 2025’s pattern of early strength followed by a sharp reversal, would signal that fundamentals and macro forces are once again overpowering the calendar.
Add it up: Tesla is heading into one of its most historically favorable 30-day stretches with a mixed fundamental backdrop and plenty of volatility still in the system. For traders, the late-May window is less a guarantee than a high-alert period where price action, flows, and news can align quickly in either direction.
Sources
About this seasonal analysis
Seasonal pattern data is sourced from TradeWave.ai, which analyzes historical price behavior across annual calendar windows going back up to 30 years. Read the full data methodology or the book The 100-Year Pattern by Afshin Moshrefi (2026 edition). Past performance of seasonal patterns does not guarantee future results. This article is for informational purposes only and does not constitute investment advice.