After 13 Weak Quarters, Target Corporation (TGT) Eyes 2026 Rebound and a Bullish Early-Summer Run
Target Corporation is heading into a 54-day early-summer stretch that has delivered gains every year for 15 years, even as the stock trades below its recent high and management works through a long sales slump.

What is the seasonal pattern for Target Corporation (TGT)?
Target Corporation has risen in 15 of 15 years during this early-summer 54-day window, with an average gain of 5.01% in winning years.
- 15 for 15 in this window, averaging 5.01% gains in winning years across the past 15 seasons.
- Seasonal window begins Jun 6, 2026 and runs for 54 trading days, covering much of the early-summer retail period.
- Percent Profitable is 100%, with 15 winners and 0 losers over the lookback period.
- Average winner gain of 5.01% compares with a cumulative return of 106% across all 15 windows.
- TradeWave Ratio of 1.88 suggests price typically travels meaningfully in the long direction within the window, while intraperiod drawdowns have still been sizable in some years.
- Sharpe ratio of 1.23 for this pattern points to a historically favorable risk-adjusted profile for long exposure during the window.
According to historical data from TradeWave.ai, this upcoming early-summer stretch has behaved very differently from an average month on the calendar for Target. The next section walks through how that pattern has played out and where the risks have shown up inside the window.
How has Target Corporation (TGT) traded in this early-summer window?
Target Corporation has posted gains in all 15 years of this 54-day early-summer window, averaging a 5.01% rise with a 106% cumulative return across the sample. The next iteration begins on Jun 6, 2026, with the stock last trading at 127.24, about 4.4% below its 52-week high of 133.09 and well above its 52-week low near 81.56. That combination of a clean win streak and a modest gap to the high makes this slice of the calendar hard for traders to ignore.
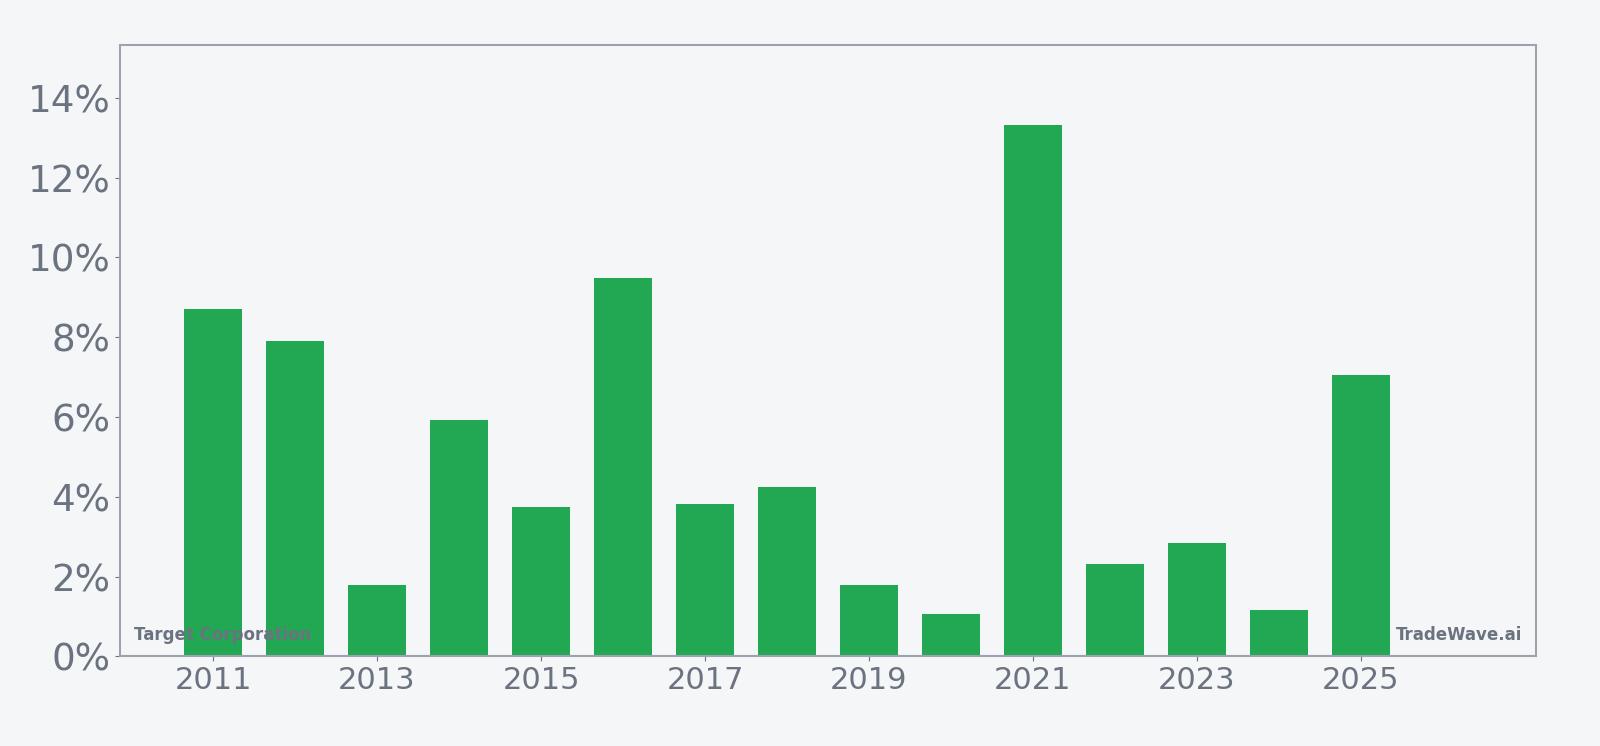
For a long-only pattern, the cleanest headline number is the 100% hit rate: 15 winners, 0 losers. Average gains of 5.01% per window sit on top of a 3.83% median profit, which tells you the distribution has a few stronger years but not just one outlier carrying the load. The strongest season in this sample came in 2021, when the stock gained 13.33% during the window, while 2016 and 2025 also posted solid advances of 9.48% and 7.05% respectively.
At the same time, the intraperiod path has not been a straight line. Maximum favorable excursions, or the best point-to-peak moves inside the window, have reached double digits in several years, including 12.45% in 2016 and 11.9% in 2025. Maximum adverse excursions, the worst drawdowns from entry, have also been meaningful at times, with early-summer pullbacks of 14.1% in 2022 and 11.03% in 2017 before the stock finished the window in positive territory.
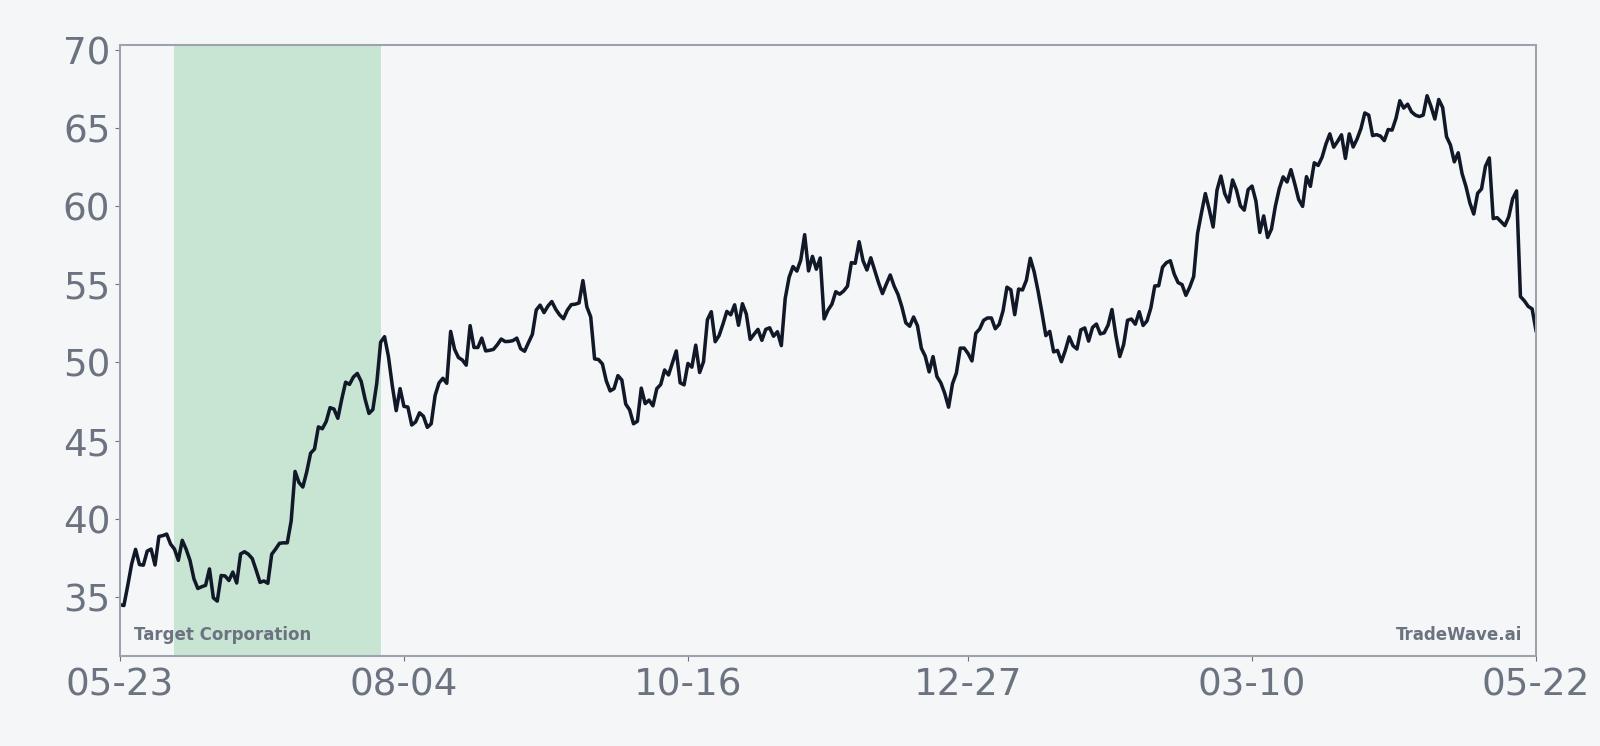
The historical seasonal average trend for this Target Corporation trading window shows a steady upward bias rather than a single explosive burst. Gains tend to build gradually across the 54 days, with only brief pauses where the average line flattens. That profile fits a pattern where multiple years contribute modest advances instead of a few giant squeezes skewing the curve.
The combined net, best-case, and worst-case bars by year show how upside and downside have coexisted inside this bullish seasonal pattern.
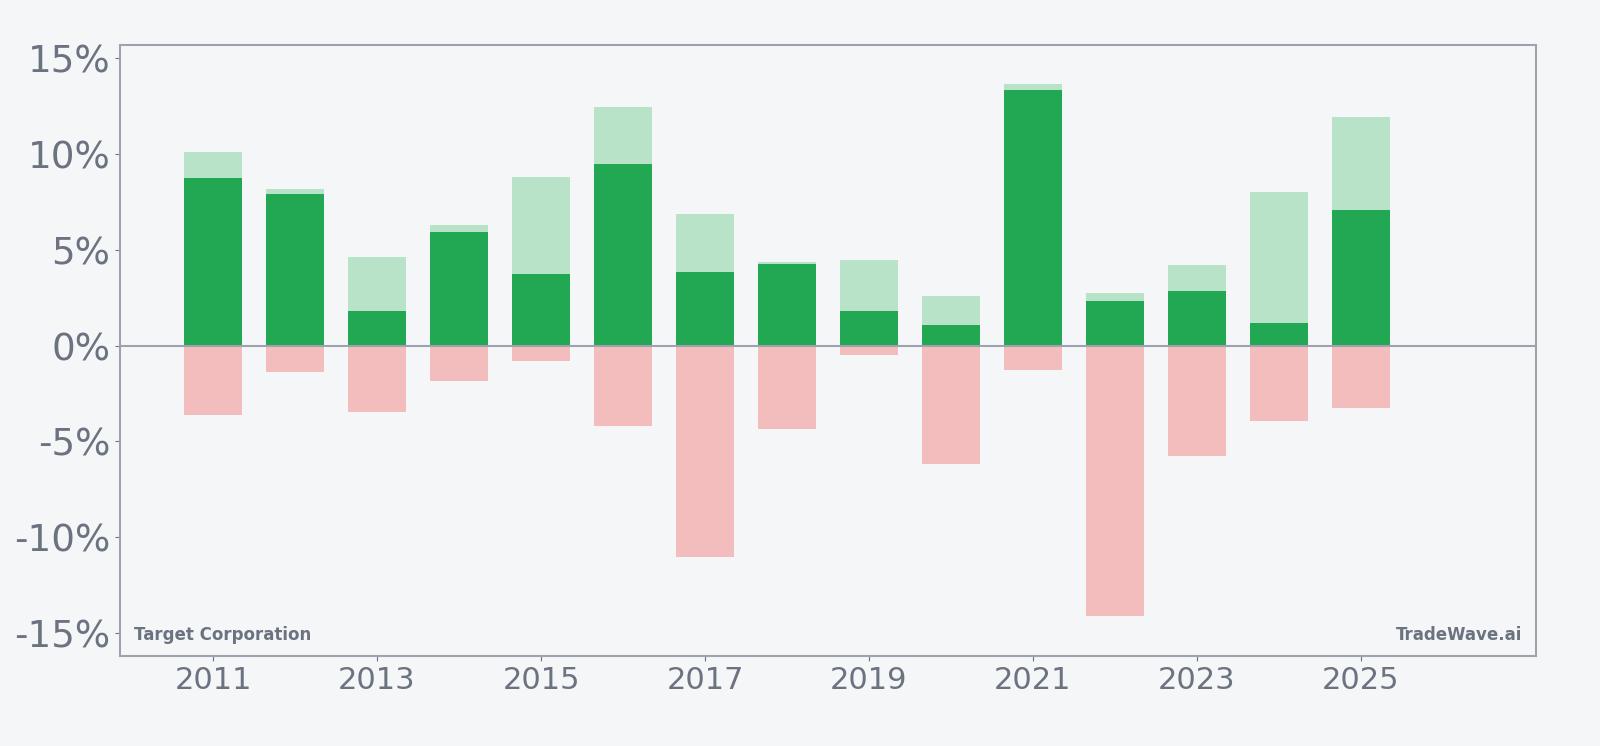
The stacked view of net returns with maximum favorable and adverse excursions makes the trade-off clear: in most years, the stock has offered several percentage points of upside travel in the trade direction, but the worst intraperiod dips have often run in the mid-single to low-double digits before recovering. Add it up: 15 straight winning windows, a 106% cumulative gain, and a Sharpe ratio of 1.23 give this early-summer stretch one of the cleaner long-side seasonal profiles in large-cap retail.
History does not guarantee future results; adverse excursions can still be large even in windows that have always finished higher.
Why does Target Corporation (TGT) follow this seasonal pattern?
This early-summer Target seasonal trend likely reflects a mix of consumer spending cycles and the company’s merchandising calendar. One likely driver is the build into back-to-school and college preparation, when retailers start setting assortments and promotions that investors try to front-run. Analysts have also pointed to institutional portfolio repositioning around midyear, as managers adjust exposure to big-box retail ahead of the second-half holiday push.
What is driving Target Corporation (TGT) today?
Target shares last changed hands at 127.24, up 2.3% on the day and sitting about 4.4% below the 52-week high of 133.09 while holding well above the 52-week low near 81.56. The stock has been trying to stabilize after a long stretch of weak sales, including 13 consecutive quarters of soft or declining revenue that culminated in Q4 2025 results reported on Mar 2, 2026, when management again flagged pressure on store traffic and discretionary spending.[5]
In those Q4 and full-year numbers, comparable sales fell 2.7% in the third quarter and net sales slipped 0.9% in the second quarter, underscoring how hard it has been for the chain to regain momentum as households juggle tighter budgets.[4][5] The company has been restructuring its workforce, including a plan announced on Oct 24, 2025 to eliminate about 1,800 corporate roles, with 1,000 of those through layoffs, as incoming CEO Michael Fiddelke looks to streamline operations and revive growth.[2][5]
Target’s sector backdrop has not been easy either. The retailer has been losing share to Walmart in groceries and delivery, and over the past year its stock performance has lagged an industry group that managed to grow while Target’s shares fell sharply.[2] At the same time, the company remains exposed to a choppy tariff and import environment, where higher costs and cautious consumers have made it harder to lean on price increases without sacrificing traffic.[7] Analysts tracked by Zacks carry a consensus “Hold” rating, reflecting a wait-and-see stance as management promises a sales rebound in 2026 after trimming its full-year outlook earlier in the downturn.[2][5]
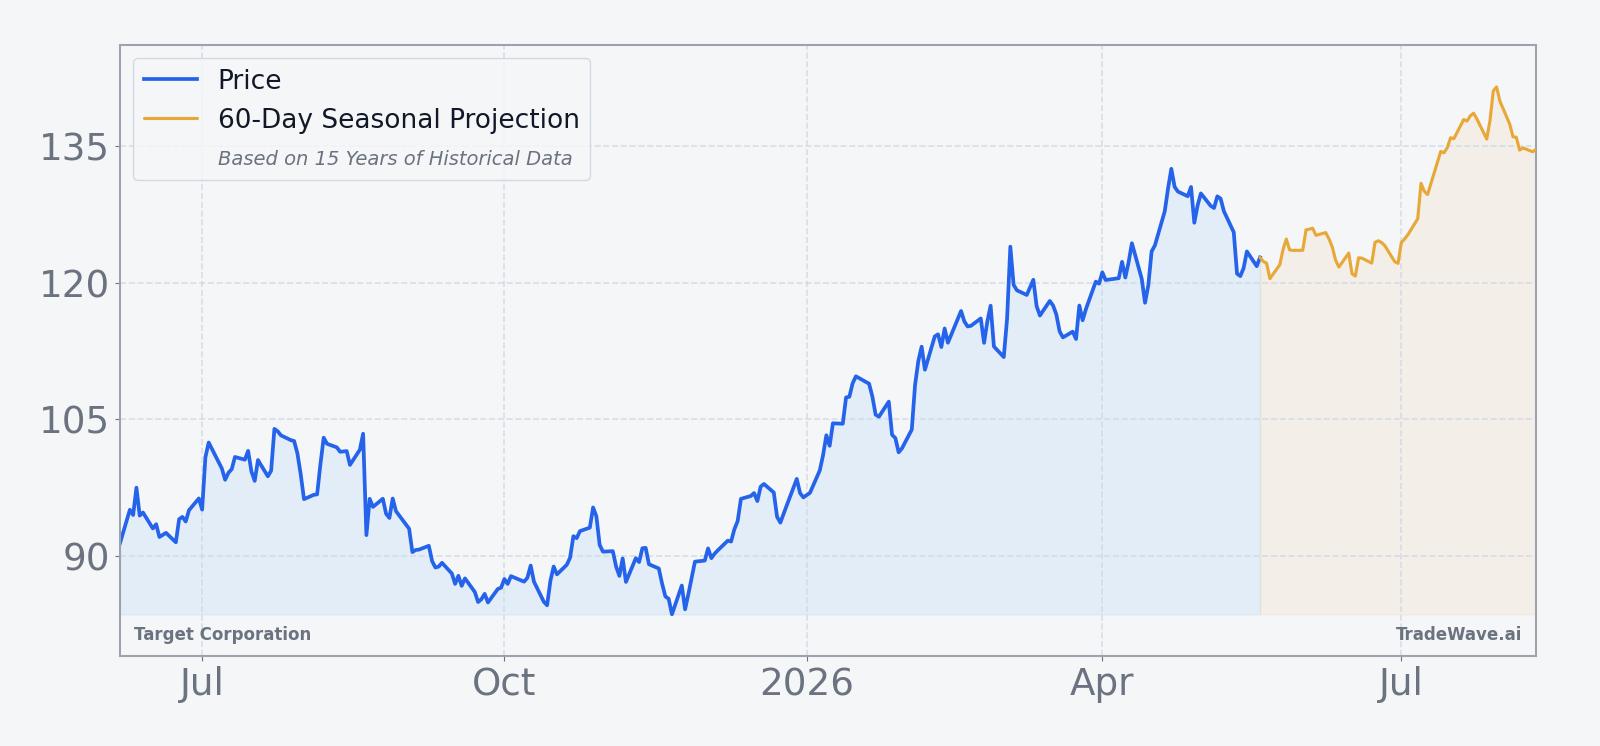
The chart below situates the latest move against the past year of trading and overlays the upcoming 60-day seasonal projection.
What does earnings guidance imply for Target Corporation (TGT)?
Target’s most recent commentary around its Q4 2025 report pointed to an expected sales rebound in 2026, even as management acknowledged that prior full-year guidance had to be trimmed when the slowdown proved more persistent than hoped.[4][5] The company has been working through 13 straight quarters of weak or falling sales, a run that has forced it to rethink merchandising, pricing, and cost structure while trying to protect its brand with core shoppers.[4][5]
Street expectations for the coming year effectively split the difference between a clean turnaround and a prolonged slump. A “Hold” consensus from Zacks suggests many analysts want to see evidence that traffic and ticket size are stabilizing before upgrading the stock.[2] For traders watching the TGT seasonal trend, that sets up an interesting backdrop: the early-summer window opens just as investors will be looking for signs in monthly sales updates and management commentary that the promised 2026 rebound is starting to show up in the numbers.
How do macro and retail trends affect Target Corporation (TGT)?
Target sits at the intersection of several macro forces that have been in flux. As a large importer, the company has had to navigate a volatile tariff landscape, where shifting trade policies can alter landed costs and squeeze margins if price increases cannot be passed through to shoppers.[7] At the same time, strained household budgets have changed how consumers allocate spending, with more dollars flowing to essentials and value channels and fewer to discretionary categories that historically carried higher margins for big-box chains.[4][7]
Within the retail sector, competition has intensified. Walmart has been gaining share in groceries and delivery, areas where Target had been investing heavily but has not yet matched its rival’s scale and price perception.[2] That competitive pressure has shown up in both traffic and stock performance, with Target’s shares down sharply over the past year while the broader industry managed to grow.[2] For the upcoming seasonal window, the macro question is whether any easing in tariffs or improvement in consumer confidence can give Target a tailwind that lines up with its historical early-summer strength.
How are investors valuing Target Corporation (TGT) into this window?
Real-time quote pages show Target trading well off its lows but still below prior peaks, a level that reflects both the damage from the multi-year sales slump and some optimism about a 2026 recovery.[1][5] With the stock lagging peers over the past year and analysts clustered around a “Hold” stance, the market is effectively pricing in a gradual repair story rather than a rapid snapback.[2][5] That leaves room for sentiment to shift if the company can string together better quarters, especially if those improvements coincide with a calendar stretch that has historically favored long exposure in TGT.
What should traders watch in this Target Corporation (TGT) seasonal window?
For this 54-day early-summer Target Corporation trading window, the first thing to watch is how the stock behaves as Jun 6 approaches. A firm base above the recent lows and a push back toward the 52-week high near 133 would fit the historical pattern of steady gains, while a break back toward the low 120s or below would signal that macro and company-specific headwinds are still in control.
Second, earnings and sales updates will matter. Any signs that comparable sales are stabilizing after 13 weak quarters, or that traffic is improving in key categories, would give fundamental backing to a bullish seasonal setup.[4][5] Conversely, another disappointing update could test how resilient this historical seasonality is when the narrative remains negative.
Third, traders should keep an eye on sector and macro headlines around tariffs, import costs, and competitive moves from Walmart and other big-box peers.[2][7] If those stories tilt in Target’s favor during the window, they could amplify the historical upside bias; if they break the wrong way, they could turn what has been a smooth seasonal climb into a choppier ride with deeper intraperiod drawdowns.
Finally, behavior inside the window itself will be telling. A familiar pattern of early dips followed by recoveries and higher highs would echo prior years where maximum adverse excursions were uncomfortable but ultimately gave way to gains. A failure to bounce from those dips, or a rare close of the window in the red, would mark a clear break from a 15-year TGT seasonal trend that has so far been one-way.
Sources
- [1] CNBC, "Check out Target Corp's stock price (TGT) in real time" (Dec 23, 2025).
- [2] Nasdaq, "Target Restructures Workforce: Will the Bold Move Pay Off?" (Oct 24, 2025).
- [4] MarketWatch, "Target sales disappoint as store traffic and spending decline" (Nov 19, 2025).
- [5] WSJ, "Target Sales Just Fell Again. Now Its New CEO Plans for Turnaround." (Mar 3, 2026).
- [7] CNBC, "Check out Target Corp's stock price (TGT) in real time" (tariff and consumer context) (Dec 23, 2025).
About this seasonal analysis
Seasonal pattern data is sourced from TradeWave.ai, which analyzes historical price behavior across annual calendar windows going back up to 30 years. Read the full data methodology or the book The 100-Year Pattern by Afshin Moshrefi (2026 edition). Past performance of seasonal patterns does not guarantee future results. This article is for informational purposes only and does not constitute investment advice.