9-of-10 Midterm June Slides: Valero Energy (VLO) Nears an 8-Day Window Favored by Shorts
Valero Energy is hovering just below its 52-week high as an 8-day midterm-year June window with a strong downside bias approaches.

What is the seasonal pattern for Valero Energy (VLO)?
Valero Energy has fallen in 9 of 10 midterm-year June windows during this 8-day stretch, with an average 4.4% gain in winning years for the short side.
- 9 for 10 in this window, with the short side averaging 4.4% gains in winning years.
- Seasonal direction is bearish for VLO from Jun 3 over an 8-day trading window in midterm election years.
- Percent Profitable is 90%, with 9 winners for shorts and just 1 losing year across the sample.
- Average outcome across all years is a 4% move in favor of the short, showing only modest dilution from the lone loss.
- Intraperiod swings have included double-digit drawdowns in some years, so adverse moves against shorts can still be sharp.
- The pattern sits in the mid part of the midterm election year, a phase that often brings choppier trading for cyclicals like refiners.
According to historical data from TradeWave.ai, this early June stretch has behaved very differently from an average month for Valero Energy, and the next iteration is now just weeks away.
How has Valero Energy (VLO) traded in this midterm-year June window?
Valero Energy has moved in favor of the short side in 9 of the last 10 midterm election years during the 8 trading days starting Jun 3, with shorts gaining an average 4.4% in winning years. Today the stock closed at $262.02, up 1.4% on the session and sitting about 0.3% below its 52-week high of $262.89.[1]
Grouping the data by the presidential election cycle matters here because this pattern only looks at the last 10 midterm election years, a phase that often brings policy uncertainty, shifting fiscal expectations and more volatile trading in economically sensitive sectors like energy refiners.
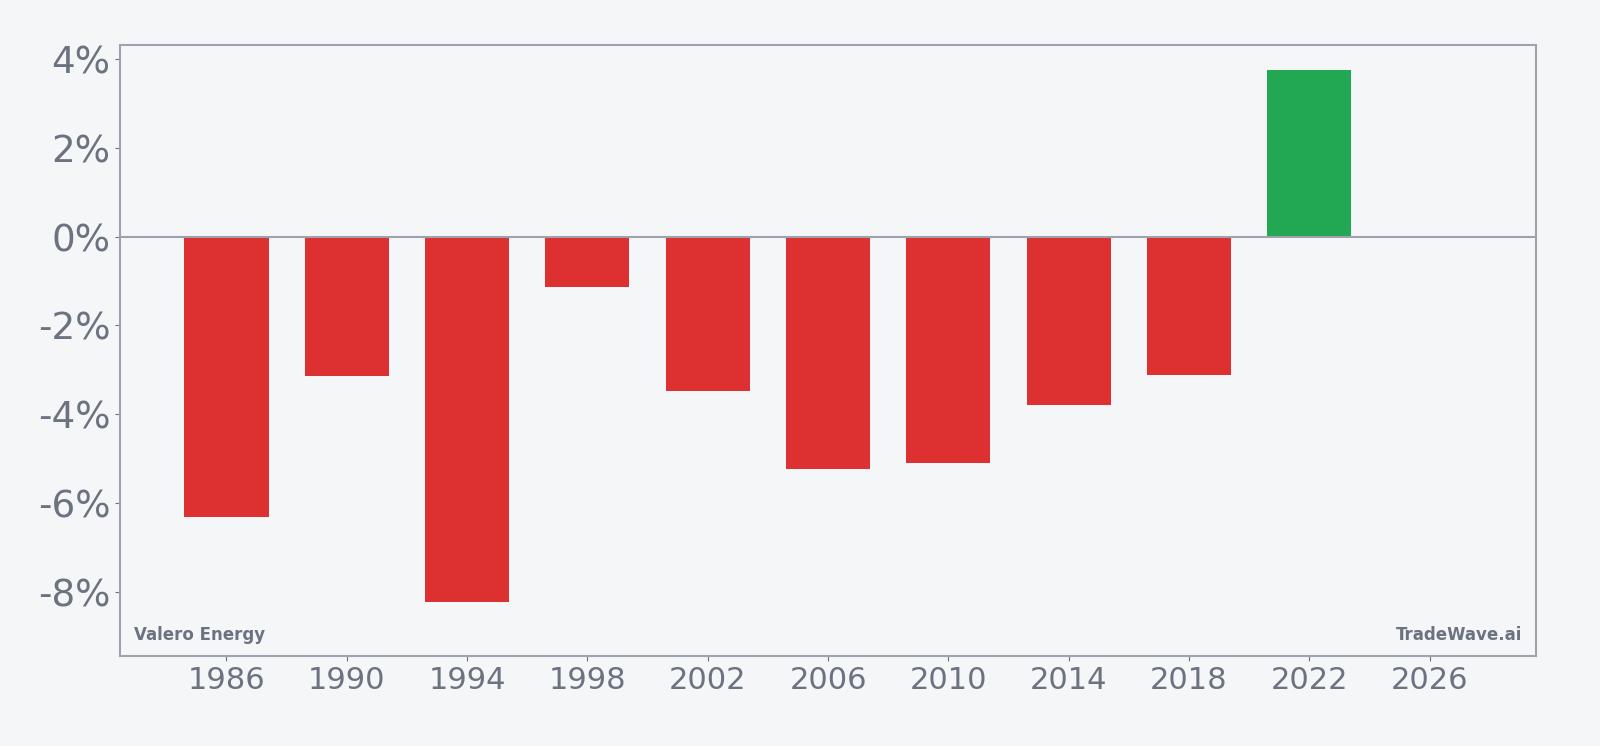
Across those 10 midterm-year samples, the short side has been favored in 9 years, with only 2022 posting a loss for shorts as VLO rallied 3.76% during the window. The median move is a 3.64% gain for shorts, close to the 4.4% average winner, which suggests the distribution of profitable years is fairly tight rather than dominated by a single outlier. When the lone losing year is included, the all-years average still shows a 4% move in favor of the short direction, so the one squeeze has not erased the broader pattern.
The per-year table shows some sizable downside stretches for the stock in this early June window. The weakest year for shorts was 2022, when VLO climbed 3.76% and never traded meaningfully below the entry level during the window, so the maximum adverse move for shorts was effectively zero. On the other side, 2010 stands out as a strong year for the pattern, with the stock falling 5.11% over the window and experiencing a worst intraperiod drawdown of 10.77% against longs, which was favorable for the short setup.
Trend metrics also lean toward consistent downside pressure in this slice of the calendar. The long-trend score is 75 while the short-trend score is 0, which means the typical path within the window has been a steady drift lower rather than a choppy back-and-forth. A shorter-horizon trend view shows a similar skew, with the long-trend1 reading at 69 and short-trend1 at 0, again pointing to a pattern where weakness tends to build rather than reverse quickly.
Yearly net and peak moves highlight how far VLO has typically traveled in both favorable and adverse directions during this window.
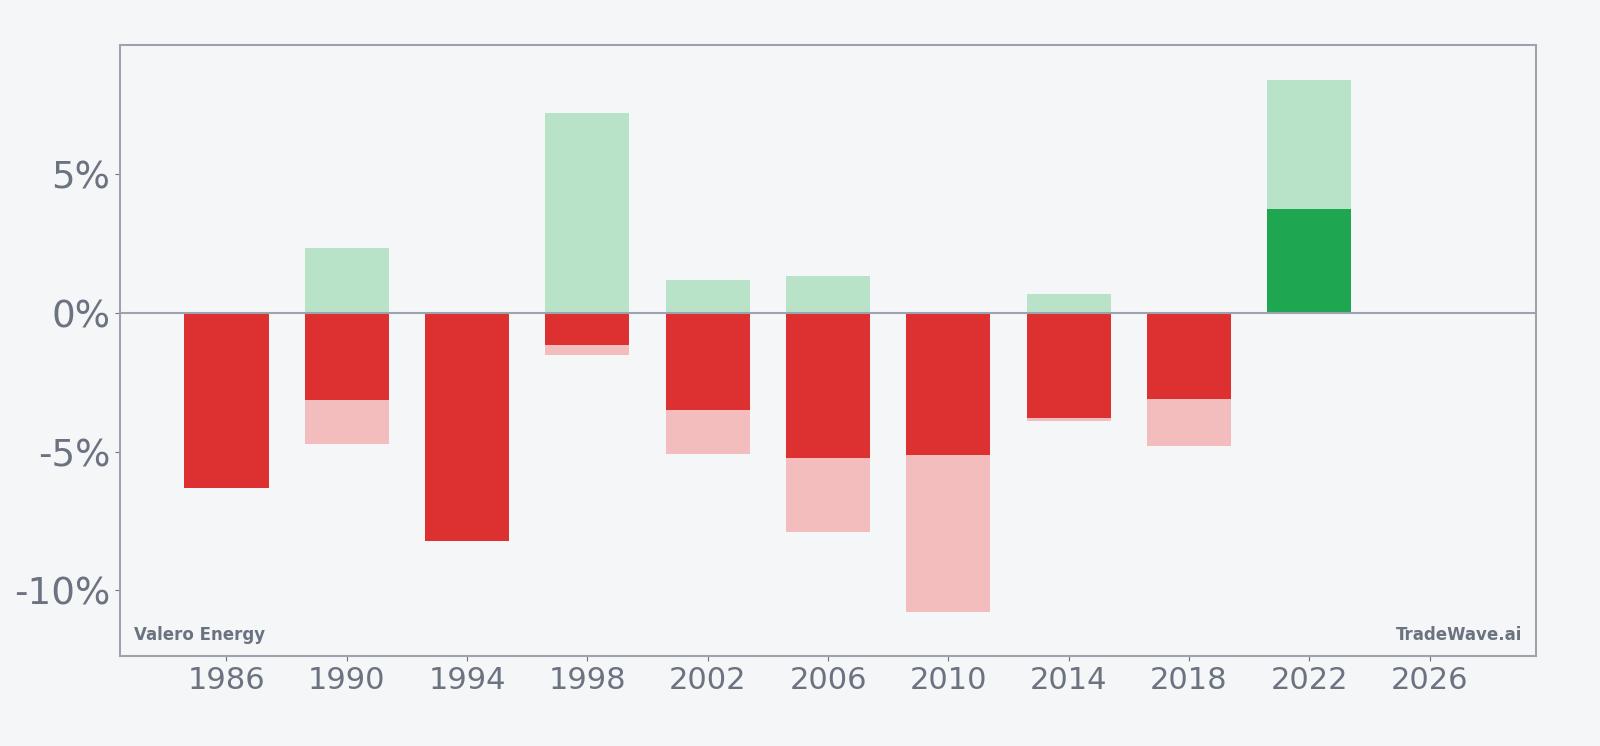
The stacked net, peak favorable move and worst drawdown bars show that even in years where the short side ultimately won, VLO sometimes moved against the trade before rolling over. Several years feature meaningful maximum adverse excursions, including 2010 and 2006, where the stock first pushed higher before sliding into negative territory by the close of the window. That mix of strong net results for shorts and sizable intraperiod swings is consistent with a TradeWave Ratio of 1.65, which signals that price often travels a fair distance in the trade direction during the window.
History does not guarantee future results; adverse excursions can still be large in this window even when the short side ultimately wins.
Why does Valero Energy (VLO) follow this seasonal pattern?
One likely driver is the way midterm election years cluster policy headlines and macro uncertainty into late spring and early summer, which can weigh on cyclical stocks just as investors reassess risk. For refiners specifically, this early June stretch often coincides with shifting expectations around summer driving demand, crude supply and refining margins, which can trigger position adjustments in names like Valero. The pattern may also reflect institutional portfolio rebalancing as funds react to first-half performance and tweak exposure to energy ahead of the heart of the driving season.
What is driving Valero Energy (VLO) today?
Valero Energy shares finished Wednesday at $262.02, up 1.4% on the day and roughly 0.3% below their 52-week high of $262.89, after a strong run that has lifted the stock about 12.5% over the past month.[1] The move extends a broader rally that accelerated after a series of earnings beats in late 2025 and early 2026, when Valero reported stronger refining margins and steady throughput, reinforcing the bullish fundamental story for the refiner.[2][3]
In Jan 2026, Valero posted adjusted fourth-quarter earnings of $3.82 per share, topping expectations of $3.27 as refining margins jumped to $13.61 per barrel, up 61% year-on-year, with throughput holding at 3.1 million barrels per day.[2] In Oct 2025, the company had already surprised to the upside with third-quarter adjusted profit of $3.66 per share versus a $3.05 estimate, supported by a 44% year-on-year jump in refining margins to $13.14 per barrel and similar throughput levels.[3] Those back-to-back beats helped cement the view that limited new refining capacity and firm product demand could keep margins elevated into 2026, a backdrop that has supported the stock even as it pushes into record territory.
Sector-wide, refiners have benefited from a rebound in margins and constrained global capacity, with limited large-scale additions expected to come online in the near term.[3] Macro commentary around Venezuelan crude supply has also focused on the potential for wider heavy-light spreads and increased barrels that could add more than $600 million of earnings upside for Valero, further bolstering the fundamental case for the name in 2026.[2] Against that backdrop, the upcoming early June seasonal window stands out as a rare historical pocket where the stock has tended to trade counter to its longer-term strength.
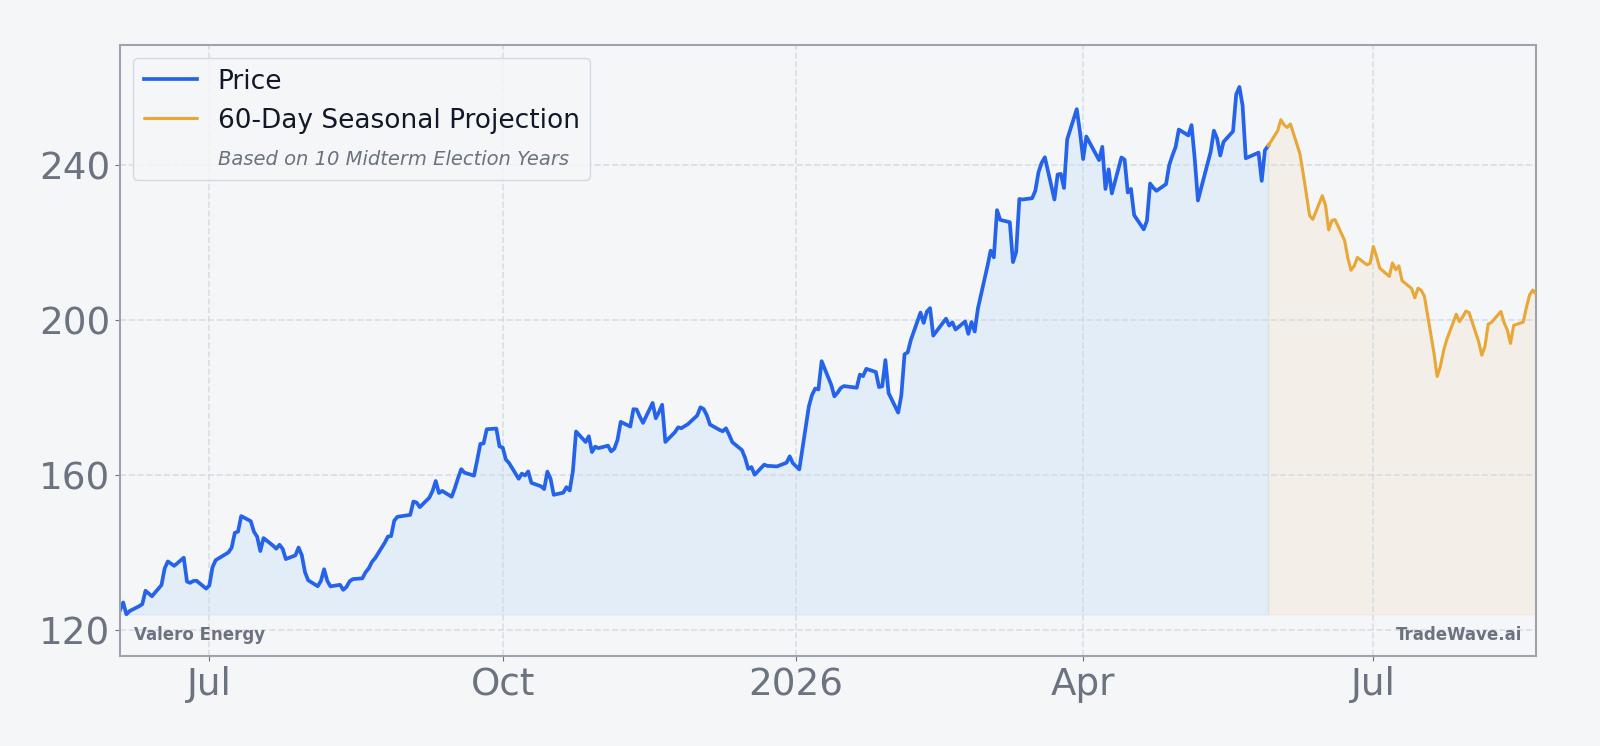
The chart below situates the latest move and the seasonal projection in Valero’s recent multi-month trading range.
What should traders watch as this seasonal window approaches?
With VLO trading just shy of its 52-week high, the key question for this midterm-year setup is whether the stock respects or defies its early June seasonal pattern. The first level to watch is the recent high around $262.89; sustained closes above that area during the Jun 3 to Jun 11 window would look very different from the typical midterm-year drift lower. A second focus is intraday volatility: in prior cycles, some of the best short years still saw sharp rallies inside the window before rolling over, so large swings against the trade would not be unusual even if the pattern ultimately holds.
Macro and policy catalysts also matter. Any fresh headlines on refining margins, product demand into the summer driving season, or changes in crude supply dynamics, including developments around Venezuelan barrels, could either reinforce or overwhelm the historical pattern.[2] Traders will be watching whether strong fundamentals and tight capacity keep buyers in control through early June, or whether profit-taking near highs lines up with the midterm-year seasonal tendency for short setups to work.
Finally, behavior inside the window will offer a clean read on how much weight the market is giving to this historical seasonality. A quick rejection from the highs with a multi-day slide would fit the 9-for-10 record for shorts. A grind higher through the window, especially on firm volume, would mark only the second clear break from this pattern in the last 10 midterm election years and could signal that the current fundamental cycle is overpowering the usual calendar effect.
Sources
About this seasonal analysis
Seasonal pattern data is sourced from TradeWave.ai, which analyzes historical price behavior across annual calendar windows going back up to 30 years. Read the full data methodology or the book The 100-Year Pattern by Afshin Moshrefi (2026 edition). Past performance of seasonal patterns does not guarantee future results. This article is for informational purposes only and does not constitute investment advice.