IBM Enters 70-Day Midterm Summer Window After Decades of Consistent Gains
IBM is heading into a 70-day midterm-year seasonal window with a perfect win record, just as shares cool off sharply from recent highs and options activity heats up.

What is the seasonal pattern for IBM (IBM)?
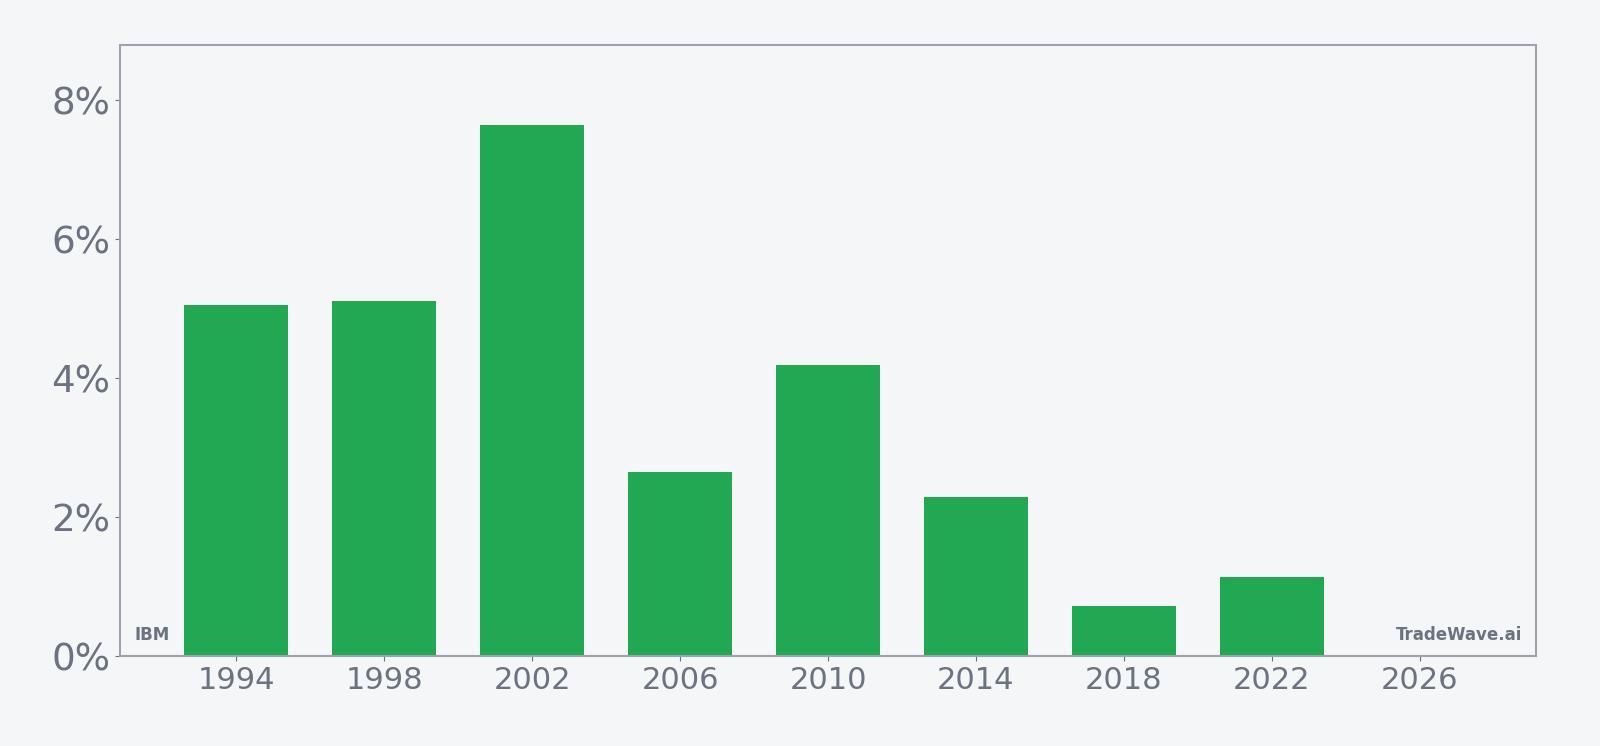
IBM has risen in 8 of 8 midterm-year summer windows starting around Jun 9, with an average gain of 3.6% in winning years.
- 8 for 8 in this 70-day midterm-year window, with average winning-year gains of 3.6% and a 32% cumulative return across cycles.
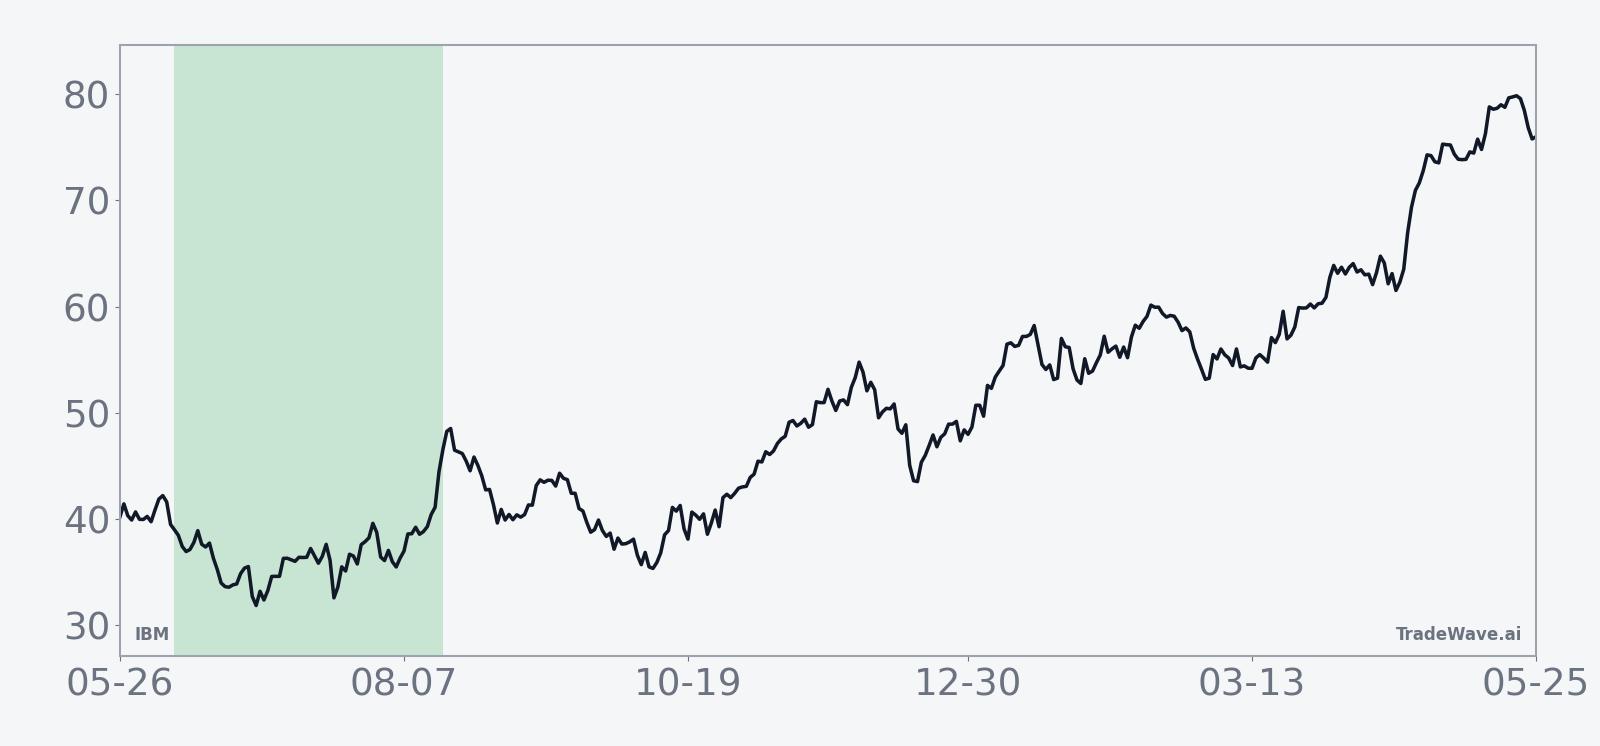
- Seasonal window runs from Jun 9 for 70 trading days, capturing the heart of the midterm-year summer for IBM.
- Percent Profitable is 100%, with 8 winners and 0 losers across the last eight midterm election years.
- Trade Direction is long, supported by a TradeWave Ratio of 1.41 and a Sharpe ratio of 1.22 for end-of-window outcomes.
- Intraperiod swings have been meaningful, with several years showing double-digit worst drawdowns even though final results were positive.
- The pattern clusters gains more in the middle and late parts of the window, while early stretches have historically been choppier.
According to historical data from TradeWave.ai, this midterm-year summer stretch has behaved very differently from an average calendar window for IBM. The next section walks through what that election-cycle pattern has looked like in past years and how it frames the coming 70 trading days.
How has IBM (IBM) traded in past midterm-year summer windows?
IBM has risen in 8 of 8 midterm election years during this 70-day summer window starting Jun 9, averaging a 3.6% gain and delivering a 32% cumulative return across those cycles. Shares finished Monday at 283.35, down 6.1% on the day and about 14.8% below the 52-week high of 332.46, after a volatile week that followed a sharp rally in May.[9] Heavy options trading tied to quantum-computing grant headlines and a bullish brokerage call has recently pushed call volume to almost 200,000 contracts, with calls outpacing puts roughly 8-to-1, signaling aggressive positioning into this stretch.[10]
Grouping the data by the presidential election cycle matters here because this window only looks at midterm election years, which often feature policy uncertainty, shifting fiscal priorities and choppy risk appetite before markets refocus on the stronger pre-election year. For a defensive enterprise software and infrastructure name like IBM, that backdrop has historically lined up with steady demand from regulated customers and less sensitivity to midterm-year macro noise.
Across the eight midterm-year samples since 1994, IBM’s seasonal trend in this window has been consistently positive but not explosive. The strongest year in the set was 2002, when the stock gained 7.65% over the 70 trading days, while the softest was 2018 with a 0.72% rise. The median outcome of 3.42% sits close to the average, which suggests the pattern is not being skewed by a single outlier year.
A second view of yearly net, best-case and worst-case moves shows how upside and drawdowns have coexisted inside this otherwise consistent pattern.
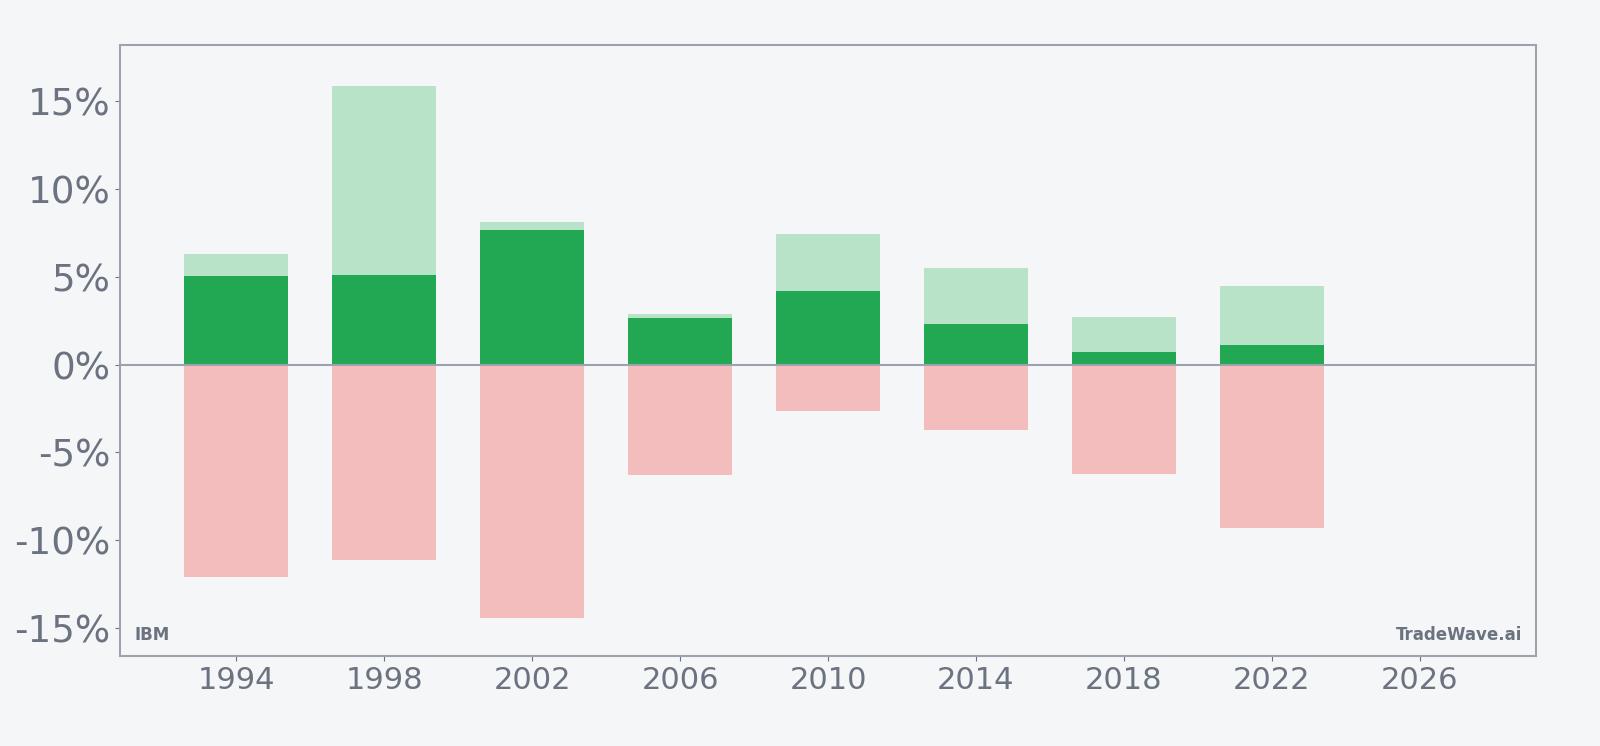
Intraperiod volatility is the catch. In 1998, IBM finished the window up 5.11%, but the best point-to-peak move reached 15.83% while the worst drawdown from entry was an 11.11% slide. In 2002, the stock ultimately gained 7.65%, yet at one point it was down 14.45% from the starting level before recovering. Even the more muted 2010 and 2014 windows saw worst drawdowns of 2.66% and 3.73% respectively, underscoring that the path to a positive finish has rarely been a straight line.
Put together, the pattern is clear: this has been a long-biased window for IBM in midterm election years, with every sample finishing in the green and average gains in the low single digits, but with enough intraday and intra-window turbulence that timing and risk management have mattered. The most important takeaway is simple. Eight for eight is a rare record for any stock pattern analysis, and IBM carries that streak into this midterm-year summer.
Why does IBM (IBM) follow this seasonal pattern?
One likely driver is the way IBM’s earnings calendar and enterprise budget cycles line up with midyear spending decisions at large corporate and government clients. Analysts have pointed to IBM’s role in hybrid cloud, AI and infrastructure projects that often get greenlit or expanded in the middle of the fiscal year, which can support orders and sentiment in this stretch.[2] The pattern may also reflect institutional portfolio repositioning in midterm election years, where investors lean into defensive, cash-generative tech names like IBM while they wait for policy clarity heading into the stronger pre-election year.[5]
History does not guarantee future results; even in windows where IBM has ultimately finished higher, adverse excursions within the period have at times been large.
What is driving IBM (IBM) today?
IBM closed Monday at 283.35, down 6.1% on the session after a volatile stretch that still leaves the stock up roughly 25% over the past month and about 14.8% below its 52-week high of 332.46.[3] The pullback follows a powerful rally that began in late May, when shares surged roughly 15% in a single session after a video of former President Donald Trump praising IBM’s role in American technology resurfaced and helped ignite momentum in the name.[9]
Fundamentally, IBM is coming off a solid first quarter in 2026, where adjusted earnings of $1.91 a share and revenue of $15.9 billion both topped expectations, but a cautious full-year outlook left some investors underwhelmed and the stock lower after the print.[3][7] Management reiterated guidance for more than 5% constant-currency revenue growth and about $1 billion of additional free cash flow this year, leaning on AI and hybrid cloud demand as key drivers, yet the market reaction showed how high expectations had become after last year’s guidance hike and AI commentary.[3][4]
At the same time, IBM has been pulled into a broader narrative around government support for strategic technologies. Reports in late May indicated the company stands to receive about $1 billion in U.S. Commerce Department grants tied to quantum computing, a potential long-term catalyst that traders quickly tried to price via aggressive call buying and heavy options volume.[8][10] One recent session saw almost 200,000 contracts trade, with calls outnumbering puts roughly 8-to-1, a skew that points to speculative upside bets layered on top of longer-term institutional positioning.[10]
Strategists say that mix of AI tailwinds, quantum optionality and a defensive enterprise software footprint has made IBM a favored way to play both the AI buildout and a more cautious macro backdrop.[2][11] That helps explain why the stock could rally hard on sentiment and policy headlines, then give back ground quickly when earnings guidance or macro worries reassert themselves. The upcoming seasonal window sits right on top of that tug-of-war between growth narratives and valuation discipline.
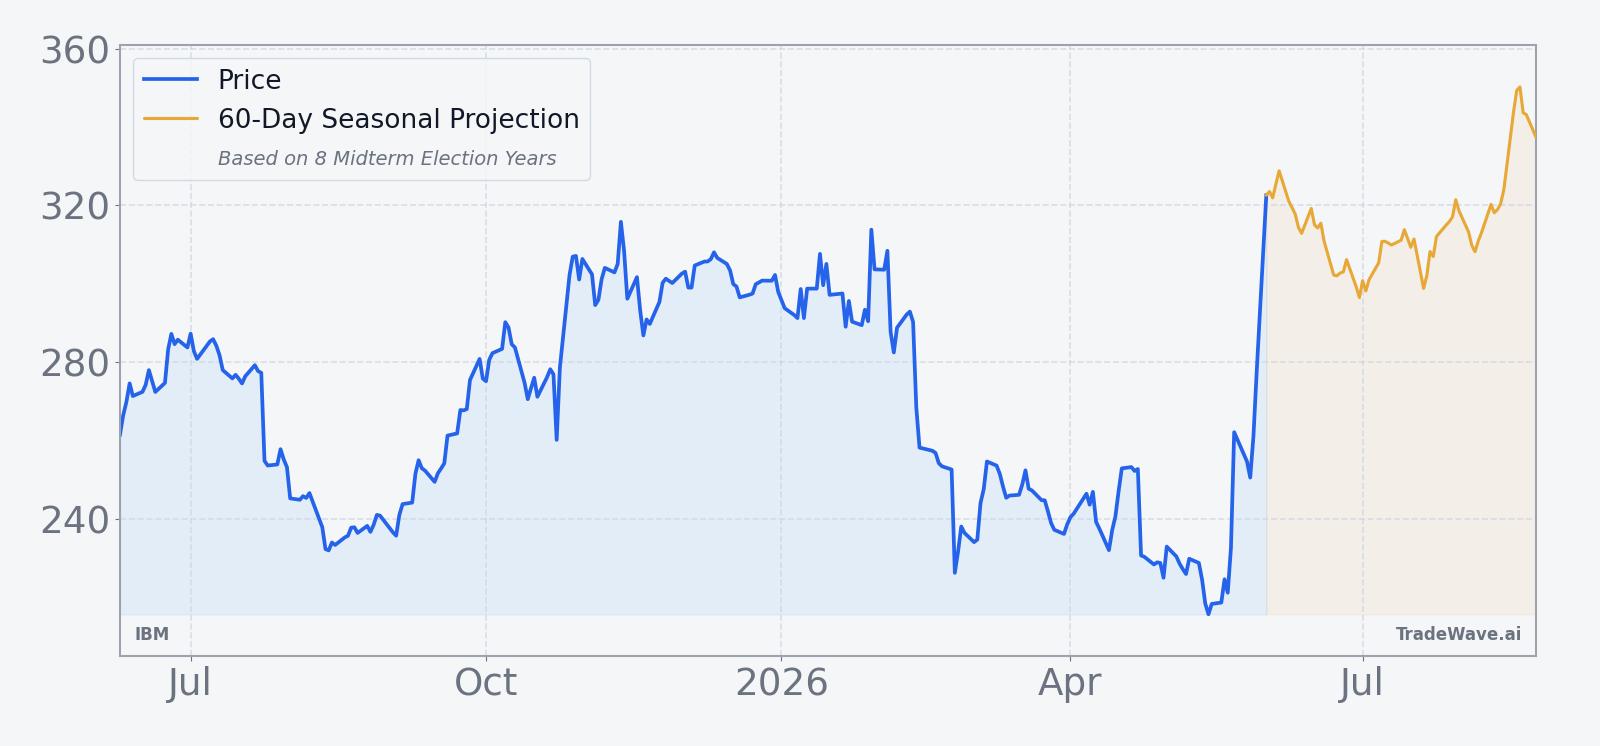
The chart below situates the latest move in its recent multi-month context, alongside a 60-day seasonal projection based on prior midterm-year summers.
What should traders watch in this IBM (IBM) seasonal window?
First, watch how IBM behaves around the 280 to 300 zone as the window opens. Historically, the strongest midterm-year summers have seen the stock stabilize early in the period before grinding higher, while deeper drawdowns have tended to occur when early selling pressure snowballed into double-digit intraperiod losses. A quick reclaim of the 300 area would fit the historical seasonal trend better than a prolonged stay near last week’s lows.
Second, keep an eye on the policy and earnings calendar. Any formal confirmation of quantum-computing grants or new AI contract wins could reinforce the growth narrative that underpinned the recent rally, especially if they arrive before IBM’s next earnings update.[3][8] Conversely, signs that enterprise software budgets are tightening or that AI projects are slipping to 2027 could test the stock’s ability to follow its usual midterm-year summer pattern.
Third, monitor whether the unusual options activity persists or fades as the seasonal window progresses. If call volume remains elevated and the call-put skew stays wide while the stock grinds higher, that would signal traders are leaning into the historical IBM trading window and using leverage to express that view.[10] If options flow normalizes or flips toward puts while the stock stalls, it would suggest the recent burst of speculative enthusiasm is cooling, which could make any intraperiod drawdowns more pronounced even if the window ultimately finishes positive.
Finally, track how IBM trades relative to the broader tech and software sector. In prior midterm election years, IBM’s historically steady seasonal trend has sometimes contrasted with more volatile moves in high-growth software names, giving portfolio managers a place to hide during policy and macro scares.[2] If that relative resilience shows up again, it would be one more sign that this midterm-year seasonal pattern is still exerting influence beneath the headlines.
Sources
- [1] CNBC, "IBM is trying to rebound after results disappointed initially. What analysts and investors are saying" (Oct 23, 2025).
- [2] MarketWatch, "IBM’s stock is sliding. Here’s why these analysts see an opportunity to buy." (Jul 24, 2025).
- [3] Yahoo Finance (GuruFocus), "IBM Stock Tumbles. Solid Quarter Can't Offset Tepid Forecast" (Apr 23, 2026).
- [4] CNBC, "IBM tops third-quarter estimates and lifts guidance, but stock drops" (Oct 22, 2025).
- [5] Forbes, "What’s Happening With IBM Stock?" (Oct 7, 2025).
- [6] MarketWatch, "Why is IBM’s stock down after an earnings beat? Here’s one quibble." (Jul 23, 2025).
- [7] Barron's, "IBM Earnings Beat Estimates. The Stock Is Still Falling." (Apr 22, 2026).
- [8] Barron's, coverage including U.S. Commerce Department quantum-computing grant reports (Apr 22, 2026).
- [9] Yahoo Finance, "IBM shares surge 15% after Trump video resurfaces" (Jun 1, 2026).
- [10] Business Insider, "IBM stock shoots higher after bullish Barclays forecast hits back at SaaSpocalypse fears" (Jun 1, 2026).
- [11] Forbes, "IBM Stock Isn't Dying. It's On Sale" (Feb 24, 2026).
About this seasonal analysis
Seasonal pattern data is sourced from TradeWave.ai, which analyzes historical price behavior across annual calendar windows going back up to 30 years. Read the full data methodology or the book The 100-Year Pattern by Afshin Moshrefi (2026 edition). Past performance of seasonal patterns does not guarantee future results. This article is for informational purposes only and does not constitute investment advice.