IBM Near Record Highs After Rising in All Recent Midterm Summer Windows
IBM is trading near record highs as it approaches a 70-day midterm-election-year seasonal window that has never produced a loss, adding a historical layer to AI and quantum-driven momentum.

What is the seasonal pattern for IBM (IBM)?
IBM has risen in 8 of 8 midterm-election-year summer windows during this 70-day stretch, with an average gain of 3.6% in winning years.
- 8 for 8 in this window, with IBM averaging 3.6% gains across winning years in midterm-election cycles.
- The upcoming 70-day IBM trading window starts on Jun 9, 2026 and runs through late August in the midterm election year.
- Percent Profitable is 100%, with 8 winners and 0 losers across the last eight midterm-election-year samples.
- Average winner gains of 3.6% come alongside a TradeWave Ratio of 1.41, showing meaningful intraperiod travel in the trade direction.
- The Sharpe ratio of 1.22 points to a historically favorable risk-adjusted profile for this IBM seasonal trend.
- Past windows still saw sizable drawdowns inside the trade, so IBM’s historical seasonality has combined upside bias with real volatility.
According to historical data from TradeWave.ai, IBM’s behavior in midterm-election summers has followed a distinct pattern that differs from its average year-round trading. The next section looks at how that election-cycle seasonality lines up with today’s price and policy backdrop.
How has IBM (IBM) traded in past midterm-year summer windows?
IBM has risen in every one of the last eight midterm-election-year summer windows, averaging a 3.6% gain over each 70-day stretch that begins around Jun 9. Shares last traded at about $320, leaving the stock roughly 2.3% below its 52-week high of $327.89 after a powerful run that has already delivered a 40.03% gain over the past month.[9]
Grouping IBM’s seasonal behavior by the presidential election cycle matters because midterm years often bring a different policy and liquidity mix than election or pre-election years. In midterm summers, Washington tends to be focused on spending debates and regulatory positioning rather than fresh stimulus, which can shape how large-cap tech and enterprise software names trade around earnings and capital spending plans.
This specific IBM seasonal window begins on Jun 9 and spans 70 trading days, covering most of the summer in the midterm election year. Historically, the trade direction has been long, with IBM finishing higher in all eight midterm-year samples captured in the dataset. The 100% Percent Profitable record, with 8 winners and 0 losers, is unusual for a single stock over this many cycles and gives this IBM seasonal trend more weight than a typical calendar quirk.
Average profit across those winning years is 3.6%, while the median outcome is close at 3.42%, suggesting the distribution of returns has been fairly tight around a modest upside bias. The cumulative return across all eight windows is 32%, which reflects how these midterm-year slices have stacked over time when viewed as a repeated IBM trading window rather than isolated one-offs. A Sharpe ratio of 1.22 indicates that, on a risk-adjusted basis, this pattern has historically delivered more reward per unit of volatility than a random 70-day stretch in the stock.
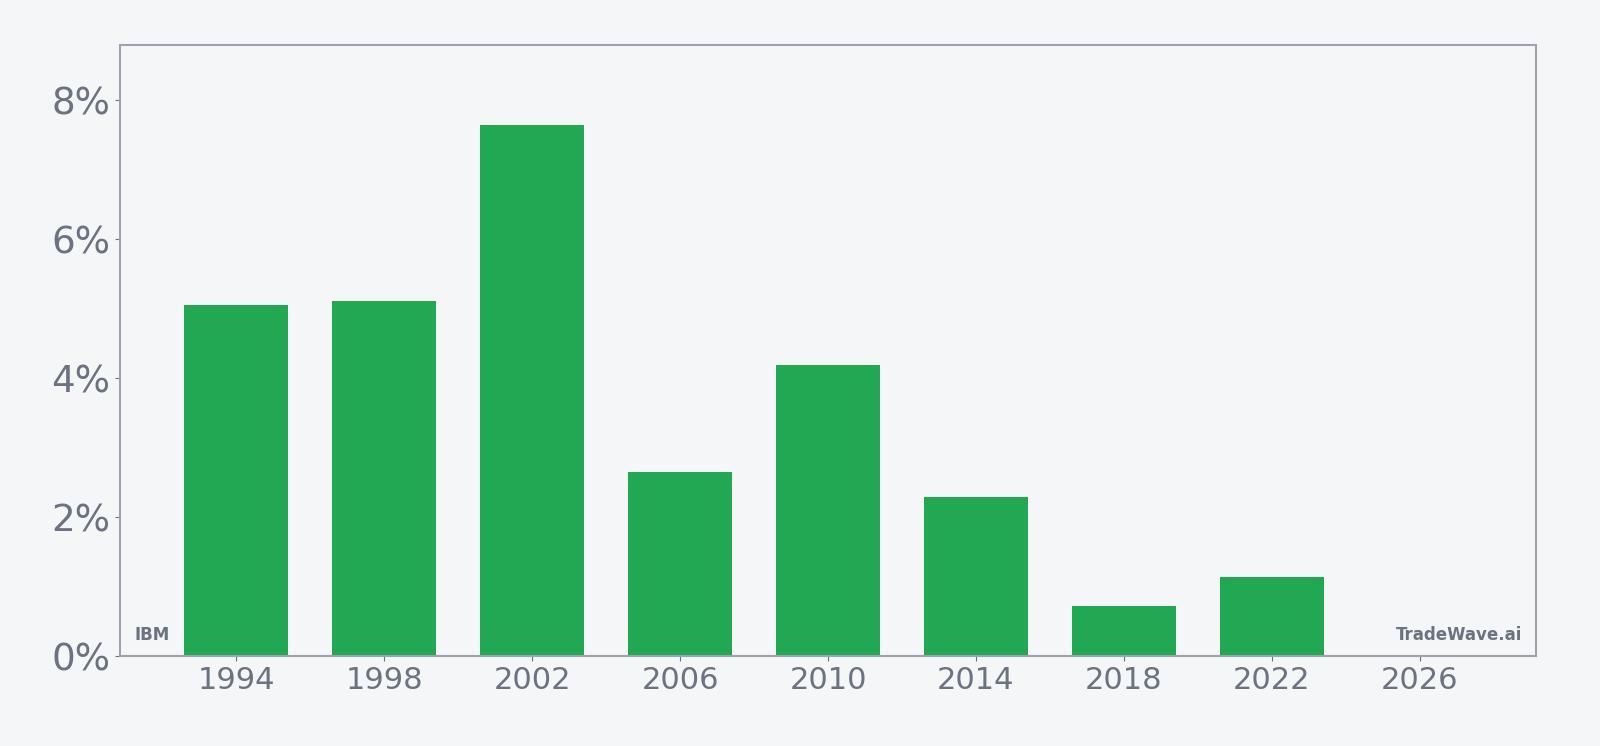
The per-year table shows that the strongest midterm-year window came in 2002, when IBM gained 7.65% between the entry and exit dates, while the softest still-positive outcome was 0.72% in 2018. In several years, such as 1998 and 2010, the maximum favorable move inside the window reached 7% to nearly 16%, even though the final net gain was smaller, which is where the TradeWave Ratio of 1.41 comes from. That metric captures how far price typically travels in the trade direction within the window, independent of where it closes.
Intraperiod risk has been real. In 1994 and 2002, the worst drawdowns from entry, or maximum adverse excursions, were around 12% to 14% even though the windows ultimately finished in the green. That profile fits a pattern where IBM’s midterm-year summer windows have often seen traders pushed out by volatility before the final move higher. In more recent cycles like 2010 and 2014, the worst drawdowns were closer to 3% to 4%, suggesting somewhat more contained downside in those years.
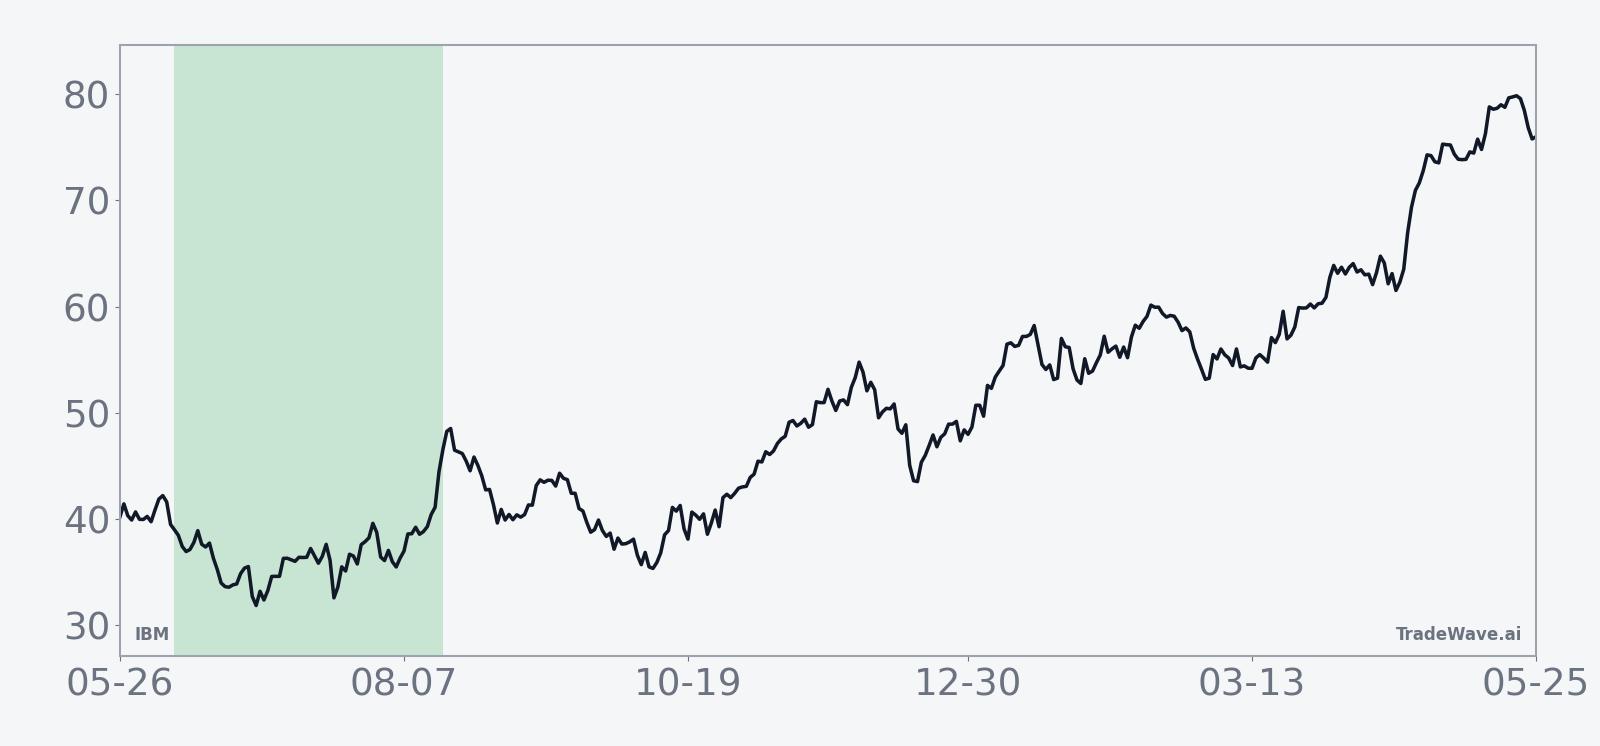
The historical seasonal average trend for this IBM trading window slopes higher for most of the 70 days, with gains tending to build gradually rather than in a single spike. The curve suggests a pattern where early choppiness gives way to a steadier climb into the back half of the window, which lines up with the idea that midterm-year policy noise often peaks early in the summer before fading.
A second view that layers net returns with peak run-ups and worst drawdowns shows how upside and downside have coexisted inside this IBM seasonal pattern.
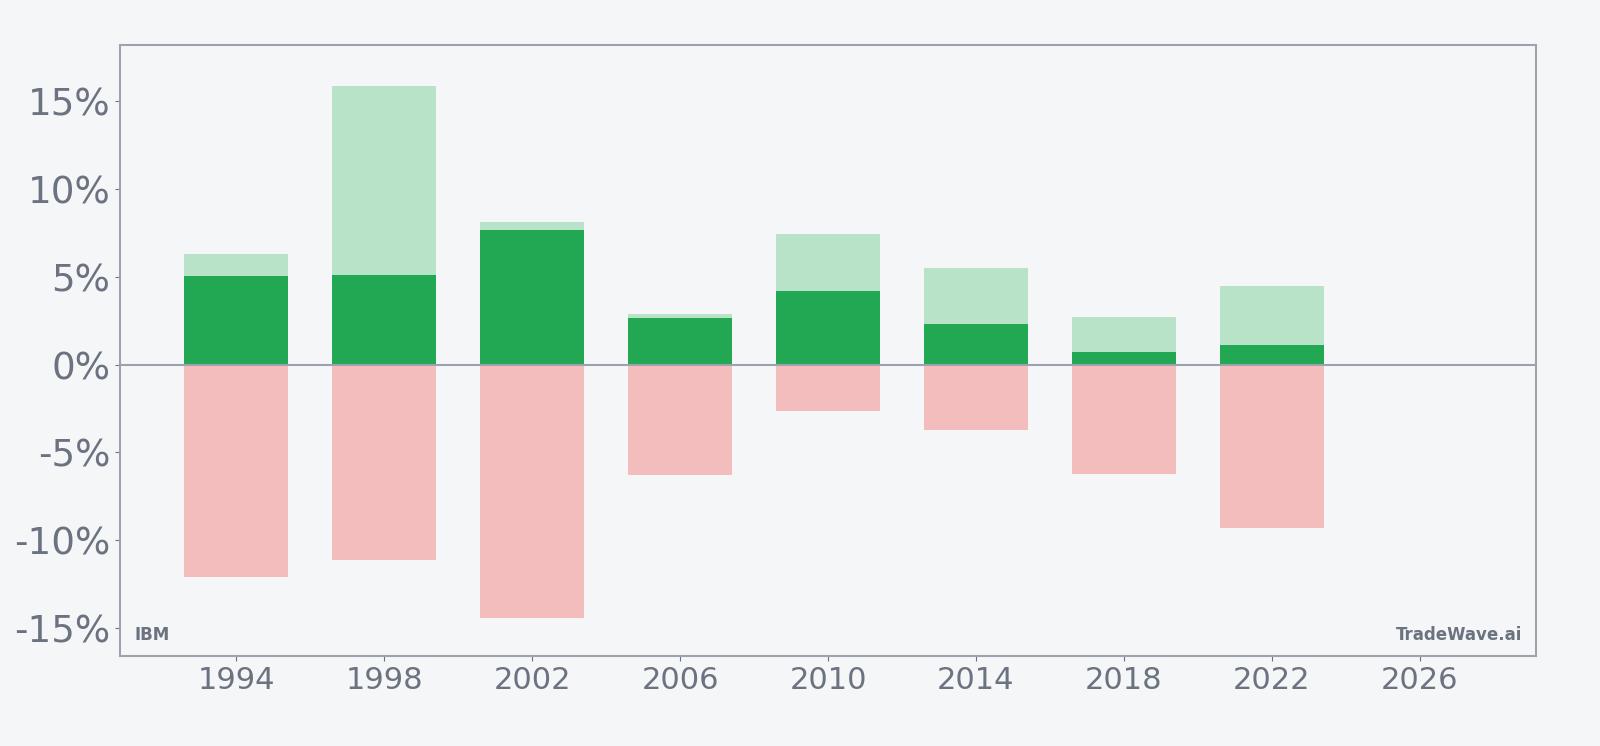
The combined net/MFE/MAE bars show that in most years IBM’s maximum favorable move inside the window has been several percentage points above the final net gain, while maximum adverse excursions have sometimes reached mid-single to low-double digits. That mix of solid upside potential and meaningful drawdowns is what makes this IBM seasonal window both attractive and demanding from a risk-management standpoint. Add it up: eight for eight winning windows, but with enough intraperiod volatility that timing and position sizing have mattered.
History does not guarantee future results, and even in a historically strong IBM seasonal window, adverse excursions can be large before any eventual gains materialize.
Why does IBM (IBM) follow this seasonal pattern?
One likely driver is the way IBM’s earnings calendar and enterprise spending cycles line up with midterm-election summers, when CIOs often finalize second-half budgets and large software or infrastructure deals. Analysts have also pointed to institutional portfolio repositioning around midyear, as funds adjust exposure to AI, hybrid cloud and quantum themes that feature IBM as a core holding.[3] The midterm policy backdrop, including debates over technology regulation and government funding, may further concentrate investor attention on IBM during this stretch, reinforcing the historical seasonality.
What is driving IBM (IBM) today?
IBM closed at $318.73 on Jun 1, up 7.0% on the day, and traded around $320.42 on Tuesday, leaving the stock about 2.3% below its 52-week high of $327.89 after a 40.03% surge over the past month.[9] The latest leg higher has been fueled by a mix of AI optimism, solid earnings execution and a political twist that briefly put the company in the middle of the national conversation.[3][7][9]
On Apr 23, IBM reported first-quarter 2026 results that beat on both revenue and adjusted EPS, while reiterating guidance for more than 5% constant-currency revenue growth and roughly $1 billion in incremental free cash flow.[3] That followed a strong 2025, when IBM topped third-quarter estimates and raised full-year revenue and free cash flow guidance as its AI book of business surpassed $9.5 billion, underscoring the company’s pivot toward software and hybrid cloud.[4] The earnings cadence has helped underpin the stock’s climb even as some investors worry about how much AI enthusiasm is already priced in.
Macro themes are adding fuel. AI adoption remains a central driver for enterprise IT budgets, and IBM’s positioning in hybrid cloud, Red Hat and Watsonx has kept it in the conversation alongside larger hyperscalers.[4][5] At the same time, reports that IBM could receive about $1 billion in U.S. Commerce Department grants to support quantum computing have turned the stock into a proxy for government-backed next-generation infrastructure, a narrative that has resonated with investors looking for policy-supported growth stories in the midterm election year.[8]
That quantum funding story has also shown up in the derivatives market. Coverage of the grant potential has highlighted heavy options activity, with roughly 200,000 contracts trading and at least one trader reportedly buying large long-dated calls, a sign that some investors are using leverage to express bullish views on IBM’s longer-term upside.[8] For a stock that has already rallied sharply, that kind of unusual options flow can amplify both upside and downside swings if sentiment shifts.
More tactically, IBM’s latest spike followed a Jun 1 report that shares had surged about 15% after a resurfaced video featuring former President Donald Trump, which traders interpreted as supportive for the company’s perceived policy and contract outlook.[9] On the same day, a bullish note from Barclays framed IBM as a relative safe haven in software, arguing that fears of a “SaaSpocalypse” were overdone and that IBM’s quantum and AI optionality were underappreciated.[11] Together, those catalysts helped pull in fresh momentum money just days before the historical seasonal window is set to open.
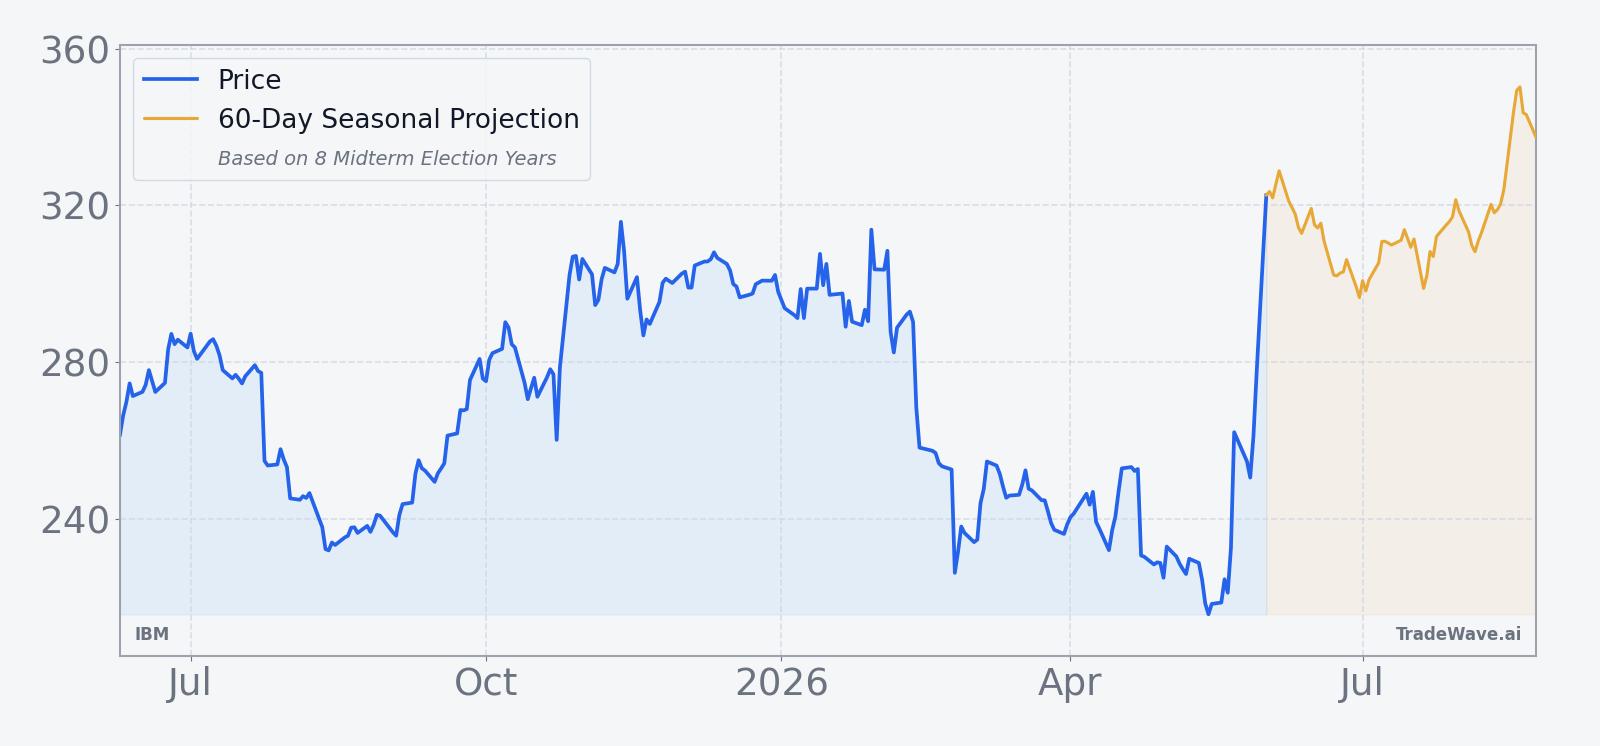
The chart below situates the latest move in its recent multi-month context and overlays the 60-day seasonal projection tied to the upcoming window.
What should traders watch as IBM enters this seasonal window?
First, the calendar. The 70-day IBM trading window tied to midterm-election summers begins on Jun 9, so any pullback or consolidation into that date would occur just as the historical seasonality flips on. Traders watching this IBM seasonal trend will be looking to see whether the stock can hold above the recent breakout zone around $300 to $310, or whether profit-taking after the 40% one-month run cuts deeper than in prior cycles.[9]
Second, the policy and funding tape. Progress on the Commerce Department’s quantum grant process, or any new AI-related government initiatives, could either reinforce or undercut the historical pattern depending on timing and tone.[8] In past midterm years, IBM’s seasonal window has overlapped with periods when Washington headlines quieted down, allowing fundamentals and capital spending plans to drive the stock. If this year’s midterm proves noisier, the intraperiod drawdowns could look more like the double-digit MAE years in the historical sample.
Third, the options market. The recent burst of heavy, bullish options activity tied to the quantum story is a clear Special Insight for this cycle, because it shows leveraged positioning building into a historically strong seasonal stretch.[8] Traders will be watching whether call open interest and volume stay elevated, roll into later expiries or fade as the window progresses; persistent bullish flow would align with the long-biased IBM seasonal pattern, while a sharp reversal in options sentiment could signal that the crowd is using strength to de-risk instead.
Finally, earnings and guidance tone. While IBM does not have a confirmed earnings date inside this exact window, any updates on AI deal momentum, Red Hat growth or quantum commercialization could either validate or challenge the historical pattern of steady summer gains.[3][4][5] The cleanest confirmation that the IBM seasonal trend is repeating would be a period of choppy but upward-sloping price action with contained drawdowns, while a deep, sustained break below recent support would mark this midterm-year window as the first real outlier in the eight-cycle record.
Sources
- CNBC, "IBM is trying to rebound after results disappointed initially. What analysts and investors are saying," Oct 23, 2025.
- MarketWatch, "IBM’s stock is sliding. Here’s why these analysts see an opportunity to buy," Jul 24, 2025.
- Yahoo Finance (GuruFocus), "IBM Stock Tumbles. Solid Quarter Can't Offset Tepid Forecast," Apr 23, 2026.
- CNBC, "IBM tops third-quarter estimates and lifts guidance, but stock drops," Oct 22, 2025.
- Forbes, "What’s Happening With IBM Stock?," Oct 7, 2025.
- MarketWatch, "Why is IBM’s stock down after an earnings beat? Here’s one quibble," Jul 23, 2025.
- Barron's, "IBM Earnings Beat Estimates. The Stock Is Still Falling," Apr 22, 2026.
- Yahoo Finance, "IBM shares surge 15% after Trump video resurfaces," Jun 1, 2026.
- Business Insider, "IBM stock shoots higher after bullish Barclays forecast hits back at SaaSpocalypse fears," Jun 1, 2026.
About this seasonal analysis
Seasonal pattern data is sourced from TradeWave.ai, which analyzes historical price behavior across annual calendar windows going back up to 30 years. Read the full data methodology or the book The 100-Year Pattern by Afshin Moshrefi (2026 edition). Past performance of seasonal patterns does not guarantee future results. This article is for informational purposes only and does not constitute investment advice.